

The construct of perfectionism has been viewed from different perspectives. Some early theorists and researchers framed perfectionism as a unidimensional and pathological construct. For example, Burns (Reference Burns1980) noted that perfectionists’ high standards and self-critical evaluation led to lower levels of self-efficacy. Also, Pacht (Reference Pacht1984) viewed perfectionism as negative, claiming that it was a tendency to pursue unrealistically high goals. Others contended that some aspects of perfectionism were positive. For example, Adler (Reference Adler, Ansbacher and Ansbacher1956) maintained that striving for perfection was healthy when it included positive interactions with others and the maximising of one's potential.
In contrast to these unidimensional views of perfectionism, others have stressed that perfectionism is a multidimensional construct, which includes positive as well as negative aspects. For instance, Hamachek (Reference Hamachek1978) identified two subtypes of perfectionism: normal and neurotic. Normal perfectionists are persons who set high personal standards for themselves and accept the fact that these standards might not be met in all situations. In contrast, neurotic perfectionists set high personal standards in every situation and tend to judge their achievement harshly and are never completely satisfied with their work. Recent research has provided support to Hamachek's (Reference Hamachek1978) conceptualisation of perfectionism. A number of more recent studies have proposed conceptualising perfectionism as consisting of adaptive and maladaptive dimensions (see Ashby & Bruner, Reference Ashby and Bruner2005; Ashby, LoCicero, & Kenny, Reference Ashby, LoCicero and Kenny2003; DiPrima, Ashby, Gnilka, & Noble, Reference DiPrima, Ashby, Gnilka and Noble2011; Periasamy & Ashby, Reference Periasamy and Ashby2002; Rice & Slaney, Reference Rice and Slaney2002; Stoltz & Ashby, Reference Stoltz and Ashby2007).]
There is a global definition of perfectionism, which is the tendency to set high personal standards or high-performance expectations. It is also recognised that there are components of perfectionism, such as adaptive perfectionism, which has been conceptualised as high personal standards combined with low levels of negative self-evaluation; and maladaptive perfectionism, which emphasises high personal standards and extreme self-blame when failing to meet these standards (Rice & Ashby, Reference Rice and Ashby2007).
The Almost Perfect Scale — Revised (APS-R; Slaney, Rice, Mobley, Trippi, & Ashby, Reference Slaney, Rice, Mobley, Trippi and Ashby2001) is a widely used measure of multidimensional perfectionism. The APS-R includes adaptive and maladaptive dimensions of perfectionism within three subscales: High Standards, Discrepancy and Order (Ashby & Bruner, Reference Ashby and Bruner2005). The High Standards and Discrepancy subscales are often used to identify groups of adaptive and maladaptive perfectionists (Ganske & Ashby, Reference Ganske and Ashby2007; Stoltz & Ashby, Reference Stoltz and Ashby2007), while the Order subscale is used to measure preferences for organisation and neatness (Rice & Slaney, Reference Rice and Slaney2002). Individuals with adaptive perfectionism are those reporting high personal standards and low discrepancy scores (i.e., they experience low levels of distress when performance results do not meet their standards); individuals with maladaptive perfectionism are those reporting high personal standards and high discrepancy scores; and nonperfectionists are those reporting low personal standards scores. Studies using the APS-R have given support to the multidimensional conceptualisation of perfectionism. For example, Martin and Ashby (Reference Martin and Ashby2004) found that adaptive perfectionists demonstrated significantly greater cognitive complexity and more sophisticated intellectual development than nonperfectionists. Further, Dickinson and Ashby (Reference Dickinson and Ashby2005) found that maladaptive perfectionists used more immature ego defense styles than adaptive perfectionists.
Due to the different ways in which adaptive perfectionists, maladaptive perfectionists and nonperfectionists experience events, it is essential that counsellors have an awareness of how best to support these clients. When working with maladaptive perfectionists, counsellors need to make great efforts to explain to them the concept of discrepancy and how this discrepancy can hinder their academic progress and, as a consequence, affect their entire lives, in addition to helping them in setting realistic standards. Nonperfectionists, on the other hand, need to be taught how to set attainable goals, and what they have to do to achieve them, so that they become more motivated and more ambitious. As to adaptive perfectionists, they need to be provided with positive feedback in order to continue setting realistic standards and feel less distress if standards are not met.
Given that the techniques used in the counselling process may differ according to the type of clients, it is beneficial for counsellors to be aware of the differences among adaptive perfectionists, maladaptive perfectionists and nonperfectionists in terms of demographic, academic and mental health variables. That is, examination of these differences may shed some light on the characteristics of each type of perfectionists. This, in turn, can help in identifying the relevant counselling methods that could be used.
In order to investigate the differences between the perfectionism groups, several past studies have sought to examine the relationship of multidimensional perfectionism with various demographic, academic and mental health variables (e.g., Siegle & Schuler, Reference Siegle and Schuler2000; Rice & Ashby, Reference Rice and Ashby2002; Rice & Dellwo, Reference Rice and Dellwo2002). However, there is a paucity of studies exploring gender differences in perfectionism, and the relationship of perfectionism to self-efficacy, life-satisfaction and academic achievement, particularly among samples of high school students.
A review of the literature reveals that gender differences in perfectionism were only addressed in samples of middle school and college students. For example, Baker (Reference Baker1996) conducted a study on ninth grade students and found that gifted females had more perfectionist tendencies than gifted males. Another study by Rice and Slaney (Reference Rice and Slaney2002) investigated undergraduate students (ranging in age from 17 to 48 years) at a large, public university in the north central region of the United States. The results of this study indicated no significant gender differences in perfectionism.
Furthermore, the relationship between multidimensional perfectionism and self-efficacy has been examined, yet the published studies have utilised college students. For example, a study by LoCicero and Ashby (Reference LoCicero and Ashby2000) assessed this relationship in a sample of undergraduate students (mean age 19.81 years). Results of their study found that adaptive perfectionists scored significantly higher than both maladaptive perfectionists and non-perfectionists on general self-efficacy and social self-efficacy. In a related study, Ganske and Ashby (Reference Ganske and Ashby2007) examined the relationship between perfectionism and career decision-making self-efficacy in a sample of university students (mean age 22.9 years). The results of this study showed that adaptive perfectionists had significantly higher career decision-making self-efficacy than both maladaptive perfectionists and non-perfectionists, indicating that adaptive perfectionists have stronger beliefs in their abilities to successfully perform tasks necessary to making career decisions.
Regarding the relationship between multidimensional perfectionism and life satisfaction, studies investigating this relationship were conducted with samples of American middle school students (Gilman & Ashby, Reference Gilman and Ashby2003a) and Turkish adolescents (Ongen, Reference Ongen2009). The results of these studies indicated that adaptive perfectionists reported significantly higher satisfaction ratings than did both maladaptive perfectionists and nonperfectionists.
On the other hand, little research has been done on the relationship of multidimensional perfectionism to school variables such as academic achievement and satisfaction with academic achievement. A study by Accordino, Accordino, and Slaney (Reference Accordino, Accordino and Slaney2000) examined the relationship of multidimensional perfectionism to academic achievement and achievement motivation in a sample of American 10th- through 12th-grade students, ranging from 14 to 21 years of age. These students were selected from eight junior/senior high schools within Pennsylvania and Virginia. Results from their study indicated that students’ personal standards were significant predictors of academic achievement and achievement motivation. In a related study, Gilman and Ashby (Reference Gilman and Ashby2003b) investigated the relationship of multidimensional perfectionism to academic achievement in a sample of American middle school students ranging from 12 to 15 years of age. In this study, adaptive perfectionists reported significantly higher academic achievement than both maladaptive and nonperfectionist students. There was no difference between maladaptive perfectionists and nonperfectionists on the achievement variable.
In general, the results of these studies, which explore the relationship of perfectionism with self-efficacy, satisfaction with life, and academic achievement, are consistent with literature that suggests that perfectionism can be adaptive or maladaptive. However, since there is a clear lack of studies investigating this relationship among samples of high school students, further studies should be undertaken to bridge this gap. High school is a turbulent time in the lives of adolescents and the senior years bring many pressures. The pressure of trying to do well enough in school to carry on to further education, or get a good job, may lead students to place unrealistic demands on themselves. This in turn may lead to maladaptive perfectionism.
An extensive search of the literature failed to find any published study on perfectionism undertaken with a Jordanian sample, emphasising the need for studies to address this topic in the Jordanian context. The purpose of the present study was to examine the gender differences in perfectionism as well as to explore the relationship between perfectionism and a number of mental health and academic variables in a sample of Jordanian high school students. The following research questions were explored:
1. Are there significant gender differences on the High Standards and Discrepancy subscales of the multidimensional perfectionism scale for Jordanian high school students?
2. Are there significant differences between adaptive perfectionists, maladaptive perfectionists and nonperfectionists in self-efficacy, satisfaction with life, academic achievement and satisfaction with academic achievement among Jordanian high school students?
Method
Participants
A total of 419 high school students were selected using stratified random sampling from two urban schools, one for females and the other for males, in North Jordan. The sample was comprised of 197 (47.0%) female and 222 (53.0%) male students. There were 209 (49.9%) 11th graders and 210 (50.1%) 12th graders. Students ranged from 16 to 19 years of age (M = 17.53, SD = 0.58). They were from middle SES backgrounds. In the present study, SES was determined by level of family income.
Instruments
The APS-R (Slaney et al., Reference Slaney, Rice, Mobley, Trippi and Ashby2001) contains 23 items designed to measure adaptive and maladaptive components of perfectionism. Responses were rated on a 7-point scale ranging from 1 (strongly disagree) to 7 (strongly agree). The scale has three subscales: High Standards, 7 items measuring personal standards (e.g., ‘I have high expectations for myself’); Discrepancy, 12 items measuring distress caused by the discrepancy between performance and standards (e.g., ‘My performance rarely measures up to my standards’); and order, 4 items measuring degree of orderliness (e.g., ‘Neatness is important to me’). Given the order subscale is not used for classifying perfectionists, only the High Standards and Discrepancy subscales were used in this study. Validity of the two subscales (High Standards and Discrepancy) was supported by a confirmatory factor analysis. Factor loadings for the items of these subscales ranged from .38 to .71. Internal consistency reliabilities (Cronbach's alphas) for the subscales in this sample were .74 (High Standards) and .78 (Discrepancy).
The General Self-Efficacy Scale (GSES; Schwarzer & Jerusalem, Reference Schwarzer, Jerusalem, Wienman, Wright and Johnston1995) consists of 10 items. Participants respond to the items on a scale from 1 = not at all true through 4 = exactly true, where a higher score indicates a higher level of self-efficacy. An example item is: ‘No matter what comes my way, I am usually able to handle it’. For the present study, Cronbach's alpha was .76, and the corrected item-total correlations ranged from .32 to .48.
The Satisfaction With Life Scale (SWLS; Diener et al., Reference Diener, Emmons, Larsen and Griffin1985) measures global life satisfaction. It has five items measured along a 7-point Likert scale ranging from 1 (strongly disagree) to 7 (strongly agree), with higher scores reflecting greater satisfaction. A sample item is: ‘So far I have gotten the important things I want in life’. The SWLS has a 2-month test–retest correlation of .82 and an internal consistency of 0.87 (Diener et al., Reference Diener, Emmons, Larsen and Griffin1985). For the present study, Cronbach's alpha was .70, and the corrected item-total correlations ranged from .31 to .47.
The Arabic versions of the APS-R, the GSES and the SWLS were developed by using the back-translation method. More precisely, the scales were translated into Arabic and back-translated by two professional translators to assure equivalence, and any discrepancies between translations and back-translations were resolved by discussion.
Academic achievement was assessed by students’ cumulative grade point average (GPA) over two semesters. Students were required to report their cumulative GPA. The grading scale in Jordanian schools is from 0 to 100 (with a higher score equaling a higher GPA). Females had a mean of 86.3 and a standard deviation of 7.20, and males had a mean of 83.8 and a standard deviation of 8.86.
Satisfaction with academic achievement (SWAA) was assessed with the single-item question, ‘Up to which extent are you satisfied with your academic achievement?’ Responses were rated on a 5-point scale ranging from 1 = not at all to 5 = very.
Procedure
The study was conducted after approval was obtained from the Ministry of Education in Jordan. Participants in the study were chosen from the 11th and 12th grades, and oral informed consent was obtained from all of them. The participants were asked to complete a demographic sheet, the APS-R (Slaney et al., Reference Slaney, Rice, Mobley, Trippi and Ashby2001), the General Self-Efficacy Scale (GSES; Schwarzer & Jerusalem, Reference Schwarzer, Jerusalem, Wienman, Wright and Johnston1995), the Satisfaction With Life Scale (SWLS; Diener, Emmons, Larsen, & Griffin, Reference Diener, Emmons, Larsen and Griffin1985) and a single item scale to assess satisfaction with academic achievement. Also, self-reported GPA was obtained. The participants completed the questionnaires in one sitting during class time, and did not receive any compensation for their participation. The researcher oversaw the completion of the questionnaires.
Results
The first research question concerned gender differences on the High Standards and Discrepancy subscales of the APS-R. Accordingly, a multivariate analysis of variance (MANOVA) was conducted to examine the gender difference within each subscale of the APS-R. A significant gender difference emerged on the High Standards subscale, F(1,417) = 14.218, P = .03, with females (M = 44.30, SD = 5.06) scoring higher than males (M = 42.21, SD = 6.17). However, the effect size (partial η2) was small (.033). No significant gender difference was found on the Discrepancy subscale, F(1,417) = 1.522, P > .05. Statistical analysis was carried out using SPSS software version 10.0 for Windows.
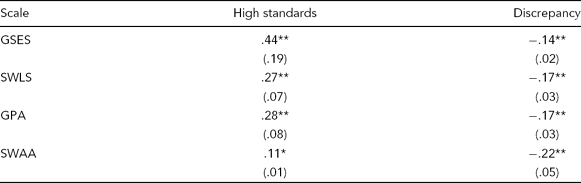
The second research question concerned differences in self-efficacy, satisfaction with life, academic achievement and satisfaction with academic achievement among perfectionism subtypes and nonperfectionists. As a preliminary analysis, Pearson bivariate correlations between the APS-R High Standards and Discrepancy subscales, the GSES, the SWLS, the self-reported GPA and the SWAA were conducted. The High Standards subscale was significantly and positively related to the GSES, the SWLS, self reported GPA and the SWAA, whereas the Discrepancy subscale was significantly and negatively related to these variables. Correlations and coefficients of determination (R2) are shown in Table 1.
Correlations and Coefficients of Determination (in Parentheses) Between the APS-R High Standards and Discrepancy Subscales, the GSES, the SWLS, the SWAA and the Self-Reported GPA
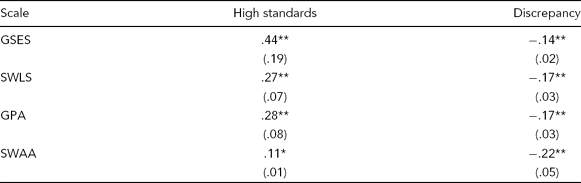
Note: GSES = General Self-Efficacy Scale; SWLS = Satisfaction With Life Scale; GPA = Grade Point Average; SWAA = Satisfaction With Academic Achievement.
* = p < .05; ** = p < .01
The median-split method was used to classify participants into adaptive perfectionists (i.e., those with high scores on the High Standards subscale and low scores on the Discrepancy subscale), maladaptive perfectionists (i.e., those with high scores on the High Standards subscale and high scores on the Discrepancy subscale), and nonperfectionists (i.e., those with low scores on the High Standards subscale). High Standards and Discrepancy medians were 44 and 51, respectively. The highest score on the High Standards subscale was 49, and the lowest was 7; with regard to the Discrepancy subscale, the highest score was 76, and the lowest was 12.
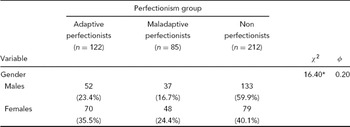
Gender differences among the perfectionism groups were evaluated using a Chi-square analysis. The distribution of group membership differed significantly across gender, with 35.5% of the females classified in the adaptive perfectionist group, 24.4% in the maladaptive perfectionist group, and 40.1% in the nonperfectionist group; whereas 23.4% of males were in the adaptive perfectionist group, 16.7% in the maladaptive perfectionist group, and 59.9% in the nonperfectionist group (See Table 2).
Distribution of Group Membership by Gender

Note: * = p < .0001
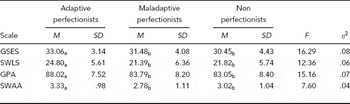
After perfectionism groups were identified, data were analysed using MANOVA. The between-subjects factor was perfectionism groups (adaptive perfectionists, maladaptive perfectionists, and nonperfectionists), and the dependent measures were GSES, SWLS, cumulative GPA and SWAA. The results of the MANOVA indicated significant differences between groups on all variables. The Scheffe post hoc multiple comparison procedure was used to examine differences between these groups on the individual dependent variables. This procedure yielded the following significant differences: Adaptive perfectionists had significantly higher scores on all dependent variables than did both maladaptive perfectionists and nonperfectionists. Additionally, there were no significant differences between maladaptive perfectionists and nonperfectionists on these variables (See Table 3).
Means and Standard Deviations by Perfectionism Group

Note: Results of the MANOVA were significant at p < .0001, with the exception of SWAA (p < .001). F tests for perfectionism groups were based on df = 2,416. Values with different subscripts indicate significant within-row differences between the groups (Scheffe post hoc comparisons, p < .05).
Discussion
The first research question of this study considered whether gender differences would be apparent on the High Standards and Discrepancy subscales of the APS-R in a sample of Jordanian high school students. Gender differences emerged on the High Standards subscale, with females scoring significantly higher than males. Consistent with this result, there were significantly more females represented in the adaptive and maladaptive perfectionist groups than males. Thus, it appears that female students are more perfectionist than male students. These results are consistent with those of Baker (Reference Baker1996), who found that gifted females in ninth grade reported higher levels of perfectionism than gifted males, and inconsistent with those of Rice and Slaney (Reference Rice and Slaney2002), who found no significant differences between the perfectionism groups across gender.
Based on the present results, counsellors working with high school students should consider that female students may hold higher personal standards than male students. As such, female students might demonstrate achievement motivation and academic success; or they might experience high levels of anxiety and other emotional disorders. That is, the less discrepancy they experience, the better their outcomes, and vice versa.
The second research question related to differences in general self-efficacy, satisfaction with life, academic achievement and satisfaction with academic achievement between the perfectionism groups. With regard to the general self-efficacy variable, results showed that adaptive perfectionists reported significantly higher general self-efficacy than did both maladaptive perfectionists and nonperfectionists. The results of this study replicate those from LoCicero and Ashby (Reference LoCicero and Ashby2000), who found that perfectionism was related to self-efficacy in college students, and Ganske and Ashby (Reference Ganske and Ashby2007), who found that perfectionism was related to career decision-making self-efficacy in a sample of university students.
Likewise with respect to the satisfaction with life variable, it was found that adaptive perfectionists scored significantly higher on the satisfaction with life scale than did maladaptive perfectionists and nonperfectionists. These results confirm findings from Gilman and Ashby (Reference Gilman and Ashby2003a), who found that adaptive perfectionists reported significantly higher satisfaction ratings on self-satisfaction than both maladaptive and nonperfectionists; and Ongen (Reference Ongen2009), who found that high standards and orderliness were positive predictors of life satisfaction, whereas discrepancy was a negative predictor of life satisfaction.
Also regarding the academic achievement variable, adaptive perfectionists demonstrated higher academic achievement than did the other two groups. These results are consistent with those reported by Gilman and Ashby (Reference Gilman and Ashby2003b), who examined multidimensional perfectionism in a sample of middle school students and found that adaptive perfectionists reported a significantly higher GPA than those reported among maladaptive and nonperfectionists. In addition, in the current study, adaptive perfectionists reported significantly higher satisfaction with academic achievement than did the other groups. Thus, these results offer further evidence that perfectionism has positive aspects.
One possible reason that maladaptive perfectionists and nonperfectionists had similar scores on all dependent measures may be due to the high discrepancy scores that both groups demonstrate. Specifically, high discrepancy may lead to high distress and, as a consequence, to low grades, low satisfaction with these grades, low satisfaction with life and low self-efficacy. School counsellors should work on increasing students’ awareness of the negative effects of discrepancy on achievement and life satisfaction. It may also be beneficial for these students to be well acquainted with the factors that make their adaptive perfectionist counterparts successful.
It is clear that adaptive perfectionists scored higher than maladaptive perfectionists and nonperfectionists on the academic variables (i.e., academic achievement and satisfaction with academic achievement) and the mental health variables (i.e., life-satisfaction and general self-efficacy) investigated in this study, indicating that adaptive perfectionism can serve as a strength or positive motivator for high school students. Thus, school counsellors should design and implement prevention and intervention programs that aim to enable students to set realistically high standards and reduce discrepancy between personal standards and performance. Accordino et al. (Reference Accordino, Accordino and Slaney2000) suggested that the components of such programs might include teaching students how to set their goals, in addition to giving students positive reinforcement for achieving these goals. It is noteworthy that these components may differ according to each perfectionism group. Counselling services that could be offered for nonperfectionists could focus more on increasing their motivation to learn and helping them set realistic personal standards, whereas those offered for maladaptive perfectionists should pay more attention to teaching them to accept their limitations and/or lower their standards. In contrast, adaptive perfectionists should be reinforced or rewarded for their rational thinking, which is based on the fact that goals will not be constantly achieved.
Given that the sample of this study was selected from an urban area with a middle level of SES, the generalisability of these results is limited. Future studies could examine gender differences in perfectionism, and explore the relationship of perfectionism with the other variables, not only in diverse samples of high school students, but also in younger and older students, to explore whether the results of this study can be replicated in other categories of students in Jordanian culture.
Finally, the results of the current study are consistent with previous studies used the APS-R for measuring multidimensional perfectionism, thereby it is reasonable to conclude that these results provide some support for the validity of the High Standards and Discrepancy subscales of the APS-R. Thus, they are recommended to be used in future research and as a diagnostic means by school counsellors.