1. Introduction
Subsurface flow pathways are vital for geothermal energy production (e.g. Gan & Elsworth, Reference Gan and Elsworth2014), aquifer recharge and connectivity (e.g. Bauer et al. Reference Bauer, Schröckenfuchs and Decker2016) and hydrocarbon extraction (e.g. Fisher & Knipe, Reference Fisher and Knipe2001). Conversely, geological barriers or baffles to fluid flow are necessary for sustainable and long-term disposal of hazardous waste (e.g. Gautschi, Reference Gautschi2001) and carbon dioxide sequestration (e.g. Vialle et al. Reference Vialle, Ajo-Franklin and Carey2018) in the subsurface. Permeability in low-porosity carbonate rocks is primarily controlled by faults and fractures (e.g. Lattman & Parizek, Reference Lattman and Parizek1964; Ferrill et al. Reference Ferrill, McGinnis, Morris and Smart2012 a, Reference Ferrill, Smart, Morris, Ogilvie, Dee, Wilson and Bailey2020 b; Bisdom et al. Reference Bisdom, Bertotti and Bezerra2017), but adequate sampling of these structures in the subsurface remains problematic. Borehole data can provide detailed information about fracture networks in the subsurface (e.g. Cooper, Reference Cooper and McClay1991), but predicting fracture patterns away from wells is challenging (e.g. De Marsily, Reference De Marsily, Delay, Gonçalvès, Renard, Teles and Violette2005; Hooker et al. Reference Hooker, Laubach and Marrett2014; McGinnis et al. Reference McGinnis, Ferrill, Smart, Morris, Higuera-Diaz and Prawica2015). Where faults and fractures are resolvable in seismic data, only the largest structures in a given population are imaged (e.g. Yielding et al. Reference Yielding, Needham and Jones1996; Rawnsley et al. Reference Rawnsley, De Keijzer, Wei, Bettembourg, Asyee, Massaferro, Swaby, Drysdale, Boettcher, Lonergan, Jolly, Rawnsley and Sanderson2007; Worthington & Lubbe, Reference Worthington, Lubbe, Lonergan, Jolly, Rawnsley and Sanderson2007), and therefore the contribution of sub-seismic faults and fractures to permeability structure is often poorly constrained (Morris et al. Reference Morris, Ferrill and McGinnis2009 a).
Outcrop-based approaches to fracture characterization (e.g. Brenner & Gudmundsson, Reference Brenner, Gudmundsson, Cosgrove and Engelder2004; Ferrill & Morris, Reference Ferrill and Morris2008; Hooker et al. Reference Hooker, Laubach and Marrett2013; McGinnis et al. Reference McGinnis, Ferrill, Smart, Morris, Higuera-Diaz and Prawica2015; Cilona et al. Reference Cilona, Aydin, Likerman, Parker and Cherry2016; Laubach et al. Reference Laubach, Lamarche, Gauthier, Dunne and Sanderson2018) may circumvent some of the challenges related to subsurface sampling, provided that applicable outcrop analogues and sampling strategies are chosen. Outcrop studies have shown that fracture patterns in multilayer systems can vary according to structural (e.g. Price, Reference Price1966; Stearns & Friedman, Reference Stearns, Friedman and Gould1972; Hancock, Reference Hancock1985; Nelson, Reference Nelson2001; Morris et al. Reference Morris, McGinnis and Ferrill2014) and stratigraphic factors (e.g. Rijken & Cooke, Reference Rijken and Cooke2001; Ferrill & Morris, Reference Ferrill and Morris2003 a,b; Laubach et al. Reference Laubach, Olson and Gross2009; Ferrill et al. Reference Ferrill, McGinnis, Morris, Smart, Sickmann, Bentz, Lehrmann and Evans2014). Documented controls on fracture abundance (spacing, density or intensity) include bed thickness (e.g. Harris et al. Reference Harris, Taylor and Walper1960, Price, Reference Price1966; McQuillan, Reference McQuillan1973; Ladeira & Price, Reference Ladeira and Price1981; Corbett et al. Reference Corbett, Friedman and Spang1987; Huang & Angelier, Reference Huang and Angelier1989; Narr & Suppe, Reference Narr and Suppe1991; McGinnis et al. Reference McGinnis, Ferrill, Morris, Smart and Lehrmann2017), grain size (Gasparrini et al. Reference Gasparrini, Lacombe, Rohais, Belkacemi and Euzen2021), mechanical layer thickness (e.g. Gross, Reference Gross1993), apparent rock strength (e.g. Price, Reference Price1966; Clarke & Burbank, Reference Clarke and Burbank2011; Ferrill et al. Reference Ferrill, McGinnis, Morris, Smart, Sickmann, Bentz, Lehrmann and Evans2014; McGinnis et al. Reference McGinnis, Ferrill, Morris, Smart and Lehrmann2017), subcritical crack growth (Atkinson, Reference Atkinson1984; Schultz, Reference Schultz2000; Olson, Reference Olson, Engelder and Cosgrove2004), structural position (e.g. Price, Reference Price1966; Stearns & Friedman, Reference Stearns, Friedman and Gould1972; Zahm & Hennings, Reference Zahm and Hennings2009; Morris et al. Reference Morris, McGinnis and Ferrill2014), fracture cementation (Hooker et al. Reference Hooker, Laubach and Marrett2013; Hooker & Katz, Reference Hooker and Katz2015) and rock composition (e.g. Handin et al. Reference Handin, Hager, Friedman and Feather1963; Nelson, Reference Nelson2001). Previous studies have also investigated the relationship between mechanical stratigraphy and fracture stratigraphy. They reveal that while fracture stratigraphy reflects the mechanical stratigraphy during failure, mechanical properties change over time and therefore progressive diagenesis of the rock should be considered (Laubach et al. Reference Laubach, Olson and Gross2009).
While systematic relationships between fracture patterns and structural or stratigraphic factors have been documented in a number of cases, studies have also shown that systematic relationships are not always identifiable (e.g. McQuillan, Reference McQuillan1973; Lamarche et al. Reference Lamarche, Lavenu, Gauthier, Guglielmi and Jayet2012; McGinnis et al. Reference McGinnis, Ferrill, Smart, Morris, Higuera-Diaz and Prawica2015). The mechanical strength of rock layers, layer thickness and layer interfaces in sedimentary successions (collectively referred to as ‘mechanical stratigraphy’) have been shown to be an important factor in controlling fracture containment, vertical persistence (Stowell, Reference Stowell2001) and the likelihood for fractures to propagate across multiple layers (e.g. Gillespie et al. Reference Gillespie, Walsh, Waterson, Bonson and Manzocchi2001; Ferrill & Morris, Reference Ferrill and Morris2008; McGinnis et al. Reference McGinnis, Ferrill, Morris, Smart and Lehrmann2017; Douma et al. Reference Douma, Regelink, Bertotti, Boersma and Barnhoorn2019). Where layer interfaces are weak or intervals between competent beds have low stiffness (e.g. low Young’s modulus), fractures are less likely to propagate across layers (e.g. Corbett et al. Reference Corbett, Friedman and Spang1987; Lorenz et al. Reference Lorenz, Sterling, Schechter, Whigham and Jensen2002; Bourne, Reference Bourne2003; Ferrill et al. Reference Ferrill, McGinnis, Morris, Smart, Sickmann, Bentz, Lehrmann and Evans2014; Giorgetti et al. Reference Giorgetti, Collettini, Scuderi, Barchi and Tesei2016; Na et al. Reference Na, Sun, Ingraham and Yoon2017). Bed-contained fractures in competent rock layers may therefore exhibit variable patterns from bed to bed (or between exposed bedding pavements), as previously documented at Canyon Lake Gorge, Texas (McGinnis et al. Reference McGinnis, Ferrill, Smart, Morris, Higuera-Diaz and Prawica2015).
The purpose of this study is to assess how relatively incompetent beds and weak bed interfaces influence fracture containment within relatively competent beds and fracture propagation across sedimentary sequences. Incompetent lithologies are generally less resistant to weathering than competent strata (e.g. Ledbetter Ferrill & Ferrill, Reference Ledbetter Ferrill and Ferrill2021), and therefore outcrop-based fracture studies tend to focus on preferentially exposed competent units. Consequently, fracture patterns in relatively weak, weathered interbeds are less extensively characterized. Here we assess fault and fracture patterns in both competent and incompetent intervals in a carbonate succession by systematically sampling and mapping a series of interbedded packstone and wackestone units. Photogrammetric reconstruction, digital fracture mapping, compositional analysis, fracture intensity assessment and field data are used to characterize the role of mechanical stratigraphy on fault and fracture patterns. We show that unit and interface compositions are key controls on fault and fracture patterns, and that relatively minor bed-to-bed changes in clay content influence fracture propagation and containment. These findings have implications for predicting pathways, baffles and barriers for fluid flow in the subsurface, with applicability to groundwater management, hydrocarbon extraction, geothermal energy, and subsurface storage and sequestration.
2. Geologic background
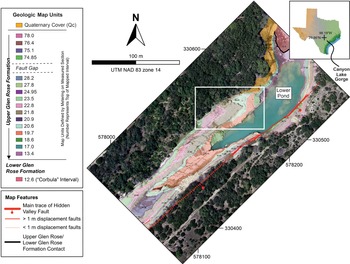
Canyon Lake Gorge, located in the Balcones fault system of south-central Texas, provides an excellent exposure of the Hidden Valley fault zone, Cretaceous Glen Rose Formation carbonates and well-preserved fault and fracture networks (Fig. 1). The Balcones fault system formed in Oligocene–Miocene time to accommodate subsidence of the Gulf of Mexico basin margin (Ferrill et al. Reference Ferrill, Morris, McGinnis, Sharp, Jr, Green and Schindel2019 and references therein), and defines the transition between structurally stable flat-lying rocks of the Texas craton and the gently coastward-dipping sedimentary deposits of the Gulf of Mexico (Foley, Reference Foley1926; Murray, Reference Murray1961; Young, Reference Young, Barnes, Bell, Clabaugh, Cloud, McGehee, Rodda and Young1972; McGinnis et al. Reference McGinnis, Ferrill, Smart, Morris, Higuera-Diaz and Prawica2015). The Hidden Valley fault zone is 43–98 m wide with an average strike and dip of 057° and 67°, respectively (Ferrill et al. Reference Ferrill, Morris, McGinnis, Smart and Ward2011; McGinnis et al. Reference McGinnis, Ferrill, Smart, Morris, Higuera-Diaz and Prawica2015). The exposed fault zone has provided a study area for numerous fault deformation analyses in mechanically layered carbonates for over two decades (e.g. Ferrill & Morris, Reference Ferrill and Morris2008; Ferrill et al. Reference Ferrill, Morris, Sims, Green, Franklin and Waiting2008, Reference Ferrill, Morris and McGinnis2009, Reference Ferrill, Morris, McGinnis, Smart and Ward2011, Reference Ferrill, McGinnis, Morris and Smart2012 a, Reference Ferrill, Evans, McGinnis, Morris, Smart, Lehrmann, Gulliver and Sickmann2020 a,b; Morris et al. Reference Morris, Ferrill and McGinnis2009 b; Reference Morris, McGinnis and Ferrill2014) and analogues for deformation in mechanically layered reservoirs regionally and around the world (e.g. Bodziak et al. Reference Bodziak, Clemons, Stephens and Meek2014; Agar & Geiger, Reference Agar, Geiger, Agar and Geiger2015; Solum & Huisman, Reference Solum and Huisman2017; Li et al. Reference Li, Laubach, Gale and Marrett2018). The fault and fracture networks exposed at Canyon Lake Gorge represent surface analogues for subsurface structures that may occur at depths (<5 km) typical for oil and gas reservoirs, CO2 storage sites and groundwater aquifers. Specifically, the faults and fractures at Canyon Lake Gorge are direct analogues for groundwater flow pathways in the Glen Rose Formation in south Texas (M. A. Giles, unpub. M.S. thesis, Univ. Texas at San Antonio, 1992; Ferrill et al. Reference Ferrill, Morris, Sims, Green, Franklin and Waiting2008; McGinnis et al. Reference McGinnis, Ferrill, Smart, Morris, Higuera-Diaz and Prawica2015).
Geologic map showing location of the study site (white outlined box) at Canyon Lake Gorge, Comal County, Texas. Map modified from Ferrill et al. (Reference Ferrill, Morris, McGinnis, Smart and Ward2011).

The rocks exposed in Canyon Lake Gorge are part of the Cretaceous Glen Rose Formation, the upper unit of the Trinity Group (Ward & Ward, Reference Ward, Ward and Scott2007; Ferrill et al. Reference Ferrill, Morris, McGinnis, Smart and Ward2011; Fig. 1). Both the upper and lower parts of the Glen Rose Formation are composed of cyclic depositional units on several scales, with the smallest scale cycles ranging from a few decimetres to 3 m thick (Ward & Ward, Reference Ward, Ward and Scott2007; Ferrill et al. Reference Ferrill, Morris, McGinnis, Smart and Ward2011). Lithologic units exposed in Canyon Lake Gorge include shallow water wackestone, packstone, grainstone, finely crystalline dolostone beds and a terrigenous claystone (Ward & Ward, Reference Ward, Ward and Scott2007; Ferrill et al. Reference Ferrill, Morris, McGinnis, Smart and Ward2011).
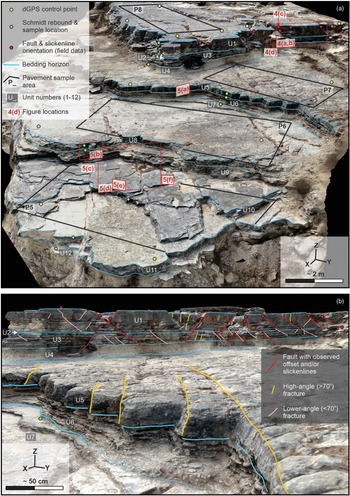
Approximately 5 m of the stratigraphic section is exposed across a series of stepped, bedding pavement surfaces at the study site, which is located in the northeastern part of Canyon Lake Gorge (Fig. 2). Fracture patterns in this area were assessed by McGinnis et al. (Reference McGinnis, Ferrill, Smart, Morris, Higuera-Diaz and Prawica2015) through field-based fractured pavement mapping (see figs 1–3 in McGinnis et al. Reference McGinnis, Ferrill, Smart, Morris, Higuera-Diaz and Prawica2015). The authors found that fault and fracture patterns in the area exhibit variability in both orientation and areal intensity (total mapped fracture length per unit area) between exposed pavements, and that no direct relationship between bed thickness and fault or fracture frequency could be detected. We build upon the work of McGinnis et al. (Reference McGinnis, Ferrill, Smart, Morris, Higuera-Diaz and Prawica2015) and extend their two-dimensional analyses of fracture patterns by (i) mapping fracture patterns in three dimensions across the study area, (ii) assessing vertical persistence of fractures through the exposure, and (iii) characterizing the influence of composition on fracture abundance and vertical persistence through the exposed carbonate succession at the site.
Photogrammetric reconstruction of the study site in the northeastern part of Canyon Lake Gorge. (a) Summary bedding horizon interpretations, unit numbers, Schmidt rebound and sample locations, pavement sample areas, faults identified during fieldwork and locations of Figures 4 and 5. Direction of view is to the west. (b) Summary fault, fracture and bedding horizon interpretations on the photogrammetric reconstruction. Direction of view is to the southwest. Note that only a subsample of the fault and fracture population is shown for clarity. A 3D version of the photogrammetric reconstruction is available to view at https://bit.ly/3HHOLpm.

3. Methods and data
3.a. Lithological and mechanical stratigraphic characterization and compositional analysis
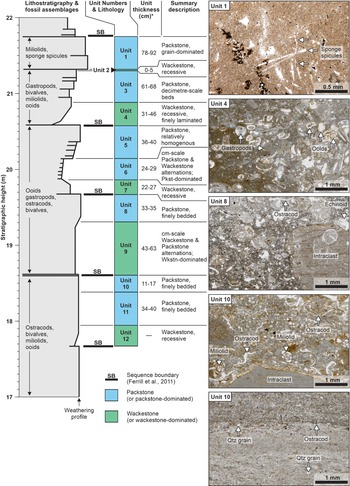
Twelve lithostratigraphic units are defined in this study (Fig. 3) based on outcrop morphology (weathering profile) and field observations of lithological variations through the exposed section. Lithological descriptions and interpretations of fossil assemblages in the study area were derived from field observations, photomicrograph interpretations and from the published lithostratigraphy of Canyon Lake Gorge (Ward & Ward, Reference Ward, Ward and Scott2007; Ferrill et al. Reference Ferrill, Morris, McGinnis, Smart and Ward2011). The previously published lithostratigraphy was modified and subdivided in the study area into 12 lithologic units (U1–U12). An N-type Schmidt hammer was used to measure the present-day, in situ elastic rebound of each lithologic unit at sample collection locations (see Fig. 2a for sampling locations) following the protocol of Morris et al. (Reference Morris, Ferrill and McGinnis2009 b). Rebound data was used to characterize the relative stiffness of individual bedding layers and provides an approximation of rock strength. As noted by Morris et al. (Reference Morris, Ferrill and McGinnis2009 b), Schmidt rebound values do not provide a direct measure of rock strength, but rather a proxy for present-day rock mechanical properties in outcrop (Katz et al. Reference Katz, Reches and Roegiers2000; Aydin & Basu, Reference Aydin and Basu2005).
Lithostratigraphic column with assigned unit numbers, measured interval thicknesses, summary descriptions of assigned units and photomicrographs showing fossil assemblages and sedimentary textures in Units 1, 4, 8 and 10. Lithostratigraphy and fossil assemblages modified from Ferrill et al. (Reference Ferrill, Morris, McGinnis, Smart and Ward2011). Unit thickness ranges shown were measured using projected polylines from mapping of the georeferenced photogrammetric reconstruction. Mismatches between measured thicknesses in this study and those represented by the modified lithostratigraphy of Ferrill et al. (Reference Ferrill, Morris, McGinnis, Smart and Ward2011) are attributed to lateral variations in unit thicknesses and thicknesses measured by Ferrill et al. (Reference Ferrill, Morris, McGinnis, Smart and Ward2011) being outside of our immediate study area.

Samples from each of the 12 lithostratigraphic units (at sample locations mentioned above with Schmidt rebound data) were collected for X-ray diffraction (XRD) compositional analysis. Samples were analysed by Ryan King at Ellington Geological Services (Houston, Texas) for weight percentage of various minerals including quartz and feldspars, total clay and total carbonate. Samples were rinsed and air dried before being homogenized and crushed to <150 micron (100 mesh) prior to analysis. Bulk XRD was performed using a Bruker D2 Phaser. All diffraction patterns were hand-interpreted using the Reference Intensity Ratio (RIR) technique, MDI Jade software and PDF 4+ mineral diffraction database. Samples were then run through the D2 Phaser three times (as received, after 12 hours of glycolation and after heat treatment at 550 °C) to identify and quantify the clay species.
3.b. Field-based structural characterization
Faults in this study are defined as discrete fractures that exhibit either measurable displacement or visible evidence of slip in the form of slickenlines. Where brittle failure surfaces show no detectable evidence of either displacement or slickenlines, these surfaces were classified using the generic term ‘fracture’. Non-fault fractures are subdivided into two categories based on their orientation with respect to bedding. ‘High-angle fractures’ have orientations that are >70° to bedding. ‘Lower-angle fractures’ have orientations that are <70° to bedding (Fig. 2). Where faults were measured in the field (shown by red dots in Fig. 2), fault orientations (strike and dip; using the right-hand rule where dip is to the right of the reported strike azimuth), fault slip directions (slickenline rake on the fault surface measured clockwise in the fault plane from the reported strike azimuth) and fault displacements parallel to fault plane slickenlines were measured by hand with a compass clinometer and folding ruler. The locations of faults measured in the field provided the basis for digital mapping and identification of faults where slickenlines could not be resolved in the photogrammetric reconstruction. Detailed observations of fault and fracture characteristics (e.g. terminations, linkage and morphology) were generally made in the field prior to subsequent digital interpretation of faults, fractures and bedding horizons.
3.c. Acquisition and processing of photogrammetry data
A total of 6300 aerial images were collected at the study site for subsequent photogrammetric reconstruction of the outcrop. Aerial photographs were acquired with a 24 mm focal length, 20 megapixel camera onboard a DJI Phantom 4 Pro unmanned aerial vehicle. Images were acquired using a fixed two-second interval shooting mode, a fixed ISO value of 400, variable shutter speeds and variable apertures. Image acquisition was carried out following established protocols (James & Robson, Reference James and Robson2012; Cawood & Bond, Reference Cawood and Bond2018) to ensure sufficient overlap between images for photogrammetric reconstruction.
Digital reconstruction of the study site was achieved by aligning and processing aerial images using the digital photogrammetry structure-from-motion software Agisoft Metashape Professional (see Cawood et al. Reference Cawood, Bond, Howell, Butler and Totake2017 for details of photogrammetric processing steps). Image alignment and data processing yielded a dense point-cloud containing c. 14 million points, with an average point spacing of c. 9 mm over c. 1480 m2. This point-cloud and a derived orthomosaic of 1.7 mm ground pixel resolution, also generated in Agisoft Metashape Professional, were used for subsequent interpretation and digitization of fracture traces and bed boundaries. Georeferencing of the outcrop reconstruction was achieved by surveying the positions of ground control points with a real-time kinematic differential global positional system (RTKDGPS). Fourteen ground control point locations (Fig. 2) were used to calibrate x, y and z point coordinates within the georeferenced point-cloud, and provided an estimated 12–15 mm absolute accuracy for the photogrammetric reconstruction and derived orthomosaic. In addition, accuracy of the photogrammetric reconstruction was assessed using previously published bed thickness measurements (McGinnis et al. Reference McGinnis, Ferrill, Smart, Morris, Higuera-Diaz and Prawica2015), as well as our own field measurements of bedding and fault surface orientations.
3.d. Fault and fracture digitization
Initial calibration of digital fault and fracture interpretations was achieved by comparing our results with previously published, field-mapping-derived pavement fracture maps of McGinnis et al. (Reference McGinnis, Ferrill, Smart, Morris, Higuera-Diaz and Prawica2015). Digital fault and fracture interpretation of bedding pavements P5–P8 (using the pavement naming convention of McGinnis et al. Reference McGinnis, Ferrill, Smart, Morris, Higuera-Diaz and Prawica2015) was carried out in ArcMap 10.5.1 (ESRI) on the point-cloud-derived 2D orthomosaic of the study area (see Fig. 2 for pavement locations). Fracture digitization on the 2D orthomosaic was performed using a maximum zoom ratio of 1:3 to ensure that the orthomosaic was not too pixelated to discern details. Protocols for fracture mapping also included avoiding fracture digitization where pavement fracture traces were partially obscured by vegetation or debris. In cases where single fractures on bedding pavements hosted voids filled with dirt, debris or vegetation, fractures were digitized where visible along void edges to avoid interpreting fractures in zones with poor exposure.
Areal fault and fracture intensities (length per unit area) on bedding pavements were generated using the Line Density tool in ArcMap 10.5.1 (ESRI) with an output cell size of 0.05 m and a sampling circle with a radius of 0.5 m. The Line Density tool calculates fault or fracture intensity by dividing the summed length of digitized fracture traces within a sampling circle and divides that length by the circle area. Calculated fault or fracture intensity values are assigned to gridded raster cells, which in this case have dimensions of 0.05 m by 0.05 m. It should be noted that sampling circles and grid cells are not the same size. This results in overlapping sampling circles across the sampled domain. Three-dimensional interpretations of faults, fractures and bedding horizons on the photogrammetric reconstruction (see Fig. 2) were made using the 3D polyline tool in Agisoft Metashape Professional following similar protocols used during orthomosaic interpretation in 2D.
3.e. Cross-section construction and polyline projection
Subsequent to 3D digitization of fractures on the digital outcrop, the orientations of digitized faults and fractures were measured in CloudCompare (Girardeau-Montaut, Reference Girardeau-Montaut2011), and structures parallel or sub-parallel to the Hidden Valley fault were projected onto a digital cross-section for 2D analysis (see Cawood et al. Reference Cawood, Corradetti, Granado and Tavani2022 for data projection protocols). Only the Hidden-Valley-fault-parallel faults and fractures (including those synthetic and antithetic to the Hidden Valley fault) were projected onto a cross-section in order to focus on the prevalent set of faults and fractures that trend parallel to the Hidden Valley fault, and to avoid orientation bias and the projection of structures not perpendicular to the projection plane. Fault, fracture and bed horizon polyline interpretations were projected to a cross-section oriented SSE–NNW (147°) in Move 2019.1TM (Petroleum Experts Ltd.) using a projection vector perpendicular to the cross-section and parallel to the strike of the Hidden Valley fault (057°; Ferrill et al. Reference Ferrill, Morris, McGinnis, Smart and Ward2011). Projected and resampled polyline interpretations were used to calculate 2D areas of lithologic units and cross-section lengths of projected faults and fractures within an interpretation boundary. This information was used to calculate average fracture intensity (total fracture length per unit area (m/m2)) in cross-section for each of the assigned lithologic units.
4. Results
4.a. Lithostratigraphy and unit composition
Lithologies exposed at the study site (Fig. 1) include packstones, wackestones and thinly bedded intervals that we describe as packstone-dominated or wackestone-dominated (Fig. 3). Of the 12 lithologic units (U1–U12) assigned to the study area, five units (U2, U4, U7, U9, U12) are defined as wackestones or wackestone-dominated, and seven units (U1, U3, U5, U6, U8, U10, U11) are defined as packstones or packstone-dominated (Table 1). Bed thicknesses vary across relatively short distances (<10 m laterally) in all of the lithologic units (Fig. 3), and the Unit 2 wackestone shows thickness changes from a maximum of ∼5 cm to an interpreted 0 cm, where this unit appears as a weathered (open) parting between Units 1 and 3. The weathering profile through the exposed strata in the study area (modified from Ferrill et al. Reference Ferrill, Morris, McGinnis, Smart and Ward2011) shows an apparent, but not universal, relationship between lithology and resistance to weathering. Wackestone and wackestone-dominated intervals are generally more recessive and weathered than more competent packstone units. The exception to this general trend is where packstone-dominated intervals are characterized by centimetre-scale alternations between thicker packstone beds and thinner wackestone beds, despite being dominantly packstone (e.g. Unit 6; Fig. 3).
Lithology, average bed thickness, summary composition data, Schmidt rebound and summary fracture data for each of the 12 lithologic units

* Note that fracture lengths and calculated fracture intensities are not provided for Unit 2 because of changes in unit thickness, and the potential for miscalculating unit areas and associated fracture intensities. The lower boundary of Unit 12 is poorly exposed and therefore bed thickness, bed area, and fracture lengths/intensities were not calculated for this unit.
Fossil assemblages vary through the lithologic units, with ooids, gastropods, bivalves, ostracods, miliolids and sponge spicules present to varying degrees through Units 1–12 (Fig. 3). Composition and Schmidt rebound are variable through the exposed section (Table 1). The wackestone and wackestone-dominated Units 2, 4, 7, 9 and 12 have relatively high clay (6.61 to 9.88 %) and low carbonate (77.01 to 82.78 %) weight percentages, and relatively low average rebound values (9.6 to 14.1). Packstone and packstone-dominated Units 1, 3, 10 and 11 have relatively low clay (3.04 to 3.92 %) and high carbonate (87.72 to 89.33 %) weight percentages, and relatively high average rebound values (31.7 to 46.4). The packstone Units 5, 6 and 8 have higher clay (6.18 %, 6.32 %, 5.61 %) and lower carbonate (83.19 %, 82.03 %, 83.97 %) weight percentages than the other packstone and packstone-dominated units, and high rebound (46.3, 43.0, 39.1) values (Table 1).
4.b. Structural observations
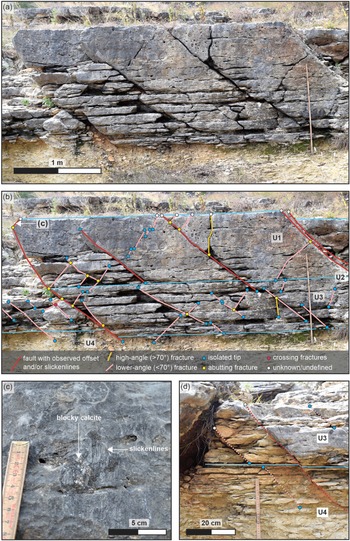
Brittle deformation in Units 1, 2 and 3 is dominated by normal faults (where offset or slickenlines were observed) and by lower-angle (<70° to bedding) fractures (where no visible offset or slickenlines are present). Most faults and lower-angle fractures in Units 1–3 exhibit similar orientations through vertical exposures of Units 1–3, dipping SSE and synthetic to the Hidden Valley fault, while some faults and lower-angle fractures dip in the opposite direction towards the NNW and antithetic to the Hidden Valley fault (Fig. 4a, b). High-angle fractures (>70° to bedding) are also present in Units 1–3, but these are relatively rare (Fig. 4b). No systematic abutting relationships are observed between lower-angle fractures and normal faults in Units 1, 2 and 3 (Fig. 4b). Intersections of high-angle fractures with lower-angle fractures are rare. The two high-angle fractures in Figure 4b terminate against a lower-angle fracture and a normal fault, indicating that the high-angle fractures formed after the lower-angle failure surfaces.
(a) Field photograph showing vertical exposure of packstone beds U1 and U3, and underlying wackestone U4. (b) Annotated field photograph showing fracture abutting relationships and vertical penetration. (c) Slickenlines and blocky calcite on identified fault surface (location of fault surface shown in (b)). (d) Fractures and sub-parallel fault that are vertically persistent through the packstone unit but terminate within underlying wackestone unit. See Figure 2 for field photograph locations. Blue lines in (b) and (d) denote lithologic unit boundaries.

Fault surfaces identified in Units 1–3 record normal displacements of up to 15 cm (Table 2). In addition to visible offset, a number of the identified faults in Units 1–3 show evidence for slip in the form of slickenlines (Fig. 4c). These slickenlines record dominantly dip-slip motion along fault planes, with slickenline rakes of 78° to 90° (Table 2). Blocky calcite was identified adjacent to slickenlines on one fault plane in Unit 1 (Fig. 4c), which may be indicative of hybrid (combined tensile and shear) failure (Ferrill et al. Reference Ferrill, McGinnis, Morris and Smart2012 a, Reference Ferrill, Smart, Morris, Ogilvie, Dee, Wilson and Bailey2020 b,c). Most faults and fractures present in Units 1–3 tend to persist for tens of centimetres across this interval but terminate at or within a few centimetres of the boundary between the Unit 3 packstone and the underlying Unit 4 packstone (Figs 2b, 4b). Exceptions to this general trend, where lower-angle fractures or faults persist downwards by as much as 15 cm from the U3–U4 boundary, appear to be coincident with blockier zones in Unit 4, where this unit may locally contain more packstone (Fig. 4d). With the exception of occasional faults and fractures that terminate in the upper part of Unit 4, this interval is generally devoid of brittle deformation structures, particularly in the middle and lower parts of this unit.
Fault orientation and displacement data. Measurements acquired manually during fieldwork

No faults with visible offset or slip indicators are observed in the Unit 5 packstone. Deformation in this unit is dominated by regularly spaced, high-angle fractures that cross the entire vertical thickness (36–40 cm) of Unit 5. These high-angle fractures are exposed across Pavement 7, which is the bedding plane exposure of the U4–U5 interface (Fig. 2). The high-angle fractures in Unit 5 are strata-bound, and terminate at the U4–U5 boundary above and at the U5–U6 boundary below (Fig. 2b). Units 6 and 7, which are packstone and wackestone-dominated intervals, respectively, are both finely bedded, with centimetre-scale alternations between relatively competent and incompetent strata (Fig. 2b). A single, lower-angle mesoscale fracture is observed in Units 6 and 7, but otherwise no brittle failure surfaces are present in these intervals.
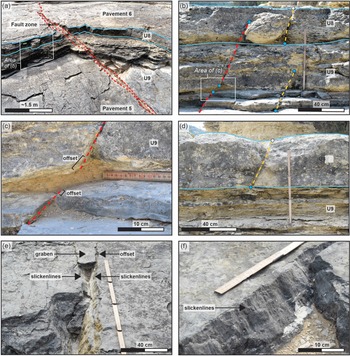
We document a single example of a normal fault zone that crosses multiple mechanical boundaries in Units 8 and 9 (Fig. 5a). This fault zone is represented by multiple fault strands with complex overlapping geometries, rather than by a single discrete fault surface (Fig. 5a). Brittle deformation structures are more common in the Unit 8 packstone and the wackestone-dominated Unit 9 compared to Units 6 and 7 above. High-angle fractures (Fig. 5b, d) and normal faults with up to 4 cm of displacement (Fig. 5b, c) are present in these units. High-angle fractures in Units 8 and 9 tend to be strata-bound, while observed normal faults cross unit interfaces (Fig. 5b). Two faults identified in Unit 9, with displacements of ∼1 cm and 4 cm, respectively, show evidence for terminations within an apparently weak, clay-rich interval (Fig. 5c). These faults are interpreted as being kinematically related, though they do not appear to be hard-linked across this 5 cm thick interval. This suggests that deformation in this interval in Figure 5c may have been accommodated by ductile strain rather than brittle deformation.
Field examples of faults and fractures in the study site. (a) Fault zone crossing multiple mechanical boundaries and lithologic units. (b) A fault with visible displacement and two sub-parallel, high-angle fractures with no detectable offset. (c) Enlarged view of (b) showing soft-linkage of two normal fault segments across a clay-rich wackestone interval. (d) Example of high-angle, strata-bound fracture that does not cross the upper or lower interface boundaries of Unit 8. (e) Conjugate normal faults (with visible offset and slickenlines along fault surfaces) and associated graben structure in Unit 10. (f) Fault with exposed slickenlines in Unit 10. See Figure 2a for field photograph locations. Key for fault and fracture colour scheme shown in Figure 4. Blue lines in parts (a), (b) and (d) denote lithologic unit boundaries.

The fault zone described above also extends below Units 8 and 9 into the underlying Unit 10 and Unit 11 packstones (Fig. 5a). Fault surfaces with displacements of less than 1 cm are relatively abundant in Units 10 and 11, and slickenlines on these faults show evidence for approximately dip-slip displacement (Fig. 5e, f). These small-scale faults trend approximately ENE–WSW (parallel to the Hidden Valley fault) but dip to both the NNW and SSE. In some cases, conjugate normal faults in Units 10 and 11 form small graben structures (Fig. 5e).
4.c. Digital fracture mapping
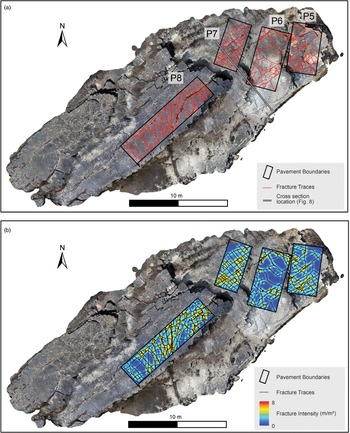
The initial phase of digital fracture mapping focused on bedding pavements P8, P7, P6 and P5 (Fig. 6), which represent the top bedding surfaces of Units 1, 5, 8 and 9–10, respectively (Fig. 2a). Digitally mapped fractures were visually compared to the published field-mapping-derived fracture maps of McGinnis et al. (Reference McGinnis, Ferrill, Smart, Morris, Higuera-Diaz and Prawica2015) for pavements 5–8 and our results were generally in agreement with no major discrepancies (compare Fig. 6a with fig. 1 in McGinnis et al. Reference McGinnis, Ferrill, Smart, Morris, Higuera-Diaz and Prawica2015). Combined fault and fracture intensity (total fracture length per unit area (m/m2)) was calculated for each of the digitally mapped pavements (Fig. 6b), and average values were found to be in general agreement with the results of McGinnis et al. (Reference McGinnis, Ferrill, Smart, Morris, Higuera-Diaz and Prawica2015). This initial step was undertaken to validate digital fracture maps generated by interpreting fractures on a georectified orthomosaic. These digitized fracture traces were not projected onto a 2D cross-section in subsequent analysis steps, as was carried out for fractures identified in vertical exposure surfaces.
(a) High-resolution orthomosaic with pavement outlines (black) with fault and fracture traces (red, undifferentiated) digitized from the high-resolution orthomosaic. See McGinnis et al. (Reference McGinnis, Ferrill, Smart, Morris, Higuera-Diaz and Prawica2015) for a comparison of field-mapping-derived fault and fracture traces. (b) Orthomosaic with outlines of pavements 5, 6, 7 and 8, fault and fracture traces (undifferentiated) and calculated areal fault and fracture intensities (fracture length per unit area). Fault and fracture intensities calculated using the Line Density tool in ArcMap 10.5.1 (ESRI) with an output cell size of 0.05 m and a search radius of 0.5 m. See Figure 1 for location.

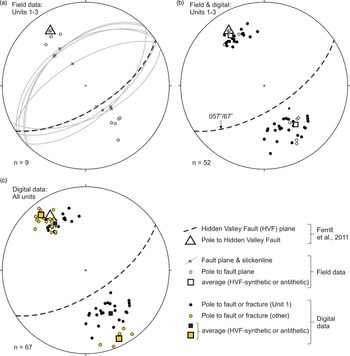
The second phase of digital fracture mapping focused on vertical bed exposures, and fault and fracture penetration across lithologic units (see Fig. 2b for faults and fractures mapped in 3D). Digital fault and fracture mapping focused on (i) faults identified in the field (Figs 2, 4) that were also visible on the photogrammetric reconstruction (Fig. 5), and (ii) faults and fractures identified in the photogrammetric reconstruction with trends approximately parallel to both the Hidden Valley fault and our field measurements of fault orientations. Orientations of digitally identified faults and fractures were measured on the photogrammetric point-cloud in CloudCompare, using the Compass 2.0 tool (Thiele et al. Reference Thiele, Grose, Samsu, Micklethwaite, Vollgger and Cruden2017). Field and digital orientation measurements show relatively close agreement for lower-angle fractures and faults in Units 1 and 3 (Fig. 7a, b). Average strike and dip values for field and digital data are 056°/61° (field data) and 057°/57° (digital data) for faults and fractures synthetic to the Hidden Valley fault, and 240°/49° (field data) and 231°/50° (digital data) for antithetic faults and fractures. Average strike and dip measurements for synthetic faults and fractures show close agreement with the orientation of the Hidden Valley fault (strike/dip of 057°/67°; Ferrill et al. Reference Ferrill, Morris, McGinnis, Smart and Ward2011). Both field and digital orientations of synthetic faults and fractures exhibit lower variability in measured orientations, with angular standard deviations of 6.7° for field data and 6.1° to 14.7° for digital data. Measured orientations of faults and fractures antithetic to the Hidden Valley fault exhibit higher variability than synthetic faults, with angular standard deviations of 8.7° for field data and 10.5° to 14.7° for digital data. High-angle fractures antithetic to the Hidden Valley fault show the greatest variability of sample populations (Fig. 7c), with an angular standard deviation of 14.7°, but the average strike of these high-angle fractures (ENE 060°–WSW 240°) is approximately parallel to the Hidden Valley fault. Fault and fracture orientations, calculated measurement averages and angular standard deviations for data subsets are provided in online Supplementary Material Table S1.
Orientation data for faults and fractures with trends parallel or sub-parallel to the Hidden Valley Fault, which is shown by thick dashed lines (fault plane) and square symbols (pole to fault plane). (a) Great circles, poles and slickenline orientations for faults observed and measured in the field. (b) Poles to field-measured faults and digitally mapped faults and lower-angle (<70°) fractures striking parallel or sub-parallel to the Hidden Valley Fault. (c) Poles to faults, high-angle fractures and lower-angle fractures identified and mapped on the digital outcrop, with orientations extracted from the photogrammetric point-cloud. All projections on equal-area lower hemisphere stereonets.

4.d. Cross-section interpretations
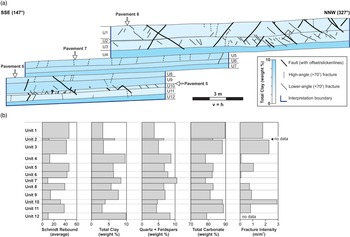
To quantify vertical variations in fracture abundance, fracture containment and vertical persistence of fractures across lithologic boundaries, digitally mapped faults and fractures with trends approximately parallel to the Hidden Valley fault (Fig. 7c) were projected onto a 147°–327° oriented vertical cross-section (Fig. 8a). Bed boundaries interpreted in 3D, as well as an interpretation boundary defined during fieldwork, were also projected onto the cross-section, allowing us to quantify 2D cross-section areas of each exposed lithologic unit at the study site. Projected fault and fracture polylines in cross-section view highlight the overall tendency for more high-angle fractures (dashed lines in Fig. 8a) to terminate at bed interfaces. Lower-angle fractures (thin solid lines) and faults (thick solid lines) are more likely to cross bed boundaries and multiple lithologic units. Lower-angle fractures appear to be more abundant where identified faults are present, and with the exception of fractures in Unit 5, both faults and fractures through the exposed section exhibit a wide range of apparent spacings. Fracture patterns exhibit variability throughout the cross-section, and in general, faults and fractures are largely strata-bound or confined to units of similar composition (Fig. 8a).
(a) SSE–NNW cross-section showing projected polyline interpretations of bedding horizons, faults and fractures. Lithologic units coloured according to clay content (see key) and faults and fractures coloured according to classification scheme; see main text for details. (b) Mean Schmidt rebound, weight per cent total clay, weight per cent quartz and feldspar, weight per cent total carbonate and calculated fracture intensities for each lithologic unit.

4.d.1. Units 1–3
Fault and fracture patterns are relatively consistent through Units 1–3 (Fig. 8a), with brittle failure surfaces dominantly represented by conjugate normal faults and lower-angle fractures. The Unit 2 wackestone, which has a measured thickness of 0–5 cm and a relatively high weight percentage of clay (6.6 %), marks the intermediate boundary between Units 1 and 3. Although several fractures abut against Unit 2 (Fig. 4b), this thin interval did not consistently arrest faults and lower-angle fractures (Fig. 8a), despite relatively high clay content. We interpret that Units 1 and 3 generally acted as a single mechanical stratigraphic unit with respect to fracture initiation and propagation.
4.d.2. Unit 4
Although no observed faults or fractures cross the entire wackestone interval of Unit 4, several faults and lower-angle fractures in Units 1–3 do not terminate at the U3–U4 boundary but appear to have propagated as much as 15 cm downwards into the upper part of the Unit 4 wackestone (Figs 4d, 8a, 6d). The Unit 4 wackestone is represented by relatively high clay content (9.6 %) and low average rebound (12.9) values (Table 1).
4.d.3. Unit 5
Deformation features in Unit 5 packstone (immediately below Unit 4) are dominated by high-angle fractures (Fig. 8a). With the exception of one observed failure surface, these fractures are generally bed-contained and do not show evidence for upward propagation into the lower part of Unit 4. In addition, the high-angle fractures in Unit 5 are relatively evenly spaced, in contrast to all other beds in the exposure where fractures are not regularly spaced.
4.d.4. Unit 6
With the exception of a single high-angle fracture that crosses Units 5 and 6 (Fig. 8a), packstone-dominated Unit 6 is nearly devoid of faults and fractures. Unlike Units 1 and 3, which appear to be relatively homogeneous packstones, Unit 6 is characterized by centimetre-scale alternations between thin wackestone and packstone beds.
4.d.5. Unit 7
No faults or fractures are observed in Unit 7. This interval is somewhat analogous to Unit 4 in that it is a wackestone interval with low measured rebound, relatively high clay content and few or no faults and fractures.
4.d.6. Units 8–11
Fault and fracture terminations through Units 8–11 are apparently less systematic than in the intervals above (Fig. 8a), with structures through this interval showing little evidence for containment at a specific horizon or stratigraphic level. All of the mapped bed boundaries in the Unit 8 to Unit 12 section are crossed by both faults and fractures. Higher fault and fracture connectivity across these layers is observed in the cross-section (Fig. 8a) despite variations in both composition and measured rebound (Fig. 8b). Strata-bound faults and fractures are contained within these intervals (e.g. several lower-angle fractures in Unit 10), but the general pattern is one of greater variability in patterns of fracture containment.
4.d.7. Clay content versus fracture patterns in cross-section
Measured weight per cent of clay for each of the 12 lithologic units (Table 1) was used for shading lithology polygons in the cross-section, allowing for a visual appraisal of clay content versus fault and fracture characteristics through the exposed section (Fig. 8a). Based on clay content variations through the exposed section (Table 1), there appears to be a link between the abundance of clay in each lithologic unit and fault and fracture occurrence (Fig. 8a). Units 1, 3, 10 and 11 have the lowest clay percentages (<4 %) of the lithologic units (Figs 8b, 9), and relatively high numbers of faults and fractures are present in these units.
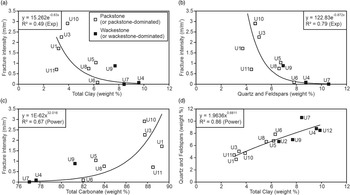
(a–c) Cross-plots of calculated fracture intensity (from cross-section) versus unit composition data. (d) Summed quartz and feldspar content versus weight per cent total clay for all units. Unit numbers (see Fig. 2) shown on each cross-plot.

4.e. Calculated fracture intensity versus measured rock properties
Fracture intensity (m/m2) for Units 1–12 was calculated by dividing the total length of combined fault and fracture traces within a given unit in cross-section by the area of that unit within the interpretation boundary (see Fig. 8a for interpretation boundary). This calculation provides an average fracture intensity for each unit (Table 1; Fig. 8b) and allows average fracture intensity to be compared to composition, Schmidt rebound and thickness of each lithologic unit.
We find an inverse relationship between fracture intensity and total clay content (weight %), with a moderate correlation coefficient for this relationship of 0.49 (Fig. 9a). Combined quartz and total feldspars (potassium and plagioclase) content also correlates with fracture intensity (R 2 = 0.79), with data showing increased fracture intensities with lower weight percentages of these detrital components (Fig. 9b). Carbonate content in this case approximately represents the balance of mineral content (along with total clay, quartz and feldspars), and yields a relatively strong correlation (R 2 = 0.67) and a trend representing increased fracture intensity with increased carbonate mineral content (Fig. 9c). Total carbonate within this sample suite represents the summed weight percentage of calcite, dolomite and siderite for each sample. Except for Unit 9 (which contains 2.4 % dolomite), all samples contain less than 0.6 % combined dolomite and siderite, with the remaining total carbonate in each sample made up of calcite (online Supplementary Material Table S2). Total clay content in samples correlates well (R 2 = 0.86) with summed quartz and feldspars (Fig. 9d), which may be indicative of either authigenic (feldspar-derived) or detrital clay content.
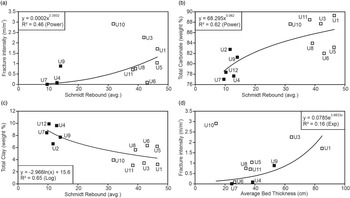
Combined fault and fracture intensity correlates moderately with average Schmidt rebound values (R 2 = 0.46; Fig. 10a). Average Schmidt rebound shows a moderate positive correlation with total carbonate (R 2 = 0.62; Fig. 10b) and a moderate negative correlation with total clay (R 2 = 0.65; Fig. 10c). Finally, of all assessed variables, average bed thickness exhibits the weakest apparent relationship to fracture intensity, with a correlation coefficient of 0.16 (Fig. 10d).
(a) Fault and fracture intensity versus Schmidt rebound. (b) Total carbonate versus Schmidt rebound. (c) Total clay versus Schmidt rebound. (d) Fault and fracture intensity versus average bed thickness. See Figure 9 for symbol key.

5. Discussion
5.a. Fault and fracture categorization
Extensional faults identified in the study area are either synthetic (SE-dipping) or antithetic (NW-dipping) to the Hidden Valley fault (Fig. 7a). Conjugate (synthetic and antithetic) normal faults are relatively common in the footwall to the Hidden Valley fault at Canyon Lake Gorge (Ferrill & Morris, Reference Ferrill and Morris2008; Ferrill et al. Reference Ferrill, Morris and McGinnis2009), and these have been interpreted as early formed structures related to monocline development (e.g. Ferrill et al. Reference Ferrill, Morris and McGinnis2009, Reference Ferrill, Morris, McGinnis, Smart and Ward2011). We therefore interpret the faults identified in the study area as consistent with early formed, monocline-related faults that formed in a normal-faulting regime at Canyon Lake Gorge, as documented by Ferrill et al. (Reference Ferrill, Morris, McGinnis, Smart and Ward2011). Lower-angle fractures identified in digital data with trends sub-parallel to the Hidden Valley fault are generally oriented sub-parallel to synthetic and antithetic extensional faults identified in the field (Fig. 7a, b). The similarity between orientations of lower-angle fractures and conjugate normal faults suggests that these structures may be genetically related, and therefore that both the observed faults and lower-angle fractures formed as a result of shear failure even though clear evidence for slip is not present on the lower-angle fractures. Shear behaviour for the lower-angle fractures is compatible with the normal-faulting stress regime (i.e. vertical maximum principal stress), and NNW–SSE-oriented minimum principal stress direction that has been interpreted for the Hidden Valley fault system and Balcones fault system (e.g. Ferrill et al. Reference Ferrill, Sims, Waiting, Morris, Franklin and Schultz2004, Reference Ferrill, Morris, McGinnis, Smart and Ward2011, Reference Ferrill, McGinnis, Morris and Smart2012 a, Reference Ferrill, Evans, McGinnis, Morris, Smart, Lehrmann, Gulliver and Sickmann2020 a; Ferrill & Morris, Reference Ferrill and Morris2008; Morris et al. Reference Morris, Ferrill and McGinnis2016).
While it is theoretically possible that the observed lower-angle fractures formed through tensile failure, this interpretation would require a c. 90° rotation in minimum principal stress direction to produce the oppositely dipping lower-angle fractures (Fig. 8a). Specifically, if both NNW- and SSE-dipping lower-angle fractures formed by tensile failure perpendicular to the minimum principal stress direction, the minimum principal stress would have been inclined 40–50° from horizontal – plunging SSE during formation of NNW-dipping fractures, and plunging NNW during formation of SSE-dipping fractures – a scenario that we envision as unlikely. Our preferred interpretation, therefore, is that lower-angle fractures observed at the site are incipient shear failure surfaces that did not accumulate sufficient slip to offset bedding planes by a detectable amount, or to form observable slickenlines. We acknowledge that the lack of mineralization and associated mineral textures on lower-angle fracture surfaces rules out definitive categorization of failure mode for these structures. The consistency of their orientations with both observed normal faults at the site and the Hidden Valley fault, however, provides a reasonable basis for interpreting these structures as incipient shear fractures.
We interpret high-angle fractures with trends sub-parallel to the Hidden Valley fault (Fig. 7c) as having formed as a result of tensile failure in a normal-faulting stress regime. This interpretation requires a maximum principal stress orientation close to vertical and a subhorizontal NNW–SSE-oriented minimum principal stress direction. This is consistent with (i) the orientation of the Hidden Valley fault (Ferrill & Morris, Reference Ferrill and Morris2008; Ferrill et al. Reference Ferrill, Morris, McGinnis, Smart and Ward2011), (ii) normal fault orientations in the study area (Fig. 7a), and (iii) our interpretation of lower-angle fractures at the site as incipient shear fractures. There also appears to be a general pattern in cross-section view (Fig. 8a) for high-angle fractures to consistently terminate at bed boundaries, whereas both normal faults and low-angle fractures more commonly cross mechanical boundaries. This general pattern may further support our interpretation of lower-angle fractures as incipient shear fractures and high-angle fractures as tensile failure surfaces, given that opening-mode fractures are more likely than shear fractures to terminate at weak mechanical boundaries as well as at pre-existing faults and unfilled fractures (c.f. Cooke et al. Reference Cooke, Simo, Underwood and Rijken2006; Ferrill et al. Reference Ferrill, McGinnis, Morris, Smart, Sickmann, Bentz, Lehrmann and Evans2014). Previous work has shown that the fracture network in the Hidden Valley fault zone at Canyon Lake Gorge is in many cases dominated by shear fractures (small faults; Ferrill et al. Reference Ferrill, Morris, McGinnis, Smart and Ward2011; McGinnis et al. Reference McGinnis, Ferrill, Smart, Morris, Higuera-Diaz and Prawica2015). McGinnis et al. (Reference McGinnis, Ferrill, Smart, Morris, Higuera-Diaz and Prawica2015) interpreted that major fracture system development initiated near maximum burial at relatively high differential stress where shear failure dominated over tensile failure, and that subsequent tensile failure likely occurred under lower differential stress conditions and filled in between shear fractures.
5.b. Unit composition versus fracture intensity
The composition of lithologic units appears to be a dominant control on fracture occurrence at the study area. Moderate to high fault and fracture intensities occur where total clay is relatively low and carbonate mineral percentages are relatively high (Fig. 9a–c). Note the strong correlation between total clays and quartz–feldspar components (Fig. 9d), which we attribute to either input of detrital clay, quartz and feldspars in a carbonate depositional setting, or authigenic transformation of silicate minerals (feldspars) to clay during progressive burial diagenesis. The genetic relationship between quartz, feldspars and total clays is beyond the scope of this study but we note that quartz and feldspar weight percentages are inversely correlated with rock strength in the carbonate succession here, while a positive correlation between quartz content and rock strength is generally expected in clastic sedimentary and crystalline rocks (e.g. Chang et al. Reference Chang, Zoback and Khaksar2006 and references therein).
Correlations from our data indicate (i) a general increase in fracture intensity with increasing rebound (Fig. 10a), (ii) an increase in measured rebound with increasing carbonate content (Fig. 10b), and (iii) a decrease in average rebound with increasing clay content (Fig. 10c). The general relationships of increasing fracture intensity with increasing rebound, decreasing clay content and increasing carbonate content suggest that faults and fractures are more likely to occur in cleaner (i.e. clay-poor, carbonate-rich), more competent units. This observation is consistent with previous outcrop studies and experimental work (e.g. Donath, Reference Donath1970; Wu & Pollard, Reference Wu, Pollard and Roegiers1991; Hovorka, Reference Hovorka1998; Laubach et al. Reference Laubach, Olson and Gross2009; Roche et al. Reference Roche, Homberg and Rocher2012; Roche & van der Baan, Reference Roche and van der Baan2013; Ferrill et al. Reference Ferrill, McGinnis, Morris, Smart, Sickmann, Bentz, Lehrmann and Evans2014, Reference Ferrill, Morris, McGinnis, Smart, Wigginton and Hill2017 b; Cawood & Bond, Reference Cawood and Bond2018), which document that more competent lithologies accommodate lower amounts of strain before the onset of brittle failure (i.e. have lower ductility; Donath, Reference Donath1970). Our measured rebound versus clay content, rebound versus fault and fracture intensity, and clay content versus fault and facture intensity results suggest that more clay-rich wackestone intervals in the study area likely accommodated extensional strain associated with regional Gulf of Mexico extension (Ferrill et al. Reference Ferrill, Morris, McGinnis, Smart, Childs, Holdsworth, Jackson, Manzocchi, Walsh and Yielding2017 a) through ductile deformation. Previous work from Canyon Lake Gorge, and elsewhere in the region (e.g. Ferrill et al. Reference Ferrill, Morris and McGinnis2012 b), shows that clay-rich layers are more likely to experience thickness changes due to ductile deformation. In contrast, more competent packstone units experienced brittle deformation by shear or hybrid failure in faults and fractures synthetic and antithetic to the Hidden Valley fault, and by tensile failure for opening-mode, high-angle fractures.
We acknowledge the presence of small-scale (<5 cm) faults and fractures in finely bedded intervals (e.g. Units 6 and 9; Fig. 2) that were not practicable to identify and map comprehensively. These small-scale structures, where observed, are contained in thin (<5 cm) weathering-resistant intervals and were not mapped unless they persist across interbeds (e.g. Fig. 4d). As these <5 cm structures do not connect vertically across interbeds, we interpret their potential effect on large-scale permeability architecture as negligible.
5.c. Unit interfaces
Abrupt changes in unit composition, fault and fracture intensity, and brittle failure mode through the succession provide evidence for the influence of lithology on deformation style. Unit interfaces, however, appear to play less of a role in our study area than has been documented in other outcrop studies (e.g. Gillespie et al. Reference Gillespie, Johnston, Loriga, McCaffrey, Walsh, Watterson, McCaffrey, Lonergan and Wilkinson1999; Hooker et al. Reference Hooker, Laubach and Marrett2013; McGinnis et al. Reference McGinnis, Ferrill, Morris, Smart and Lehrmann2017) and in results from numerical modelling (e.g. Cooke & Underwood, Reference Cooke and Underwood2001; Chang et al. Reference Chang, Shan, Zhang, Tang and Ru2015). These studies show that the shear strength of layer boundaries is an important factor, and that bed-perpendicular opening-mode fractures tend to terminate at weak interfaces whereas fractures can grow across strong interfaces. This may explain the systematic terminations of high-angle fractures at the upper and lower boundaries of Unit 5 and, to a lesser degree, at the upper and lower boundaries of Unit 8 (Fig. 8a).
It should be noted that each of the four boundaries referred to above represent a transition from more highly fractured, more competent layers to less competent layers with low fracture intensity (Fig. 8b). Differentiating between interface strength versus unit strength as a control on containment of opening-mode fractures is therefore not tractable in these cases. For the most part, normal faults and lower-angle fractures cross multiple units entirely with no apparent change in fracture orientation (e.g. at U1–U2–U3 transition; Fig. 8a) and only rarely terminate directly at unit interfaces (Fig. 8b). At interfaces between units of contrasting clay content and rebound values (e.g. U3–U4 and U9–U10 boundaries; Fig. 8a) shear fractures typically cross interfaces and terminate within less competent units. It should be noted that interfaces with low shear strength do not inhibit the growth of shear fractures or faults as has been interpreted to occur in the case of opening-mode fractures (Cooke et al. Reference Cooke, Simo, Underwood and Rijken2006; Ferrill et al. Reference Ferrill, McGinnis, Morris, Smart, Sickmann, Bentz, Lehrmann and Evans2014).
5.d. Unit thickness versus fracture intensity
As documented by McGinnis et al. (Reference McGinnis, Ferrill, Smart, Morris, Higuera-Diaz and Prawica2015), there is little correlation between bed thickness and fracture intensity in the study area. We find that bed thickness versus fracture intensity is poorly correlated (R 2 = 0.16) compared with the other explored variables, and surprisingly our data suggest, if anything, that increased bed thickness correlates with higher fracture intensity (Fig. 10d). This result is unexpected (in spite of the poor correlation and U10 outlier; Fig. 10d) as many examples in the existing literature have documented an inverse relationship between bed thickness and fracture abundance, with thinner beds exhibiting higher fracture intensities, increased fracture frequencies or lower fracture spacings (e.g. Harris et al. Reference Harris, Taylor and Walper1960; Price, Reference Price1966; McQuillan, Reference McQuillan1973; Ladeira & Price, Reference Ladeira and Price1981; Corbett et al. Reference Corbett, Friedman and Spang1987; Huang & Angelier, Reference Huang and Angelier1989; Narr & Suppe, Reference Narr and Suppe1991; Bai & Pollard, Reference Bai and Pollard2000; Nelson, Reference Nelson2001; Yin, Reference Yin2010; McGinnis et al. Reference McGinnis, Ferrill, Morris, Smart and Lehrmann2017). Most studies, however, focus on (i) more competent beds, where fractures are typically better developed (see McGinnis et al. Reference McGinnis, Ferrill, Smart, Morris, Higuera-Diaz and Prawica2015 and references therein), and (ii) fracture abundance versus unit thickness relationships in beds or units that are compositionally similar (e.g. Narr & Suppe, Reference Narr and Suppe1991). The role of composition, particularly in less competent, clay-rich rocks is, therefore, commonly overlooked in the generally accepted paradigm of bed thickness to fracture abundance (spacing, frequency, intensity) ratios.
As noted by Olson (Reference Olson, Engelder and Cosgrove2004), unit thickness is only one of several parameters that may govern fracture spacing in sedimentary rocks, with others including those listed above. Our lithologic units exhibit a relatively wide range of compositions and rebound values, and we show that composition exerts a dominant control on mechanical rebound, style of deformation, fracture intensity and fracture containment through this sequence of mechanically layered carbonates. Given the dominance of composition in defining deformation mode and fracture containment, it is perhaps not surprising that we do not find a robust relationship between bed thickness and fracture intensity. Despite these observations, we find that unit thicknesses do play a role in fracture containment and propagation. Shear failure surfaces appear to have propagated across relatively thin clay-rich layers (e.g. Unit 2) but not across clay-rich, weak layers with thicknesses greater than 5–10 cm (e.g. Unit 4). The ability for a shear failure surface to propagate across weak layers in multilayer successions likely depends on (i) fault displacement magnitude, (ii) ductility contrasts through deformed successions, and (iii) relative thicknesses of competent and incompetent layers. Future work quantifying relationships between these factors will likely elucidate fault growth processes, patterns of fault displacement and the potential ability for brittle failure surfaces to connect rock volumes across strata.
6. Conclusions
We present a detailed field-based and digital analysis of fracture characteristics (orientation, failure mode, vertical persistence, intensity) and lithologic properties (texture, composition, rebound, bed thickness) in a Cretaceous carbonate packstone and wackestone succession at Canyon Lake Gorge, Texas. We find that mechanical stratigraphy plays an important role in fault and fracture propagation and containment.
-
(1) Unit composition, specifically clay minerals versus carbonate content, controls deformation style, fracture intensity and fracture containment. Relatively clay-rich wackestone lithologies exhibit low fracture intensities, and both opening-mode fractures and faults within competent packstone units systematically terminate at competent–incompetent unit interfaces, or within relatively weak, clay-rich units.
-
(2) Our data show poor correlations between layer thickness and fracture intensity. We attribute this to the relatively wide range of compositions in lithologic units and the dominant role of lithology and composition in defining fracture occurrence and containment at the site.
-
(3) While no clear relationships between layer thickness and fracture abundance are recorded at the site, we find that thicknesses of relatively incompetent, clay-rich layers control the likelihood for faults and fractures to propagate across layer boundaries. This result is important for potential vertical connectivity of faults and fractures in mechanically layered carbonates containing variable proportions of relatively strong and weak layers.
Supplementary material
To view supplementary material for this article, please visit https://doi.org/10.1017/S0016756822000334
Acknowledgements
Primary financial support for this work was provided by Southwest Research Institute Internal Research and Development project 15-R6107. Photomicrographs were provided by the Southwest Research Institute joint industry Carbonate Fault Project, which was sponsored by Chevron, ConocoPhillips, ExxonMobil and Shell. We thank the U.S. Army Corps of Engineers and the Guadalupe-Blanco River Authority for allowing us access to the Canyon Lake Spillway Gorge. In particular we appreciate the assistance of Jaynellen Kerr of the Guadalupe-Blanco River Authority. Thanks to Ryan King at Ellington Geological Services for carrying out compositional analysis of collected samples. We thank John Hooker and Julia Gale for their constructive reviews and comments, and editor Olivier Lacombe for handling of the manuscript.
Conflict of interest
The authors declare that they have no known competing financial interests or personal relationships that could have appeared to influence the work reported in this paper.