Introduction
Grain boundary (GB) microstructure has long been known to play a crucial role in many material properties, such as intergranular cracking[Reference Bechtle, Kumar, Somerday, Launey and Ritchie1, Reference Tokita, Kokawa, Sato and Fujii2] and corrosion resistance,[Reference Kumar, Prasad, Kain and Reddy3–Reference Hu, Xia, Li, Liu, Zhou, Chen and Wang5] and the field of “GB design and control” is centered on improving properties by optimizing grain boundaries microstructure. Subsequently, the concept of GB engineering (GBE) was proposed[Reference Watanabe6]; this method has been adopted by more and more researchers to develop high-performance polycrystalline materials. To date, GBE has been widely used to promote intergranular corrosion and intergranular stress corrosion resistance through introducing a high fraction of Σ3n CSL boundaries in polycrystalline materials.[Reference Chen, Hu, Wang, Zhu, Wang, Yang, Wang, Gu and Lu7, Reference Deepak, Mandal, Athreya, Kim, de Boer and Subramanya Sarma8]
Although GBE approaches have been extensively employed to alleviate the intergranular corrosion of various low-to-medium stacking fault energy materials in aqueous corrosion medium,[Reference Michiuchi, Kokawa, Wang, Sato and Sakai9, Reference Drach, Tsukrov, DeCew, Aufrecht, Grohbauer and Hofmann10] the report on the corrosion resistance of copper–nickel alloys using GBE is still relatively lacking, especially for BFe10-1-1 copper–nickel alloy which is used as a seawater infusion pipe for marine equipment because of its excellent mechanical properties and corrosion resistance.[Reference Ma, Jiang, Zheng and Ke11] However, intergranular corrosion is one of the main failure modes for BFe10-1-1 copper–nickel alloy exposed to aggressive marine environment.[Reference Burleigh and Waldeck4, Reference Ekerenam, Ma, Zheng and Emori12] Thus, GBE process was carried to improve the intergranular corrosion resistance in this work.
More recently, Randle and Gottstein[Reference Randle13, Reference Gottstein and Shvindlerman14] furtherly confirmed the effectiveness of GB plane and GB triple junction distribution for control and improve bulk properties respectively from the viewpoint of geometric configuration and connectivity of grain boundaries. Since high-energy (degradation-susceptive) random boundaries play a key role in the percolation of intergranular corrosion and fracture paths, so precisely controlling of GB microstructure can be used for the development of high-performance materials. Moreover, theoretical predictions of intergranular failure of materials can be achieved by evaluating the connectivity of high-energy random boundaries. Kobayashi et al.[Reference Kobayashi, Maruyama, Tsurekawa and Watanabe15, Reference Kobayashi, Kobayashi and Watanabe16] have proposed a method based on the maximum random boundary connectivity (MRBC) fractal analysis to quantitatively describe the GB microstructures for predicting GB-related properties. Compared with current GBE, which can achieve more precise GBE due to it takes some intrinsic consideration into the influence of GB plane. However, although a great deal of data has been generated to quantify specific MRBC, there is still a lack of understanding of the true relevance and limitations of fractal concepts with well-characterized GB microstructures.
Hence, in order to understand the correlation between GB microstructure and intergranular corrosion property for accurately predicting and controlling corrosion resistance in BFe10-1-1 copper–nickel alloy. First, the fractal dimension (D R) of MRBC need to be computed, and then theoretical prediction of intergranular corrosion resistance is carried out by fitting and extrapolation with D R. Finally, the theoretical prediction is experimentally validated by electrochemical impedance spectroscopy (EIS) measurements and static immersing corrosion test.
Experimental procedure
Specimen preparation
The chemical composition (wt.%) of BFe10-1-1 copper–nickel alloy used in this study was 9.83 Ni, 1.24 Fe, 0.7 Mn, 0.0054 P, 0.0047 S, 0.0054 Sn, 0.0034 Pb, 0.0005 C, and the balance Cu. First, hot-rolled BFe10-1-1 copper–nickel sheets were cold-rolled to an 80% reduction ratio, and then annealed at 1073 K for 300 s; the annealed sample was called the starting base material (BM) in the present study. The BM specimens were further cold-rolled by 5%, 9%, 14%, and 25% reduction ratios, respectively, and then subsequently annealed in the air at 1073 K for 600 s to obtain different GB microstructures. Above for types of GBE treatment specimens respectively marked as Type A, Type B, Type C and Type D. After mechanical polish, these specimens were electrolytically polished in an electrolytic solution of 25 mL HPO3 + 25 mL C2H5OH + 50 mL H2O at a voltage of 26 V at 298 K for 90 s.
GB microstructure characterization
The GB microstructure was characterized by recourse to the field emission gun FEG-SEM equipped with an EBSD probe. In this study, CSL boundaries with 1 ≤ Σ ≤ 29 (namely low-Σ boundaries) were defined as special beneficial boundaries.[Reference Brandon17] These highly ordered special boundaries participate in the reconfiguration of the existing boundaries network that eventually breaks down the random high-angle grain boundaries connectivity, leading to high resistance to GB degradation.[Reference Kobayashi, Maruyama, Tsurekawa and Watanabe15, Reference Kobayashi, Kobayashi and Watanabe16, Reference Watanabe18] Moreover, according to the number of special grain boundaries at triple junctions, the triple junctions were classified into follow four types[Reference Fortier, Miller and Aust19]: (1) R 0 type (no special boundaries, denoted as 0-special); (2) R 1 type (1-special); (3) R 2 type (2-special); (4) R 3 type (3-special). The MRBC was the independent maximum random boundaries network made up of high-energy random boundaries, which can also be considered as a maximum random GB network composed of R 0 and R 1 type triple junctions.
Quantitative analysis of random boundary connectivity
Fractal analyses have been widely used to build the relationship between microstructures and mechanical properties to predict and control the mechanical properties in engineering materials,[Reference Kobayashi, Maruyama, Tsurekawa and Watanabe15, Reference Mandelbrot, Passoja and Paullay20, Reference Kobayashi, Tsurekawa and Watanabe21] while detailed study on GB microstructure based on fractal analysis for copper and copper alloy has thus far not been reported. Here, the fractal dimension of MRBC was quantitatively calculated by box-counting method. As a quantitative indicator of the roughness of a GB profile, the value of fractal dimension is related to corrosion resistance.[Reference Dubuc, Quiniou, Roques-Carmes, Tricot and Zucker22, Reference Charkaluk, Bigerelle and Iost23]
The fractal dimension of MRBC defined by box-counting method, this process is described in detail elsewhere.[Reference Kobayashi, Maruyama, Tsurekawa and Watanabe15, Reference Kobayashi, Kobayashi and Watanabe16] When the square box is set to η, the number of shaded square boxes required to completely cover the MRBC is N (η). For different sizes of η, the profile of MRBC considered has self-similarity when the relationship between N (η) and η is described as,
 $$N(\eta )\propto \eta ^{-D_R}$$
Thus, the fractal dimension D R of MRBC can be calculated by the slope of the linear function between log N(η) and log η as follows,
 $$D_R = -\displaystyle{{\log N(\eta )} \over {\log \eta}} $$
Experimental corrosion tests
The intergranular corrosion resistance was evaluated using EIS measurements and static immersing corrosion test. The specimens with 10 mm length and 10 mm wide along thick direction were cut from the GB engineered sheets. Then EIS was conducted under 5 mV amplitude of sinusoidal potential signals with respect to the open-circuit potential in the frequency range from 100 kHz to 0.01 Hz in 3.5% (wt.%) NaCl solution after immersing for 240 h. The static immersing corrosion test was carried out in acidic (pH = 3) 3.5% (wt.%) NaCl solution for 240 h at 298 K. The surface after immersing corrosion was observed by SEM micrographs.
Results
GB microstructure analysis
The relationship between the fraction of low-Σ boundaries F Σ, the coefficient of variation of grain size distribution  $\sigma /\overline d $, and the average grain size
 $\overline d $ for the four types of specimen is shown in Supplementary material. Compared with consider twin boundary (TB), the average grain size was more widely changed from 28 to 61 µm when disregard twin. Although the data points were scattered, the value of F Σ increases as average grain size increases; and the value of F Σ achieved highest (about 80%), especially the highest fraction of coherent twin boundaries is 59.5% when average grain size is biggest, regardless of grain size distribution included TB or not. The variation of F Σ with grain size in BFe10-1-1 copper–nickel alloy is the same as that of austenitic stainless steel,[Reference Bober, Lind, Mulay, Rupert and Kumar24] which attributed to the formation of annealing twins during grain growth in the materials.
Moreover, the propagation path of intergranular corrosion can be strongly affected by grain size distribution. The value of  $\sigma /\overline d $ was used to evaluate the heterogeneity of grain size distribution. The lower the value of
 $\sigma /\overline d $, the grains are more homogeneous. From Fig. S1 (shown in Supplementary material), the value of
 $\sigma /\overline d $ and the average grain size
 $\overline d $ possess a linear function. The heterogeneity of grain size distribution monotonously increases with increase in average grain size. It demonstrates that the effect of grain growth process on grain size distribution was obvious.
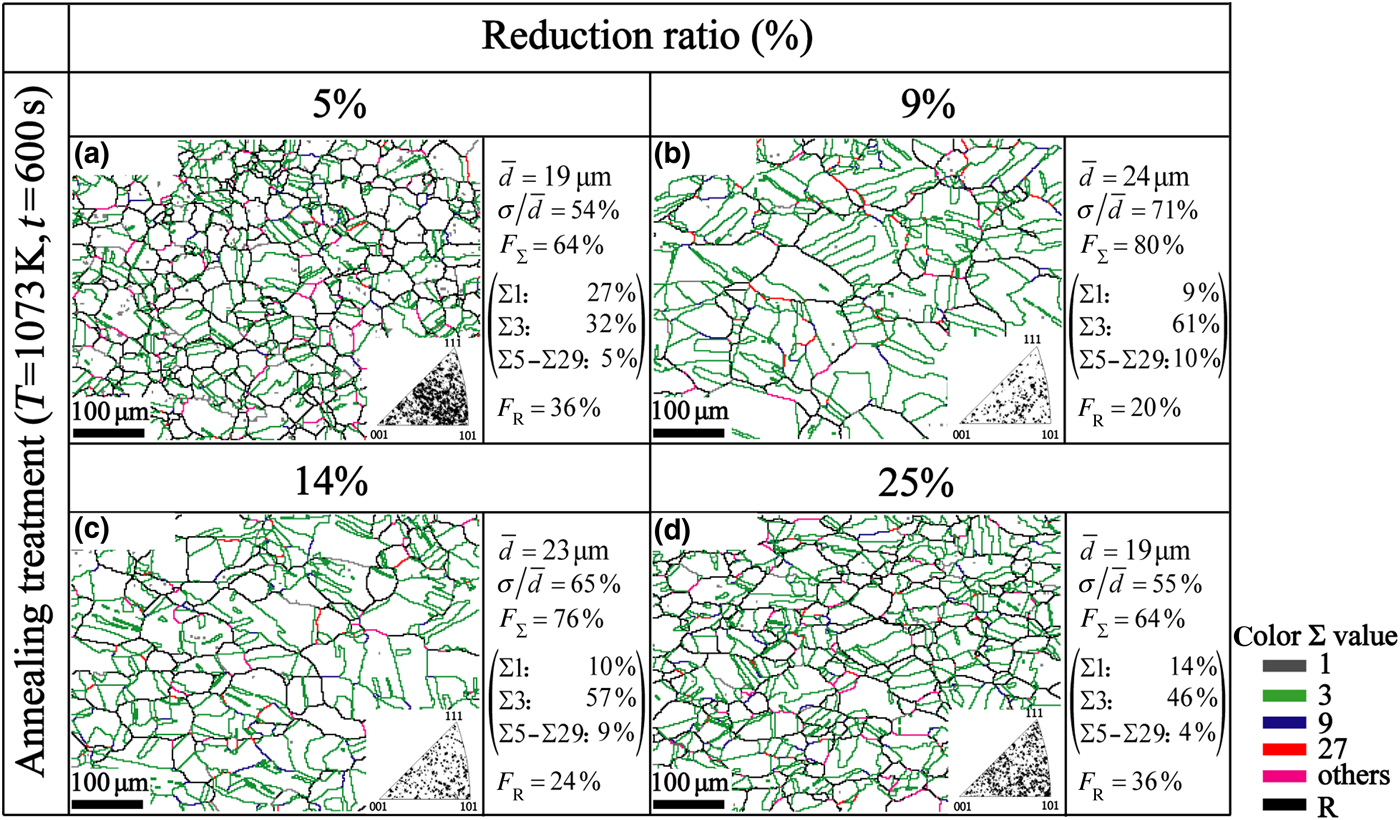
Figure 1 shows the GB characterization distribution (GBCD) and the orientation distribution of grains for the four types of specimen, and the types of grain boundaries were identified by different colored lines in the micrographs. From the inverse pole figures, grain orientation of these specimen surfaces was almost randomly distributed. The average grain size of the specimen varied between 19 and 24 µm (regard twins). With the increase of cold reduction before annealing, the average grain size tends to increase first and then decreases, the value of  $\sigma /\overline d $ changes from 54% to 71% together. For polycrystalline materials, the growth of grain reduces the fraction of high-energy random boundaries (GBs), where the grain becomes coarse due to the gradual growth of larger grains.[Reference Bober, Lind, Mulay, Rupert and Kumar24] In addition, the fraction of Σ3 coherent boundaries with lower stacking fault energy of these four specimens is 31.1%, 59.5%, 55.8%, and 45.1%, respectively. The proportion of coherent twin boundaries reflects the degree of GB structure optimization, owing to their lower stacking fault energy. During optimization of GBCD, it was observed that the random boundary network was frequently interrupted by low-Σ CSL boundaries. Since intergranular failure tends to propagate along the random GB network, uniform distribution of highly ordered special boundaries in the GB network can effectively arrest the intergranular deterioration from expanding and thus improve the material performance.[Reference Kobayashi, Kobayashi and Watanabe16]
Grain boundary microstructures for different types of BFe10-1-1 specimens subjected to GBE treatment. (a) Type A; (b) Type B; (c) Type C; (d) Type D.

Fractal analysis of MRBC and corrosion resistance prediction in BFe10-1-1 specimens
To more accurately reveal the effect of GB microstructures on corrosion percolation path, building the relationship between GB microstructures and corrosion resistance in BFe10-1-1 copper–nickel alloy, the fractal analysis of the connectivity of maximum random boundaries network was performed by taking account of the differences of GBCD for the specimens tested in this investigation.
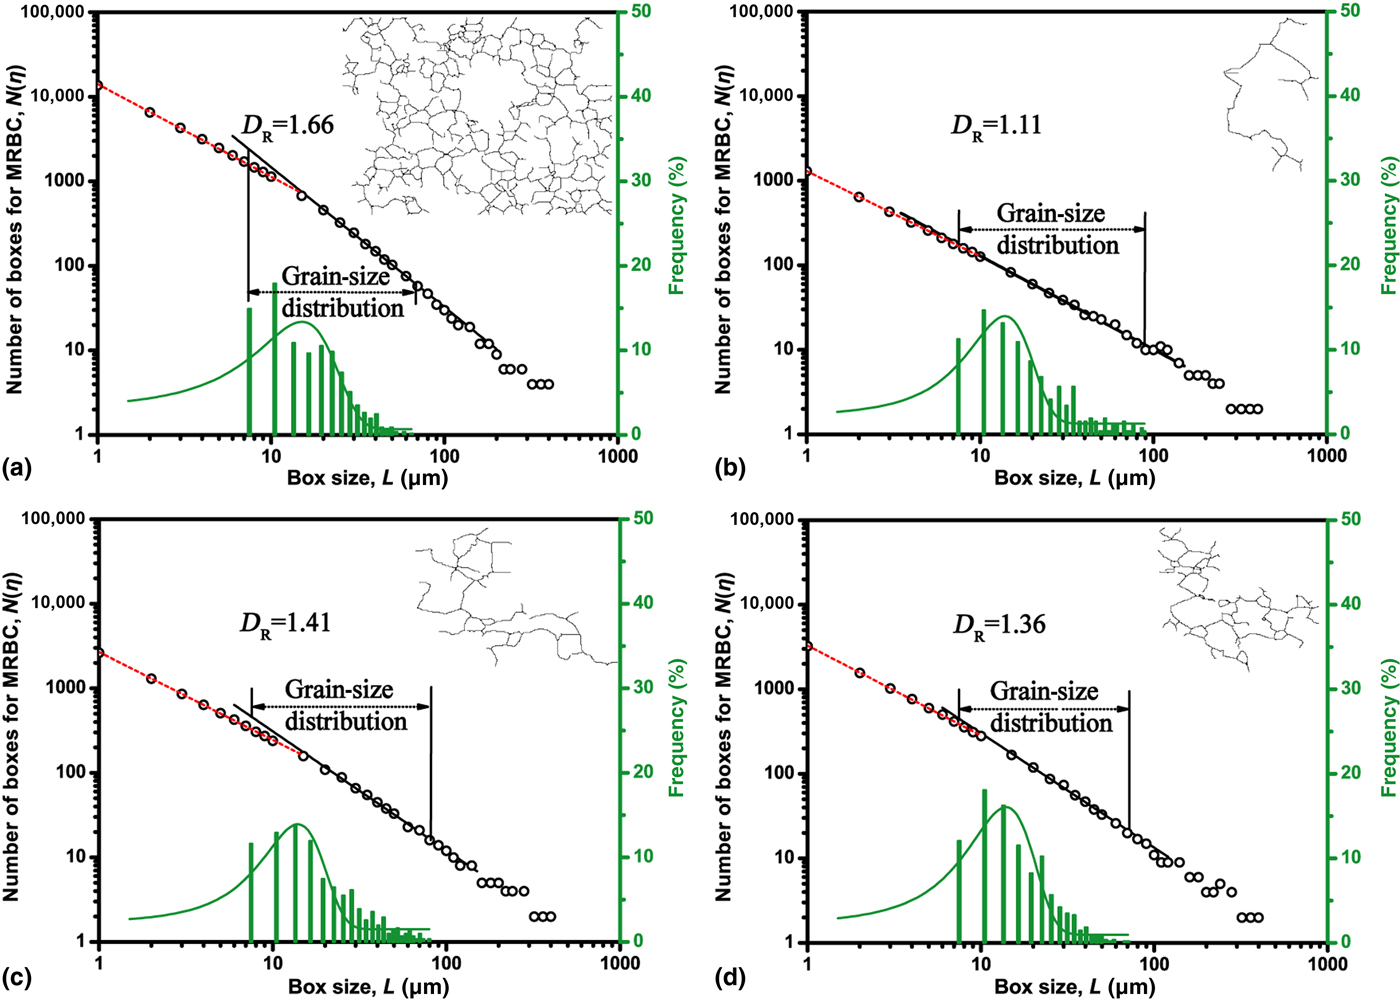
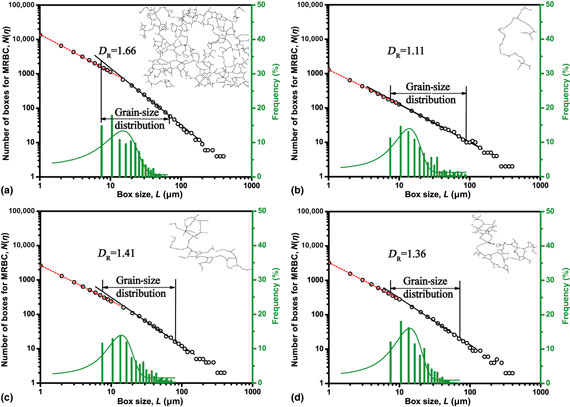
Figure 2(a) and 2(b) show the fractal dimension D R of MRBC through double-logarithm plots fitting of N (η) and η for the BFe10-1-1 specimens respectively corresponding to Fig. 1(a)–1(d). Appropriate computer code is utilized to generate a MRBC network [the upper inset in Fig. 2(a) and 2(b)] and further compute the length of network. The lengths of MRBC network of Type A, Type B, Type C, and Type D specimens are approximately 1.36 × 10⁴, 1.31 × 10³, 2.64 × 10³, 3.25 × 103 µm, respectively. There is a linear function between N (η) and η in the range of these scale lengths. Consequently, the MRBC possesses a fractal nature in this study. Further, there were multiple linear sections in double-logarithm plots, though not mathematically rigorous. This information helps to explain more complex profiles in their profile curves. The lineal sections were sensitive to the degree of micro-roughness when the selected box size η (~less than 10 µm) approaches the dimension of segment of made up zig-zag fashion GB profile, wherein N (η) shows a marked increase with decreasing η [red dotted line in Fig. 2(a) and 2(b)]. At present, therefore, the fractal dimension reflects the degree of micro-roughness of GB microscopic profile, while cannot reflect the degree of macro-roughness of MRBC. Since four types of specimen have similar zig-zag fashion GB microstructure, especially for smaller box size, so the fractal dimension is roughly same as 1.05.
Relationship between the number of boxes N (η) for complete coverage of the MRBC and the box size η for the different types of BFe10-1-1 specimens. (a) Type A; (b) Type B; (c) Type C; (d) Type D.

In order to quantitatively characterize the degree of roughness of the MRBC, the actual value of η was selected in the range of 10–100 µm, which is almost the range of grain size distribution [the lower inset in Fig. 3(a) and 3(b)]. The fractal dimension of MRBC, D R, can be calculated by the slope of the log N (η) versus log η, which changes between 1.11 and 1.66 through fitting curves. Moreover, the D R value of Type D specimen with higher F Σ is approximately same as Type C specimen, as seen from Fig. 2(c) and 2(d). Therefore, the fractal dimension of MRBC was strongly affected by grain size homogeneity.
Relationship between the fractal dimension of the MRBC D R and the fraction of low-Σ boundaries F Σ.

Figure 3 shows the trend of fractal dimension of MRBC with the fraction of low-Σ boundaries and random boundaries. The value of D R monotonically decreases with increasing value of F Σ, namely, with decreasing roughness of MRBC, the value of D R is decreased. According to the simulation results of Schuh et al.,[Reference Schuh, Minich and Kumar25] the threshold value of the special GB required to effectively suppress the intergranular failure to propagate along the random GB network is about 80%. From the fitting result, the value of D R corresponding to this value in BFe10-1-1 copper–nickel alloy was estimated to be 1.18. Specimens with F Σ and D R values located in the shaded areas of the Fig. 3 must exhibit very high corrosion resistance due to the fact that the corrosion-resistant low-Σ boundaries intersect with random boundary network and hinder the propagation of the corrosion path along the latter.[Reference Kobayashi, Maruyama, Tsurekawa and Watanabe15, Reference Kobayashi, Kobayashi and Watanabe16] According to the previous report, the Type B specimen with D R = 1.11 must exhibit resistance to intergranular degradation, while Type C and Type D specimens will exhibit similar resistance to intergranular degradation due to their approximate fractal dimensions.
Intergranular corrosion test
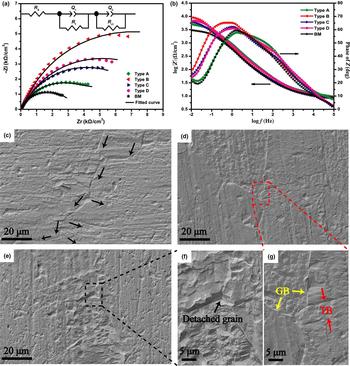
In order to obtain the corrosion resistance information of the surface of GBE treatment specimens, the EIS test was used to study the kinetics and passivation behavior of the sample polarization process. Figure 4(a) shows the corresponding Nyquist diagrams for the different GB structure specimens studied. Nyquist plots possess a single capacitive semicircle feature over the frequency range. It can be found that the diameter of the semicircle increases sharply with the decrease of D R, through an equivalent circuit fitted [the inset in Fig. 4(a)]. Owing to the heterogeneity of the electrode surface and fractal characteristics such as porosity or roughness, ideal capacitive elements are rarely used for practical electrochemical analysis; thus, constant phase element (CPE) is often used to replace it.[Reference Ma, Jiang, Zheng and Ke11] The R s represents electrolyte solution resistance, R f is the film resistance, and R ct is the charge transfer resistance. Q 1 is the dielectric properties of the double electric layer at film/solution interface, and Q 2 is the film capacitance.[Reference Cao, Wei, Dong and Ke26, Reference Subramanian, Chandramohan, Srinivasan, Velmurugan and Narasimhan27] The R total of the BM specimen is approximately 6.5 × 10³ Ω, while that of the Type A, Type B, Type C, and Type D specimens is 1.3 × 10⁴, 3.0 × 10⁴, 1.5 × 10⁴, and 1.5 × 10⁴ Ω, respectively. Experimental results confirm that the low D R samples show better corrosion resistance than higher D R samples. Compared with other specimens, the Type B sample has the highest charge transfer resistance of 1.9 × 10⁴ Ω, which suggests that Type B surface is covered by denser passive film than the other samples due to the higher twin density.[Reference Michiuchi, Kokawa, Wang, Sato and Sakai9]
Electrochemical impedance spectroscopy measurements and static immersing corrosion test results. Nyquist plots (a) and Bode plots (b); (c)–(e) are the surface morphologies of the Type A, Type B, and Type C samples after etching 240 h in (pH = 3) 3.5% NaCl solution at 298 K, (f) and (g) are the magnification of the rectangular zone in (e) and (d), respectively.

Fig. 4(b) is a Bode plot corresponding to the electrochemical impedance in Fig. 4(a). Obviously, the low-frequency impedance value increases around a half order of magnitude compared with BM specimen. It is noted that, along with the decreasing fractal dimension, the frequency range of the maximum phase angle becomes larger, showing an effective resistance to corrosion of the specimen surface.
The corrosion morphologies of the samples with different GB microstructures after etching 240 h are presented in Figs. 4(c)–4(e). The whole GBs of the Type A sample are corrosion attacked, and the intergranular corrosion propagates obviously along GBs, as indicted by arrows in Fig. 4(c). Nevertheless, the surface morphologies of Type B and Type C specimens simultaneously exhibit TB and GB corrosions, where the corrosion propagation is suppressed, as indicated in Figs. 4(d) and 4(e). Note that the Type C specimen exhibits obvious lamella detached from the surface, especially in the GB triple junction [in Fig. 4(f)]. In contrast, the Type B specimen with the lowest D R exhibits a uniform corrosion, and displays a relative flat surface [in Fig. 4(g)]. Thus, the lower fractal dimension samples possess much better corrosion resistance due to random boundary network of intergranular failure-prone were extensively disrupted.
Discussion
The high intergranular corrosion resistance of low fractal dimension of MRBC specimens can be attributed to F Σ and  $\sigma /\overline d $. The higher the MRBC fractal dimension, the lower F Σ and the larger
 $\sigma /\overline d $, resulting in worse intergranular corrosion resistance, such as Type A specimen. The specimens with middle fractal dimension (such as Type C and Type D specimens) possess the middle level of intergranular corrosion resistance. While the specimens with lowest fractal dimension (such as Type B specimens) exhibit the highest corrosion resistance percolation path along random boundaries network will be furtherly interrupted by special boundaries segment, particularly Σ3 boundaries, as shown in Fig. S2 (seen in Supplementary material).
Therefore, lower fractal dimension combined with lower GB is required for higher F Σ and lower  $\sigma /\overline d $ for suppressing corrosion path propagation. According to Σ-product rule,[Reference Randle, Hu and Coleman28] fraction of special boundaries and heterogeneity together increase with grain growth during GBE processing. Since the initial grain size of the BM stage has key effect on F Σ and
 $\sigma /\overline d $ (as shown in Fig. S1), to obtain lower fractal dimension of MRBC, refining BM grains is available. Nevertheless, the effect of
 $\overline d $ on the intergranular corrosion resistance has not been systematically studied till now. Kobayashi et al.[Reference Kobayashi, Kobayashi and Watanabe16] investigated that larger grain size tends to lead to lower fractal dimension of MRBC. Here, we obtained the same conclusion about the effect of grain size on corrosion resistance in BFe10-1-1 copper–nickel alloy. Actually, fractal dimension can more comprehensively and accurately reflect the trend of intergranular corrosion at present work. According to the percolation theory, intergranular failure resistance depends on the degree the random boundaries network is interrupted by special GB, namely, the grain surrounded by successive random boundaries connectivity is easier to drop-off from specimen surface. Although the prediction accuracy of the intergranular corrosion probability can be improved when GB planes and other GB structure factors are taken into consideration,[Reference Randle13] it is also feasible to accurately predict the intergranular failure resistance by the fractal dimension at present.
Conclusions
In this work, the random boundaries were extracted and further quantitated. Finally, the relationship between GB microstructure and intergranular corrosion was built. In GBE processing of BFe10-1-1 copper–nickel alloys, accurate prediction of corrosion resistance of materials and control of intergranular corrosion can be achieved through fractal analysis of MRBC. The following conclusions are made:
(1) In the GBE process, the grain growth convention has a strong effect on the fraction of highly ordered special boundaries F Σ and homogeneity of grain size
 $\sigma /\overline d $, refining BM grains is an available path to obtain low fractal dimension.
(2) The MRBC of BFe10-1-1 copper–nickel specimens possess a fractal nature. The value of F Σ together with
$\sigma /\overline d $ determines the fractal dimension D R of the MRBC. The higher fraction of low-Σ CSL boundaries and the more homogeneous grains induced the lower fractal dimension.(3) There is more than one fractal dimension for single MRBC, the range of validity of such fractals can be associated with MRBC macroscopic profile/microscopic segment features, fractal behavior is confined within grain dimension distribution.
(4) The value of D R of the MRBC reflects on the connectivity of random boundaries network. The lower the D R value, the higher intergranular corrosion resistance, which attributes that percolation path was further broken by corrosion-resistant special boundaries.


Supplementary material
The supplementary material for this article can be found at https://doi.org/10.1557/mrc.2018.211.
Acknowledgments
The authors are grateful to Biao Wen for providing the image processing software for fractal analysis. This work was supported by the National Key Research and Development Program of China (No. 2016YFB0301400).