Glucagon-like peptide-1 (GLP-1) is a gastrointestinal hormone produced by enteroendocrine cells(Reference Müller, Finan and Bloom1,Reference Gribble and Reimann2) . GLP-1 secretion is immediately increased by luminal nutrients (within 15–30 min) after meal ingestion. GLP-1 stimulates insulin secretion from pancreatic β-cells, and its action is known as the ‘incretin effect’. Another gastrointestinal hormone, glucose-dependent insulinotropic polypeptide (GIP), has insulin-stimulating effects. Thus, GLP-1 and GIP are called ‘incretins’ and play important roles in postprandial glucose homeostasis. GLP-1 has multiple physiological activities, including protection of pancreatic β-cells, satiety induction and suppression of gastric emptying. Accordingly, GLP-1 receptor agonists (GLP-1RAs) have been successfully used for the treatment of type 2 diabetes and obesity(Reference Holst3). Digestive products of macronutrients, such as glucose, fatty acids, peptides and amino acids, potently stimulate GLP-1 secretion. These mechanisms, including specific sensing molecules, have been elucidated in several studies(Reference Müller, Finan and Bloom1,Reference Hjørne, Modvig and Holst4) .
Numerous studies have investigated whether GLP-1 secretion increases or decreases in subjects with obesity, glucose intolerance (impaired glucose tolerance) or diabetes. An earlier study demonstrated impaired GLP-1 secretion in patients with type 2 diabetes(Reference Toft-Nielsen, Damholt and Madsbad5). In a large cohort study, people with overweight and obesity showed a 20 % lower GLP-1 response to oral glucose challenge(Reference Færch, Torekov and Vistisen6). However, comparable and incomparable results have been reported in other studies(Reference Nauck, Vardarli and Deacon7–Reference Nauck and Müller9).
In rodent models of obesity and diabetes, reduction(Reference Anini and Brubaker10–Reference Richards, Pais and Habib12), no change(Reference Paulsen, Larsen and Hansen13,Reference Hunt, Holst and Jepsen14) and enhancement(Reference Wang, Yoder and Yang15–Reference Nakajima, Hira and Hara17) of nutrient-induced GLP-1 secretion have been observed. Thus, it remains uncertain whether nutrient-induced GLP-1 secretion is diminished in obesity and/or glucose intolerance in both human and animal studies(Reference Nauck and Müller9,Reference Hira, Pinyo and Hara18,Reference Huber, Schieren and Holst19) .
In our initial study, contrary to our expectation, GLP-1 secretion in response to a single oral administration of a control meal (AIN-93G diet) was not reduced but rather enhanced in rats with diet-induced obesity (DIO) compared with normal rats(Reference Nakajima, Hira and Hara17). Subsequent studies observed comparable results(Reference Pinyo, Hira and Hara20,Reference Pinyo, Hira and Hara21) and clarified the role of the enhanced GLP-1 response in protecting against glucose intolerance induced by chronic obesogenic diet ingestion. Furthermore, it was demonstrated that the genetically diabetic rats (Goto-Kakizaki rat) were deficient in adaptively enhancing the GLP-1 response to an obesogenic diet, which resulted in the early development of severe glucose intolerance, compared with normal rats fed the same diet(Reference Pinyo, Hara and Hira22).
However, the mechanisms underlying the enhanced nutrient-induced GLP-1 secretion during the development of DIO remain unclear. Elucidating these mechanisms will provide novel strategies for preventing weight gain and glucose intolerance by modulating the GLP-1 system (secretion and production) through dietary interventions. Hypersecretion of GIP in obese models has been previously reported(Reference Maekawa, Ogata and Murase23–Reference Kanemaru, Harada and Shimazu-Kuwahara25). In contrast to GLP-1, endogenous GIP promotes fat accumulation(Reference Miyawaki, Yamada and Ban26,Reference Holst and Rosenkilde27) . Therefore, considering the physiologically beneficial role of GLP-1, we focused on GLP-1 secretion in the present study.
To evaluate nutrient-induced GLP-1 secretion, glucose or mixed meals have been orally administered in animal models and human subjects in previous studies as above. However, it is unclear to which nutrient the GLP-1 response is adaptively enhanced or reduced during the development of obesity. Another issue involves determining the part of the small intestine responsible for the enhanced GLP-1 response in obesity.
In the present study, we chronically fed rats with a high-fat diet and sucrose solution for 4–5 weeks to induce obesity. In rats with DIO and age-matched control rats, we compared the GLP-1 response to orally administered carbohydrate, lipid and protein. Furthermore, nutrient-induced GLP-1 responses were compared after direct administration into the proximal and distal small intestines of rats.
Methods
Animals, diets and reagents
It is ethically impossible to induce obesity through dietary intervention in human trials. Therefore, in this study, we continuously fed rats with an obesity-inducing diet and evaluated the effects of DIO on GLP-1 secretion in response to nutrients as the primary outcome measure.
Five-week-old male Sprague-Dawley rats were obtained from Japan SLC, Inc. The rats were fed a control diet (American Institute of Nutrition-93G based diet)(Reference Reeves28) for a one-week acclimation period. The rats were housed individually in environmentally controlled rooms (22 ± 2°C, 60 ± 5 % humidity) under a 12 h light–12 h dark cycle (light from 08:00 to 20:00). The rats had ad libitum access to food and water, except on the day before the nutrient challenge.
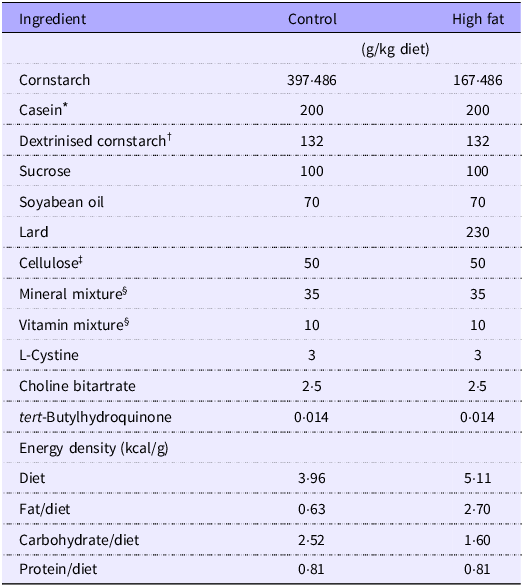
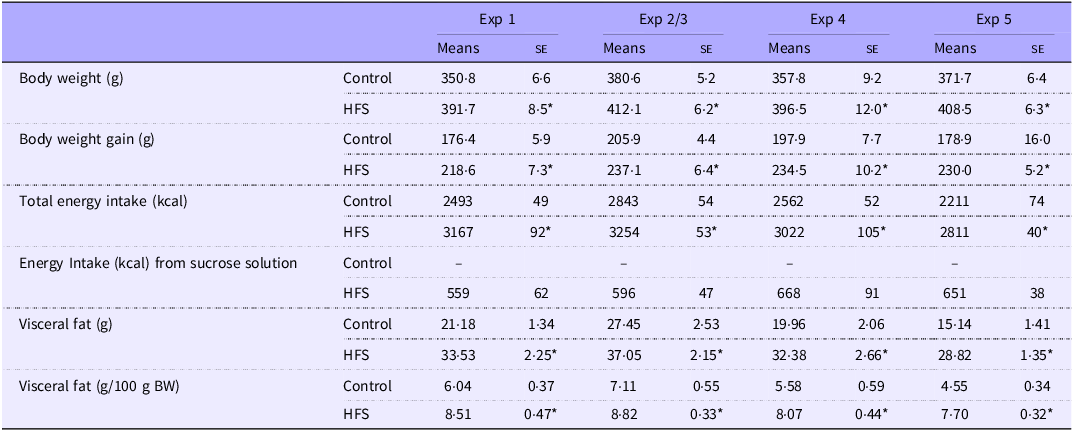
After the acclimation period, rats were divided into a control group and a high-fat diet/sucrose solution group (HFS, 30 % (w/w) shown in Table 1, and 30 % (w/vol) sucrose solution)(Reference Gil-Lozano, Wu and Martchenko29) based on the body weight (BW). The HFS group had free access to both water and sucrose solution. BW, food intake and sucrose solution intake were measured every 1–2 days. To investigate GLP-1 secretion in response to individual nutrients during the development of DIO, rats were fed test diets for 4–5 weeks. These treatments provide significantly higher BW gain (approx. 20 %, Table 2). All experimental procedures were approved by the Hokkaido University Animal Committee (permission numbers 14-0013, 19-0064 and 19-0072), and the animals were maintained in accordance with the Hokkaido University Guidelines for the Care and Use of Laboratory Animals.
Diet compositions

* TK-16 (Matsutani Chemical Industry, Hyogo, Japan).
† ALACID Lactic Casein (New Zealand Dairy Board).
‡ Just fiber (MORIMURA BROS., INC, Tokyo, Japan).
§ Mineral and vitamin mixtures were prepared according to the AIN-93G formulation.
Body weight, energy intake and adipose tissue weight of rats fed the control diet (control) or the high-fat diet with sucrose solution (HFS) for 4 weeks (Experiments 1–4) and 5 weeks (Experiment 5)

Values are presented as the means ± se of mean (n 8–16). Asterisks (*) indicate significant differences between mean values of treatments (control v. HFS), as determined by Student’s t-test (P < 0.05).
Reagents were purchased from FUJIFILM Wako Pure Chemical Corporation unless otherwise specified.
Nutrient challenges in vivo (Experiments 1–4)
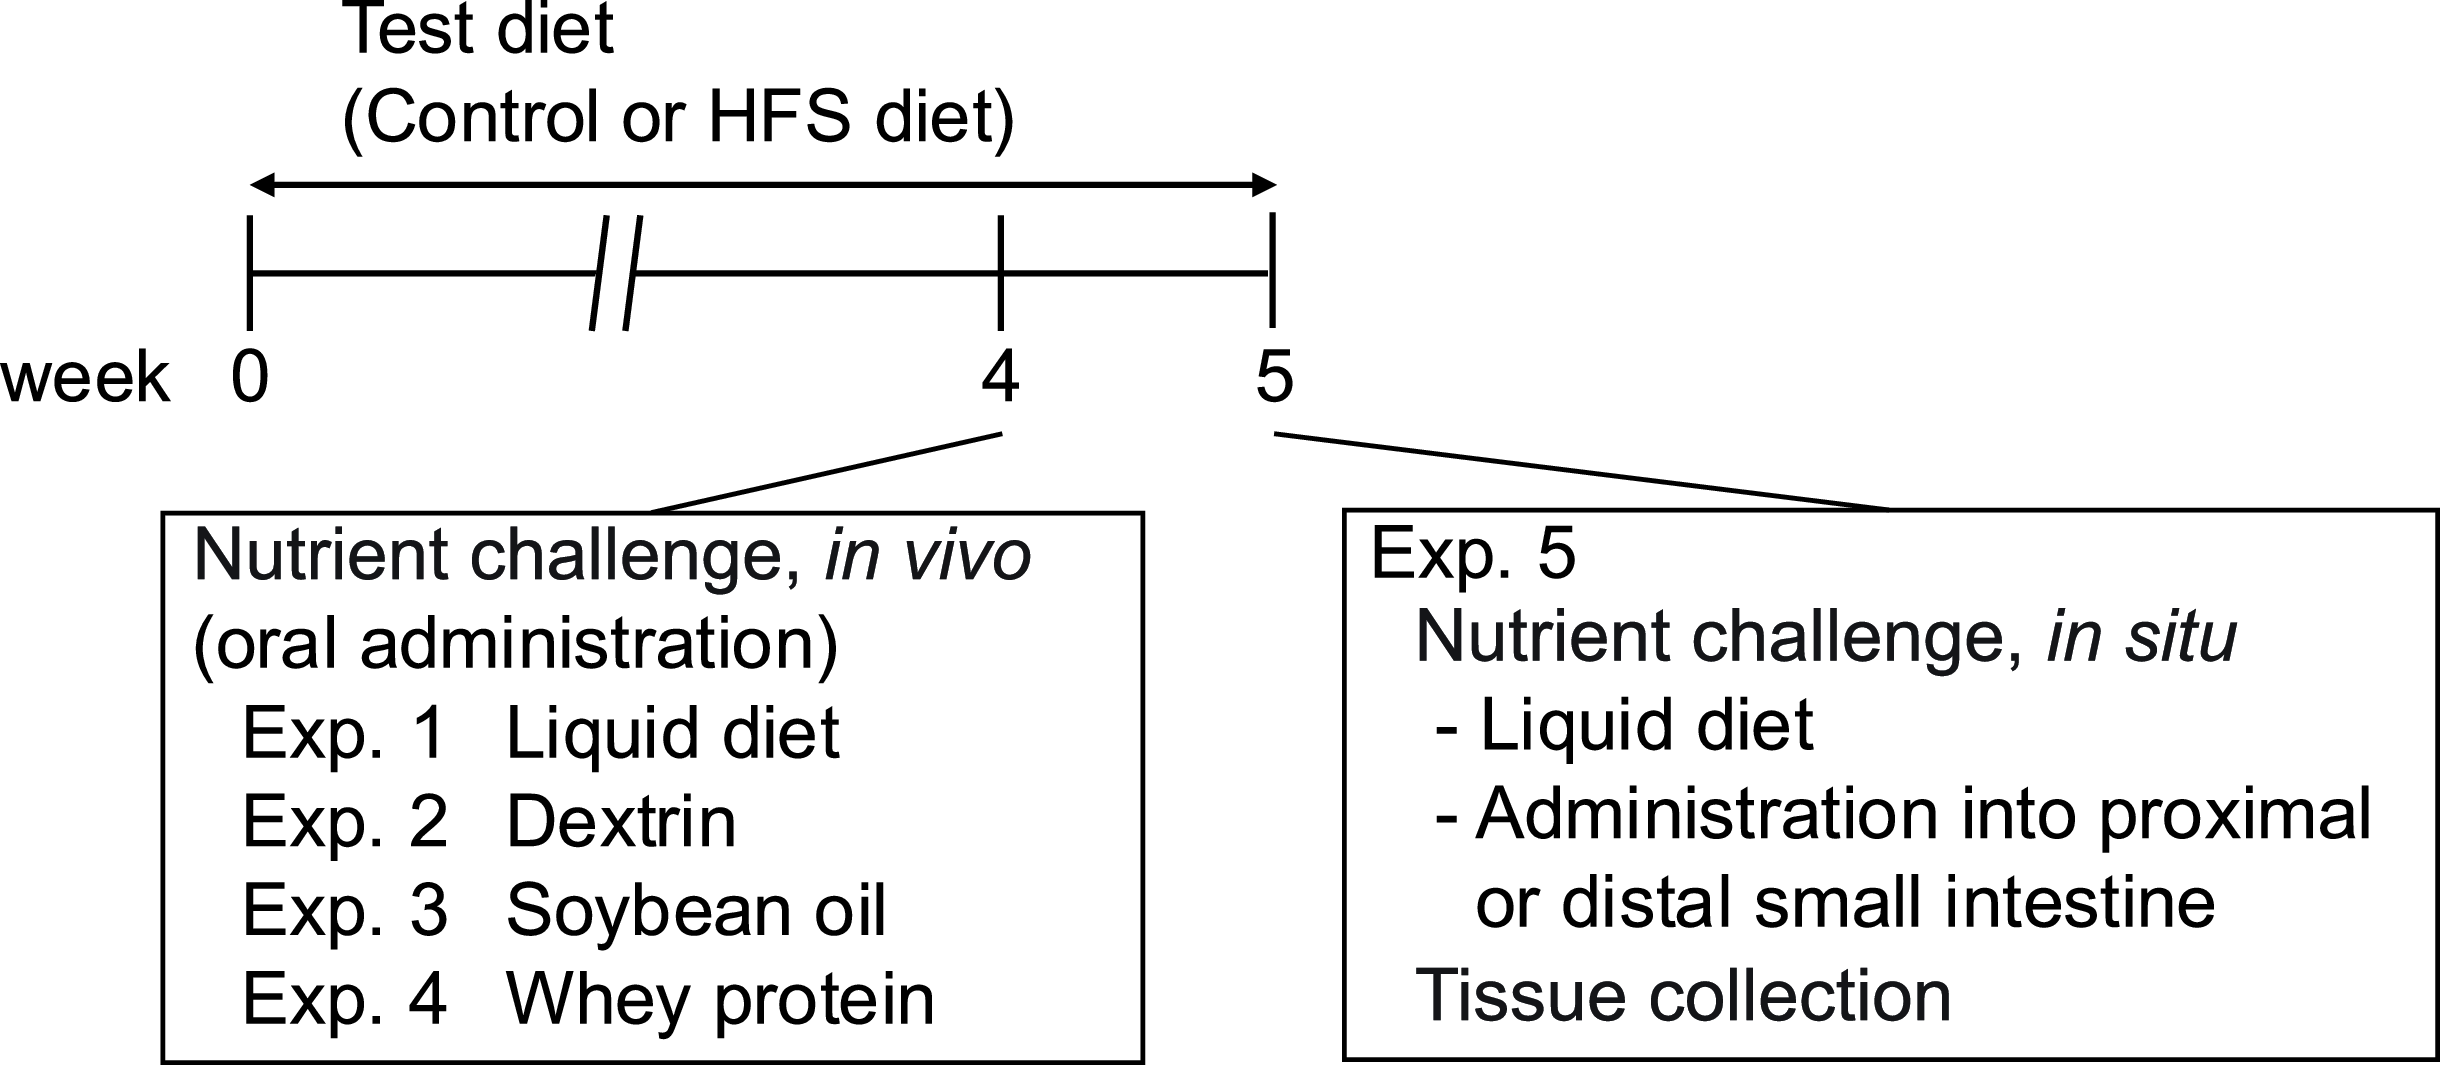
Experimental designs are summarised in Fig. 1. After 4 weeks of test diet (control or HFS) feeding, the rats were fasted overnight with free access to water, but not to sucrose solution. Before the oral administration of the test nutrients, basal blood (0 min) was collected from the tail vein. The following materials were orally administered to rats:
-
Experiment 1 (liquid diet): Ensure H (Abbott Japan LLC) at 15 kcal/10 ml/kg BW
-
Experiment 2 (dextrin): TK-16 (Matsutani Chemical Industry Co. Ltd.) at 3.75 g (15 kcal)/10 ml/kg BW
-
Experiment 3 (soyabean oil): Intralipos (Otsuka Pharmaceutical Co. Ltd.) at 15 kcal/10 ml/kg BW
-
Experiment 4 (whey protein): Whey protein isolate (whey protein; WPI8855, Fonterra Co-operative Group Limited) at 3.75 g (15 kcal)/10 ml/kg BW
Experimental outline. Nutrients (Exp.1: liquid diet, Exp. 2: dextrin, Exp. 3: soyabean oil, Exp. 4: whey protein) were orally administered to rats fed a control diet (control group) or a high-fat diet and sucrose solution (HFS group) for 4 weeks. The liquid diet was directly administered to the proximal or distal small intestine of anaesthetised rats fed the control or HFS diet for 5 weeks (Exp. 5). Intestinal tissue samples were collected from rats fed either the control diet or HFS diet for 5 weeks (Exp. 5). HFS, high-fat diet with sucrose solution.

Blood samples were collected from the tail vein into the tube containing heparin (final concentration 50 IU/ml; Ajinomoto Company Inc.), aprotinin (final concentration 500 Kallikrein inhibitor units (kIU)/ml; Wako Pure Chemical Industries Ltd) and a DPP-IV inhibitor (final concentration: 50 μM; DPP4-010; Merck Millipore), at 15, 30, 60, 90 and 120 min after the oral administration.
Plasma was separated from the blood samples by centrifugation at 2300 g for 10 min at 4°C and then frozen at –80°C until measurements were taken. Plasma GLP-1 concentrations were determined using Multi Species GLP-1 Total ELISA (EZGLP1T-36K; Merck Millipore) in Experiment 1 or GLP-1 ELISA Kit Wako, High Sensitive (Wako) in Experiments 2–4, respectively. Plasma glucose and insulin concentrations were measured using Glucose CII test kit (Wako, Osaka, Japan) and insulin ELISA kit (Mouse/Rat Total Insulin (high sensitivity) Assay Kit – IBL, Fujioka, Japan), respectively.
The rats were killed by exsanguination, and weights of mesenteric, retroperitoneal and epididymal adipose tissue were measured. The sum of these adipose tissue weights was represented as visceral adipose tissue weight in Table 2.
Nutrient challenge in situ (Experiment 5)
In Experiment 5, the rats were fed the test diet (control or HFS) for 5 weeks. They were then feed-deprived overnight, and laparotomy was performed under anaesthesia with sodium pentobarbital (50 mg/kg, Somunopentyl; Kyoritsu Seiyaku Co.). The rats were randomly allocated to each group using the standard = RAND() function in Microsoft Excel. A small tip of a polyethylene catheter (SP28; Natsume Seisakusho Co., Ltd.) connected to a silicone catheter (SILASCON No. 00; Kaneka Medix Corp.) was inserted into the portal vein and fixed with an instant glue(Reference Igarashi, Ogasawara and Takagi30). Blood samples were collected through the catheter before (0 min as baseline) duodenal or ileal administration of a liquid diet (Ensure H at 7·5 kcal/5 ml/kg, Abbott Japan). Blood samples were drawn into a syringe pre-filled with heparin (final concentration: 50 IU/ml), aprotinin (from bovine lung, final concentration: 500 kIU/ml), and a DPP-4 inhibitor (final concentration: 10 μl/ml). The test solution was directly administered into the lumen of the duodenum or of the ileum at 45 cm proximal to the cecum (the middle region of the small intestine). Then, blood samples were collected through the catheter until 120 min as indicated in the figure. Plasma GLP-1 concentrations were determined using Multi Species GLP-1 Total ELISA (EZGLP1T-36K; Merck Millipore).
Intestinal tissue analysis (Experiment 5)
The rats fed the test diet (control or HFS) for 5 weeks were fasted overnight and euthanised by exsanguination under anaesthesia with sodium pentobarbital (50 mg/kg BW). The intestinal segments (duodenum, jejunum and ileum) were immediately dissected and washed with cold saline, as described previously(Reference Pinyo, Hara and Hira22). Briefly, segments and mucosa were collected from each region for the measurement of GLP-1 levels, performing immunohistochemistry, and analysing mRNA expression levels.
To measure GLP-1 content, intestinal segments were rapidly frozen in liquid nitrogen (N2) and stored at –80°C until analysis. The intestinal tissues were minced and homogenised in an acid alcohol solution (74 % ethanol, 25 % water and 1 % HCl 12 N, at 5 ml/g tissue weight), followed by extraction at 4°C for 24 h(Reference Cani, Hoste and Guiot31). Aliquots were used for measuring protein concentrations using Lowry’s protein assay. The homogenate was centrifuged and the supernatant was used for GLP-1 ELISA (EZGLP1T-36 K; Merck Millipore) after a 500-fold dilution.
For real-time quantitative PCR, intestinal mucosa samples were transferred to the tubes containing lysis buffer (RLT buffer in RNeasy Mini Kit; Qiagen)[u and immediately frozen in liquid N2, then stored at –80°C until RNA extraction. Total RNA was extracted using the RNeasy Mini Kit (Qiagen), and complementary DNA was synthesised using the ReverTra Ace qPCR Master Mix with gDNA Remover (Toyobo Company Limited). Gene expression levels were analysed by TaqMan gene expression assays (Thermo Fisher Scientific Inc.) using rat gene-specific predesigned TaqMan primers and probe sets (online Supplementary Table 1). The relative expression level of each gene was compared with that of the reference gene, gapdh, using the standard curve method.
For immunohistochemistry(Reference Svendsen, Pedersen and Albrechtsen32), tissue samples were fixed by immersing into 4 % paraformaldehyde in 0·1 M phosphate buffer (pH 7·4) overnight, then transferring to a 30 % sucrose solution and stored at 4°C. Tissues were embedded in O.C.T compound (Sakura Finetek Japan Co., Ltd.) and cut into sections (8 µm) using a cryostat (Leica Biosystems Nussloch GmbH). The sections were incubated in 0·1 % TritonX-100/PBS for 20 min, followed by incubation in 10 % BSA/PBS for 1 h. After washing with 0·1 % BSA/PBS, tissues sections were incubated with primary antibody against GLP-1 (sc-7782, Santa Cruz Biotechnology, 1:300 dilution) overnight at 4°C. Tissue sections were washed with 0·1 % BSA/PBS, then incubated with a secondary antibody (donkey anti-goat IgG (H + L), Cross-Adsorbed Secondary Antibody, Alexa Fluor 488, Thermo Fisher Scientific Inc.) for 1 h. After washing with 0·1 % BSA/PBS, tissue sections were mounted using prolong gold antifade reagent with DAPI (P36935, Thermo Fisher Scientific). Fluorescence microscopy images were obtained using fluorescence microscopes (BZ-9000, KEYENCE CORPORATION; and BX40, Olympus). BZ-X700 Analyzer (KEYENCE) software was used to calculate the area of the tissue section images. Three sections were prepared from each tissue, and the area of the section and the lengths of more than 10 villi were measured per section. The average of these values was used as data for a single tissue sample.
Statistical analysis
We used JMP Pro version 17·0·0 software (SAS Institute, Inc.) for following analysis, and for sample size calculation based on the experimental design (Student’s t-test, Control v. HFS). The sample size (n 8/group) was sufficient to provide >80 % power with an α level of 0·05, when mean GLP-1 levels differ by 1·5 times between treatments, with a coefficient of variation of 0·3. The number of rats varied per group among treatments because some of the rats unexpectedly refused oral administration on the day of experiment. Data are expressed as means ± standard error of mean (sem). Two-way ANOVA was performed to analyse the effect of test diet (Control v. HFS diet) on initial GLP-1 responses throughout the experiments (Experiment 1–4, Fig. 2(e)). Student’s t-test was used for two-group comparisons. Dunnett’s test (v. baseline values) was used to compare the mean values in the time-course studies. In all analyses, P < 0·05 was considered statistically significant.
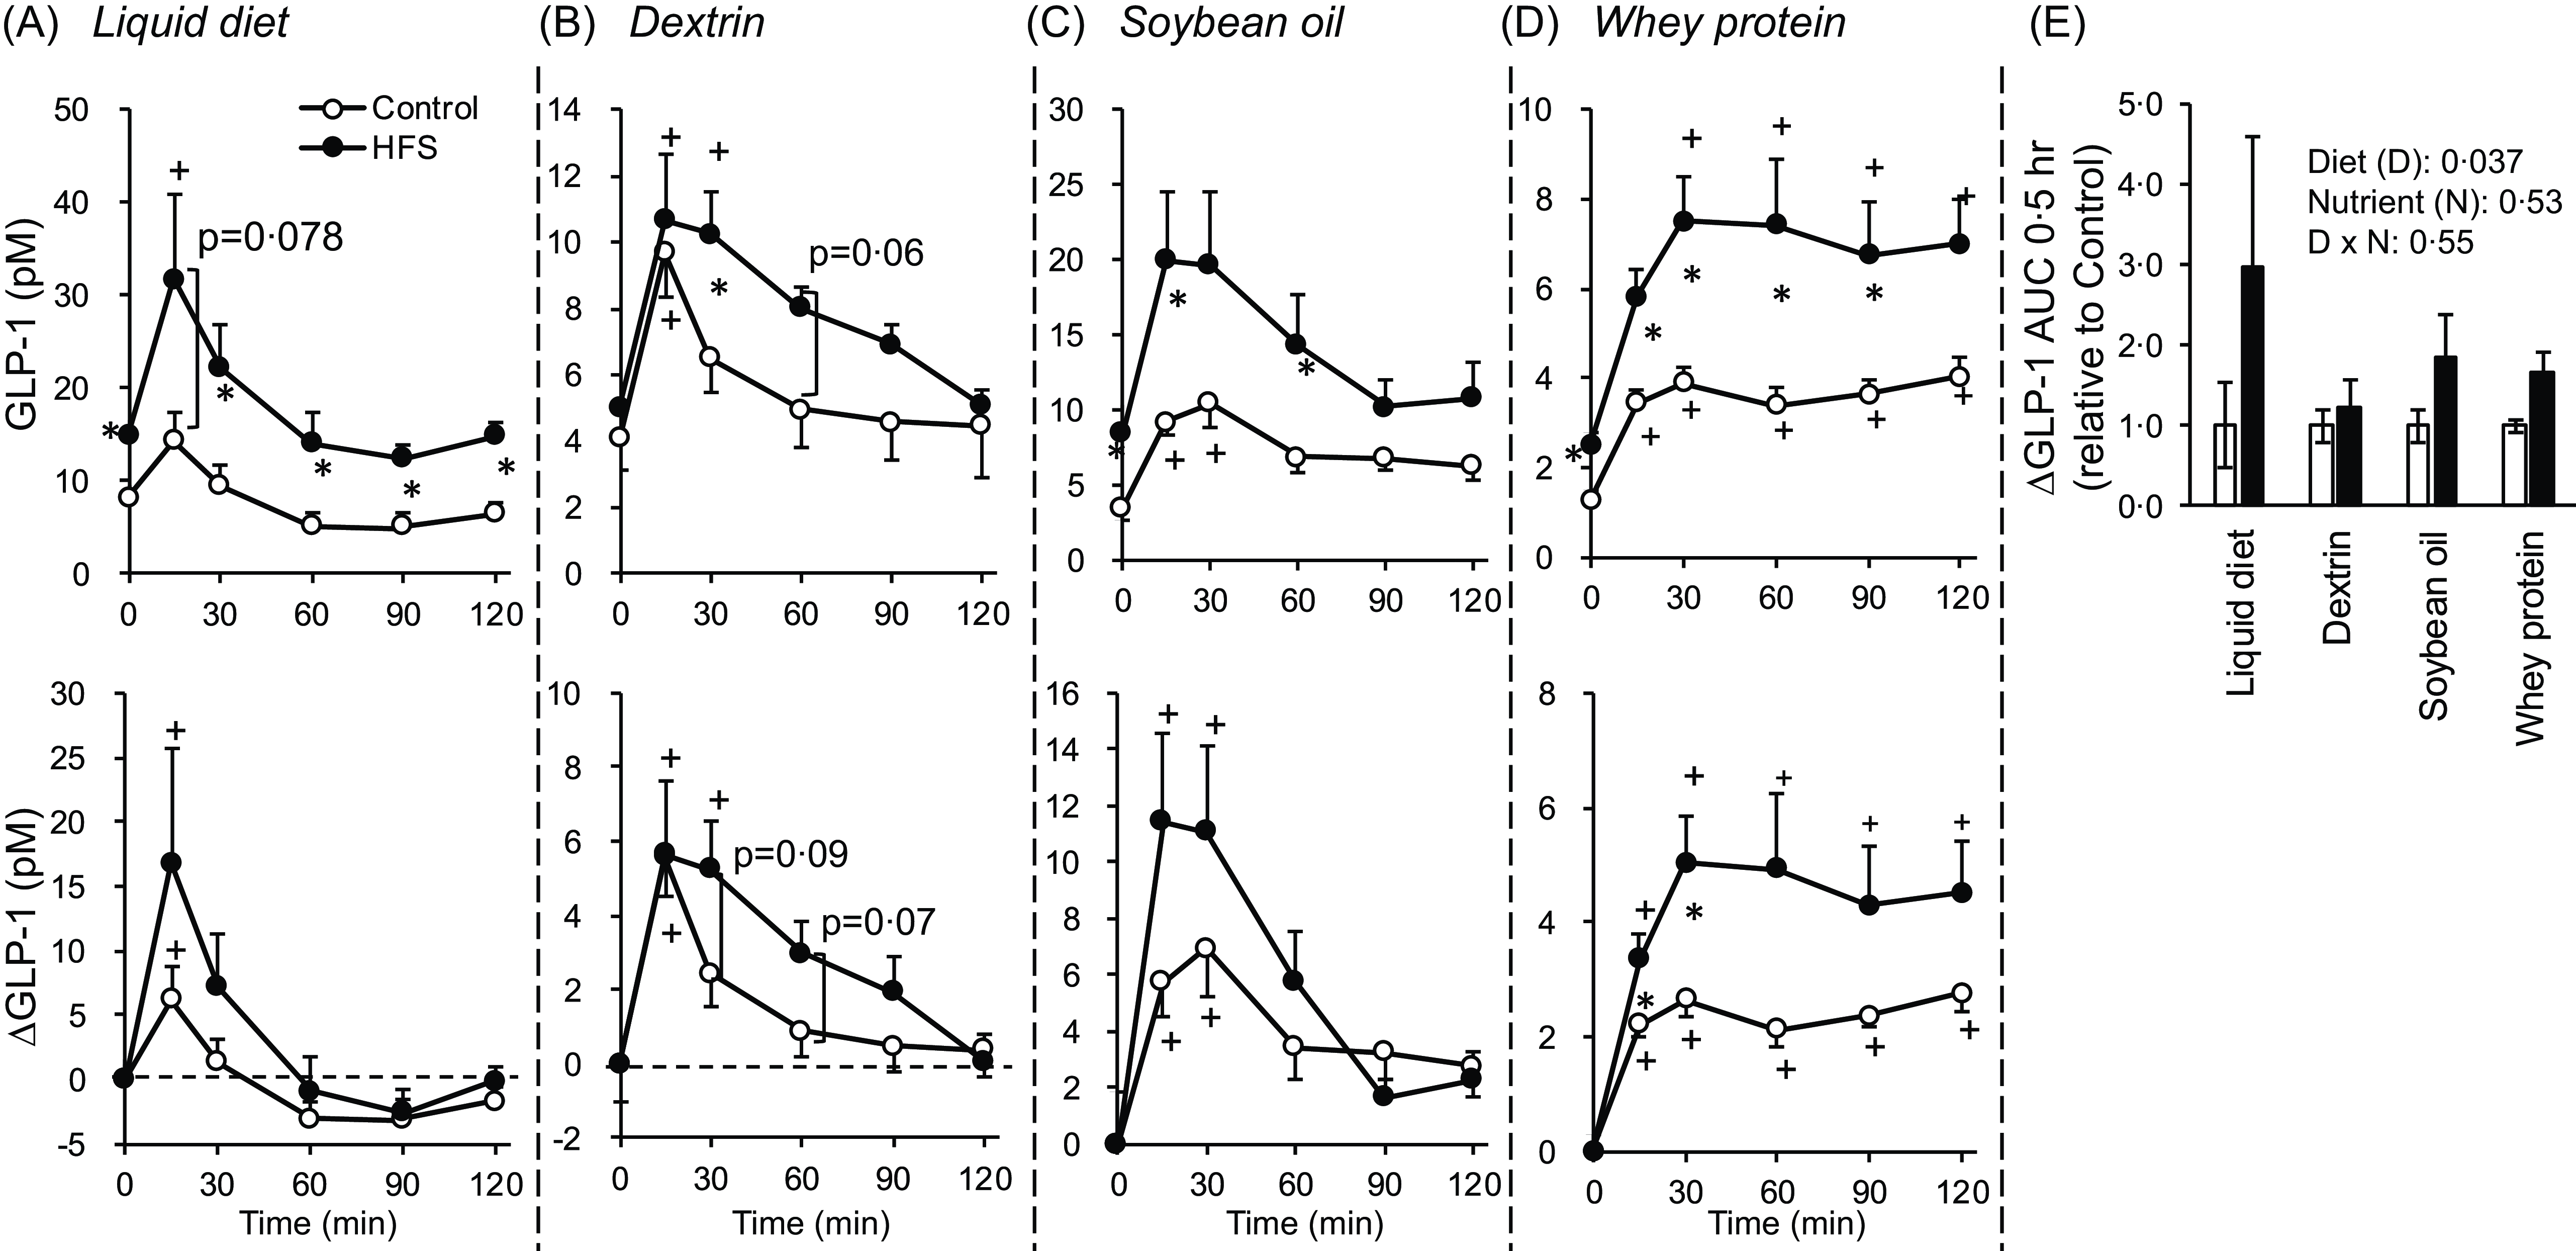
GLP-1 responses to oral administration of various nutrients in control rats and rats with diet-induced obesity. The rats were fed a control diet (control group) or a high-fat diet with sucrose solution (HFS group) for 4 weeks. After overnight fasting, they were subjected to a nutrient challenge. Liquid diet (15 kcal/kg BW, Experiment 1, panel A), dextrin (3·75 g (15 kcal/kg) BW, Experiment 2, panel B), soyabean oil (15 kcal/kg BW, Experiment 3, panel C), or whey protein (3·75 g (15 kcal/kg) BW, Experiment 4, panel D) was administered orally. Blood samples were collected from the tail vein before and after oral administration. Plasma GLP-1 concentrations were measured using ELISA kits (Millipore kit in Experiment 1 and Wako kit in Experiment 2–4). Panel E presents the relative values of the area under the curve of ∆GLP-1 for the initial 30 min, corrected by the value of the control group in each experiment. Values are presented as the means ± sem (n 7–8). Asterisks (*) indicate significant differences between the mean values at the same time point (control v. HFS), as determined by Student’s t-test (P < 0·05). Plus (+) signs indicate significant differences between basal (0 min) values and the values at each time point, as determined by Dunnett’s test (P < 0·05). Two-way ANOVA P values for ∆GLP-1 AUC are presented in the panel E. GLP-1, glucagon-like peptide-1; HFS, high-fat diet with sucrose solution.

Results
Glucagon-like peptide-1 responses to mixed and individual nutrients in rats chronically fed the control or high-fat diet with sucrose solution diet
Parameters related to obesity induction (BW, BW gain and adipose tissue weight) were higher in HFS-fed rats than in control rats in every experiment, accompanied by higher energy intake (Table 2). In experiments 2 and 3, rats (n 32, total) fed the test diet (control or HFS, n 16 each) were allocated to four groups (Control/dextrin, HFS/dextrin, Control/soyabean oil and HFS/soyabean oil, n 8); therefore, the data (Table 2) are presented as combined data (Experiment 2/3).
Glycaemic and insulin responses to oral administration of the liquid diet were significantly higher in HFS-fed rats than in control rats (online Supplementary Fig.1). Although the difference in glucose concentrations was relatively small, these results suggest glucose tolerance and/or insulin sensitivity was getting impaired in HFS-fed rats under the experimental condition.
Basal GLP-1 concentrations were significantly higher in HFS-fed rats than in control rats in Experiments 1, 3 and 4. Oral administration of the liquid diet (Fig. 2(a)) induced a small increase in plasma GLP-1 concentration in control rats, whereas it induced a significant increase compared to basal level at 15 min in HFS-fed rats. Dextrin (Fig. 2(b)) similarly increased GLP-1 concentrations in both groups at 15 min, but the increment was sustained for 30 min only in HFS-fed rats. Soyabean oil (Fig. 2(c)) increased GLP-1 concentrations in both groups at 15 and 30 min, and the HFS-fed rats showed a larger elevation. GLP-1 response (∆GLP-1 and ∆AUC) to whey protein was significantly higher in HFS-fed rats than control rats (Fig. 2(d)). Overall, HFS-fed rats showed higher responses. Statistically significant effect of test diet (Control v. HFS diet, P = 0·037) was observed in relative ∆GLP-1 AUC for the initial 30 min using two-way ANOVA (Fig. 2(e)).
Glucagon-like peptide-1 responses to nutrient mixture in proximal or distal small intestine of rats chronically fed the control or high-fat diet with sucrose solution diet
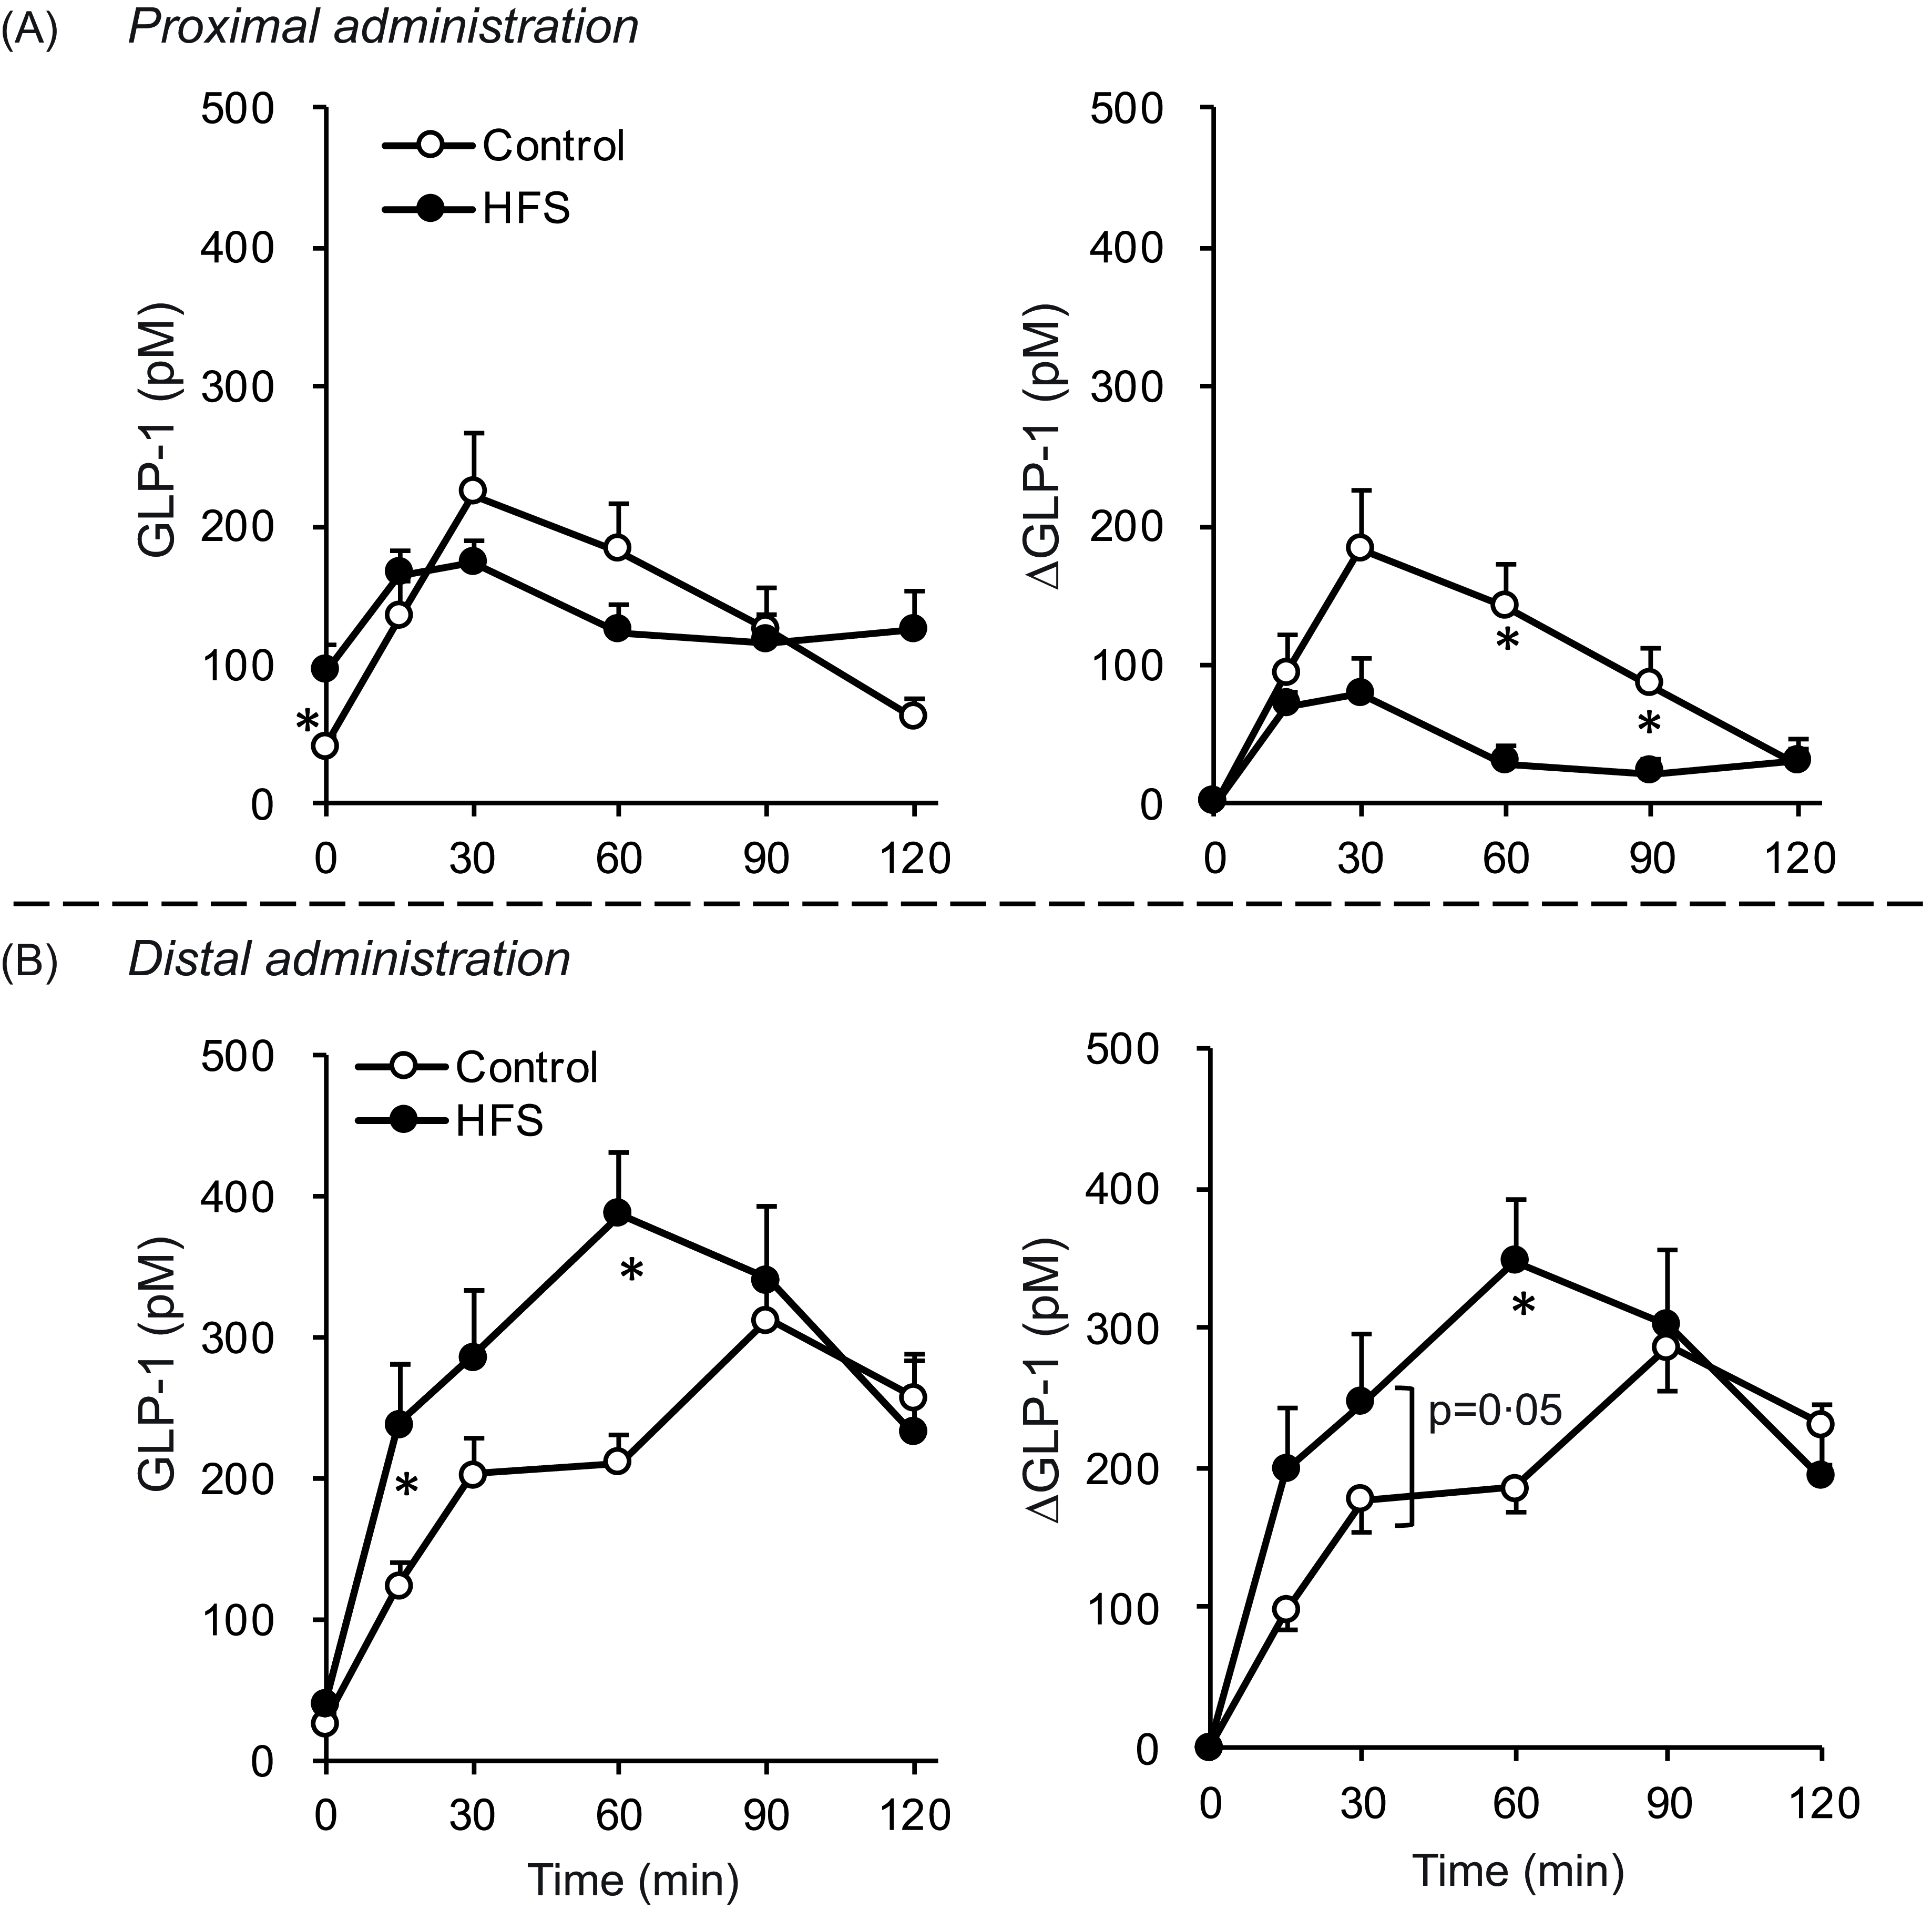
In anaesthetised rats (Control and HFS-fed), a liquid diet was directly administered into the lumen of the proximal or distal small intestine to compare regional GLP-1 responses. Administration into the proximal small intestine induced an increase in portal GLP-1 concentrations, peaking at 30 min, which were slightly lower in HFS-fed rats than in control rats (Fig. 3(a)). The ∆AUC value for the HFS-fed rats was significantly lower than that of the control rats. In contrast, although the ∆AUC value did not significantly differ, the GLP-1 response to administration into the distal small intestine was greater (significantly at 15 and 60 min) in HFS-fed rats than in control rats (Fig. 3(b)). Overall, GLP-1 concentrations were higher, and the elevation was sustained longer after distal administration than after proximal administration (Fig. 3(a) v. 3(b)).
GLP-1 responses to intraluminal (proximal or distal small intestine) administration of liquid diet in control rats and rats with diet-induced obesity. The rats were fed a control diet (control group) or a high-fat diet with sucrose solution (HFS group) for 4 weeks. After overnight fasting, rats were subjected to portal vein cannulation under anaesthesia. A liquid diet (15 kcal/kg BW) was administered to the proximal (a) or distal small intestine (b). Blood samples were collected from the portal vein using a catheter before and after luminal administration. Plasma GLP-1 concentrations were measured using Millipore ELISA kit. Values are presented as means ± sem (n 8). Asterisks (*) indicate significant differences between the mean values at the same time point (control v. HFS), as determined by Student’s t-test (P < 0·05). Plus (+) signs indicate significant differences between basal (0 min) values and the values at each time point, as determined by Dunnett’s test (P < 0·05). GLP-1, glucagon-like peptide-1; HFS, high-fat diet with sucrose solution.

Glucagon-like peptide-1 content and glucagon-like peptide-1-producing cell numbers in intestinal tissues of rats chronically fed the control or high-fat diet with sucrose solution diet
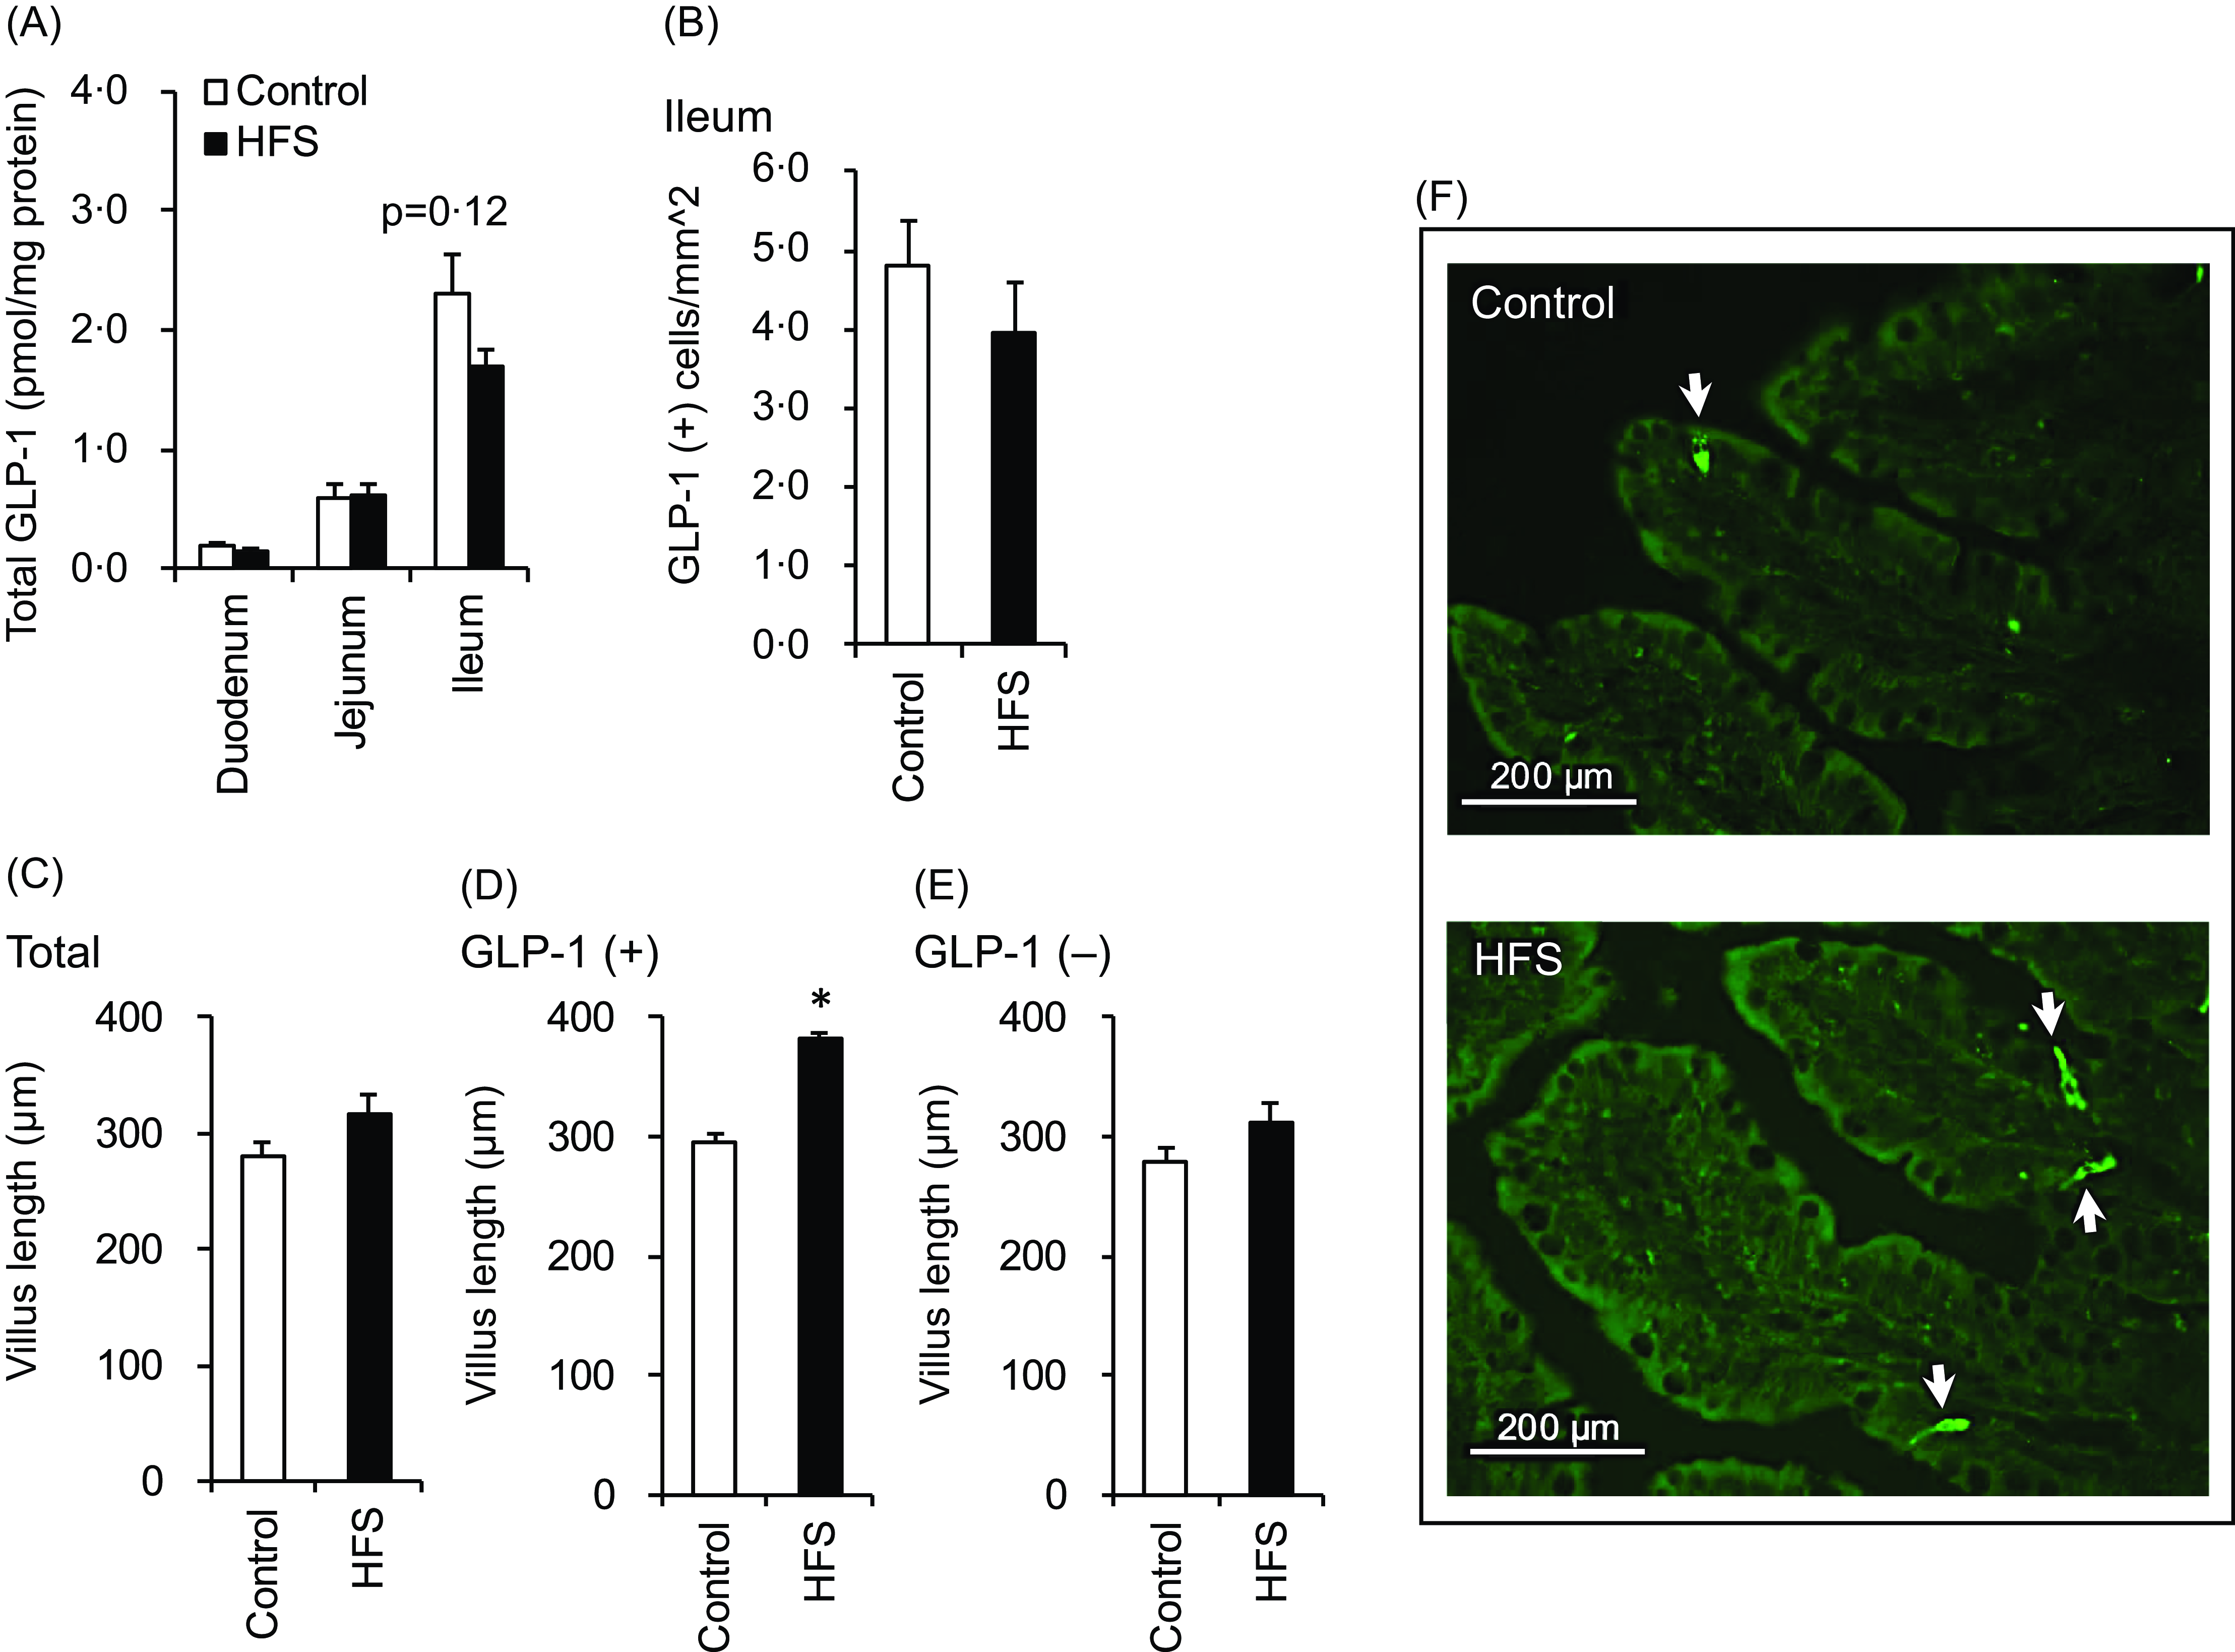
As expected, GLP-1 concentrations (Fig. 4(a)) increased from the proximal to the distal axis, and there were no differences between treatments. The density of GLP-1-producing cells in the ileum did not differ between treatments (Fig. 4(b)). There was no difference in the ileal villus length (Fig. 4(c)). However, when the data were analysed based on the presence (detection) of GLP-1-positive cells in each villus, GLP-1-positive villi were longer in HFS rats than in control rats (Fig. 4(d)). In contrast, the length of GLP-1-negative villi did not differ between treatments (Fig. 4(e)).
GLP-1 content, GLP-1-producing cell density, and villi length of the small intestine of control rats and rats with diet-induced obesity. Intestinal tissue samples were collected from rats fed the control or HFS diet for 5 weeks. GLP-1 concentration (a) was measured in the duodenum, jejunum, and ileum. The GLP-1-producing cell density was measured in the ileum (b). The lengths of the villi with GLP-1-producing cells (+) (d), without GLP-1-producing cells (–) (e), or regardless of the presence of GLP-1-producing cells (total) were measured in the ileum (c). Representative immunohistochemical staining of GLP-1-producing cells (arrow) in ileal tissues (f). Values are presented as means ± sem (n 8). Asterisks (*) indicate significant differences between mean values between treatments (control v. HFS), as determined by Student’s t-test (P < 0·05). GLP-1, glucagon-like peptide-1; HFS, high-fat diet with sucrose solution.

mRNA expressions of nutrient-sensing molecules in intestinal tissues of rats chronically fed the control or high-fat diet with sucrose solution diet
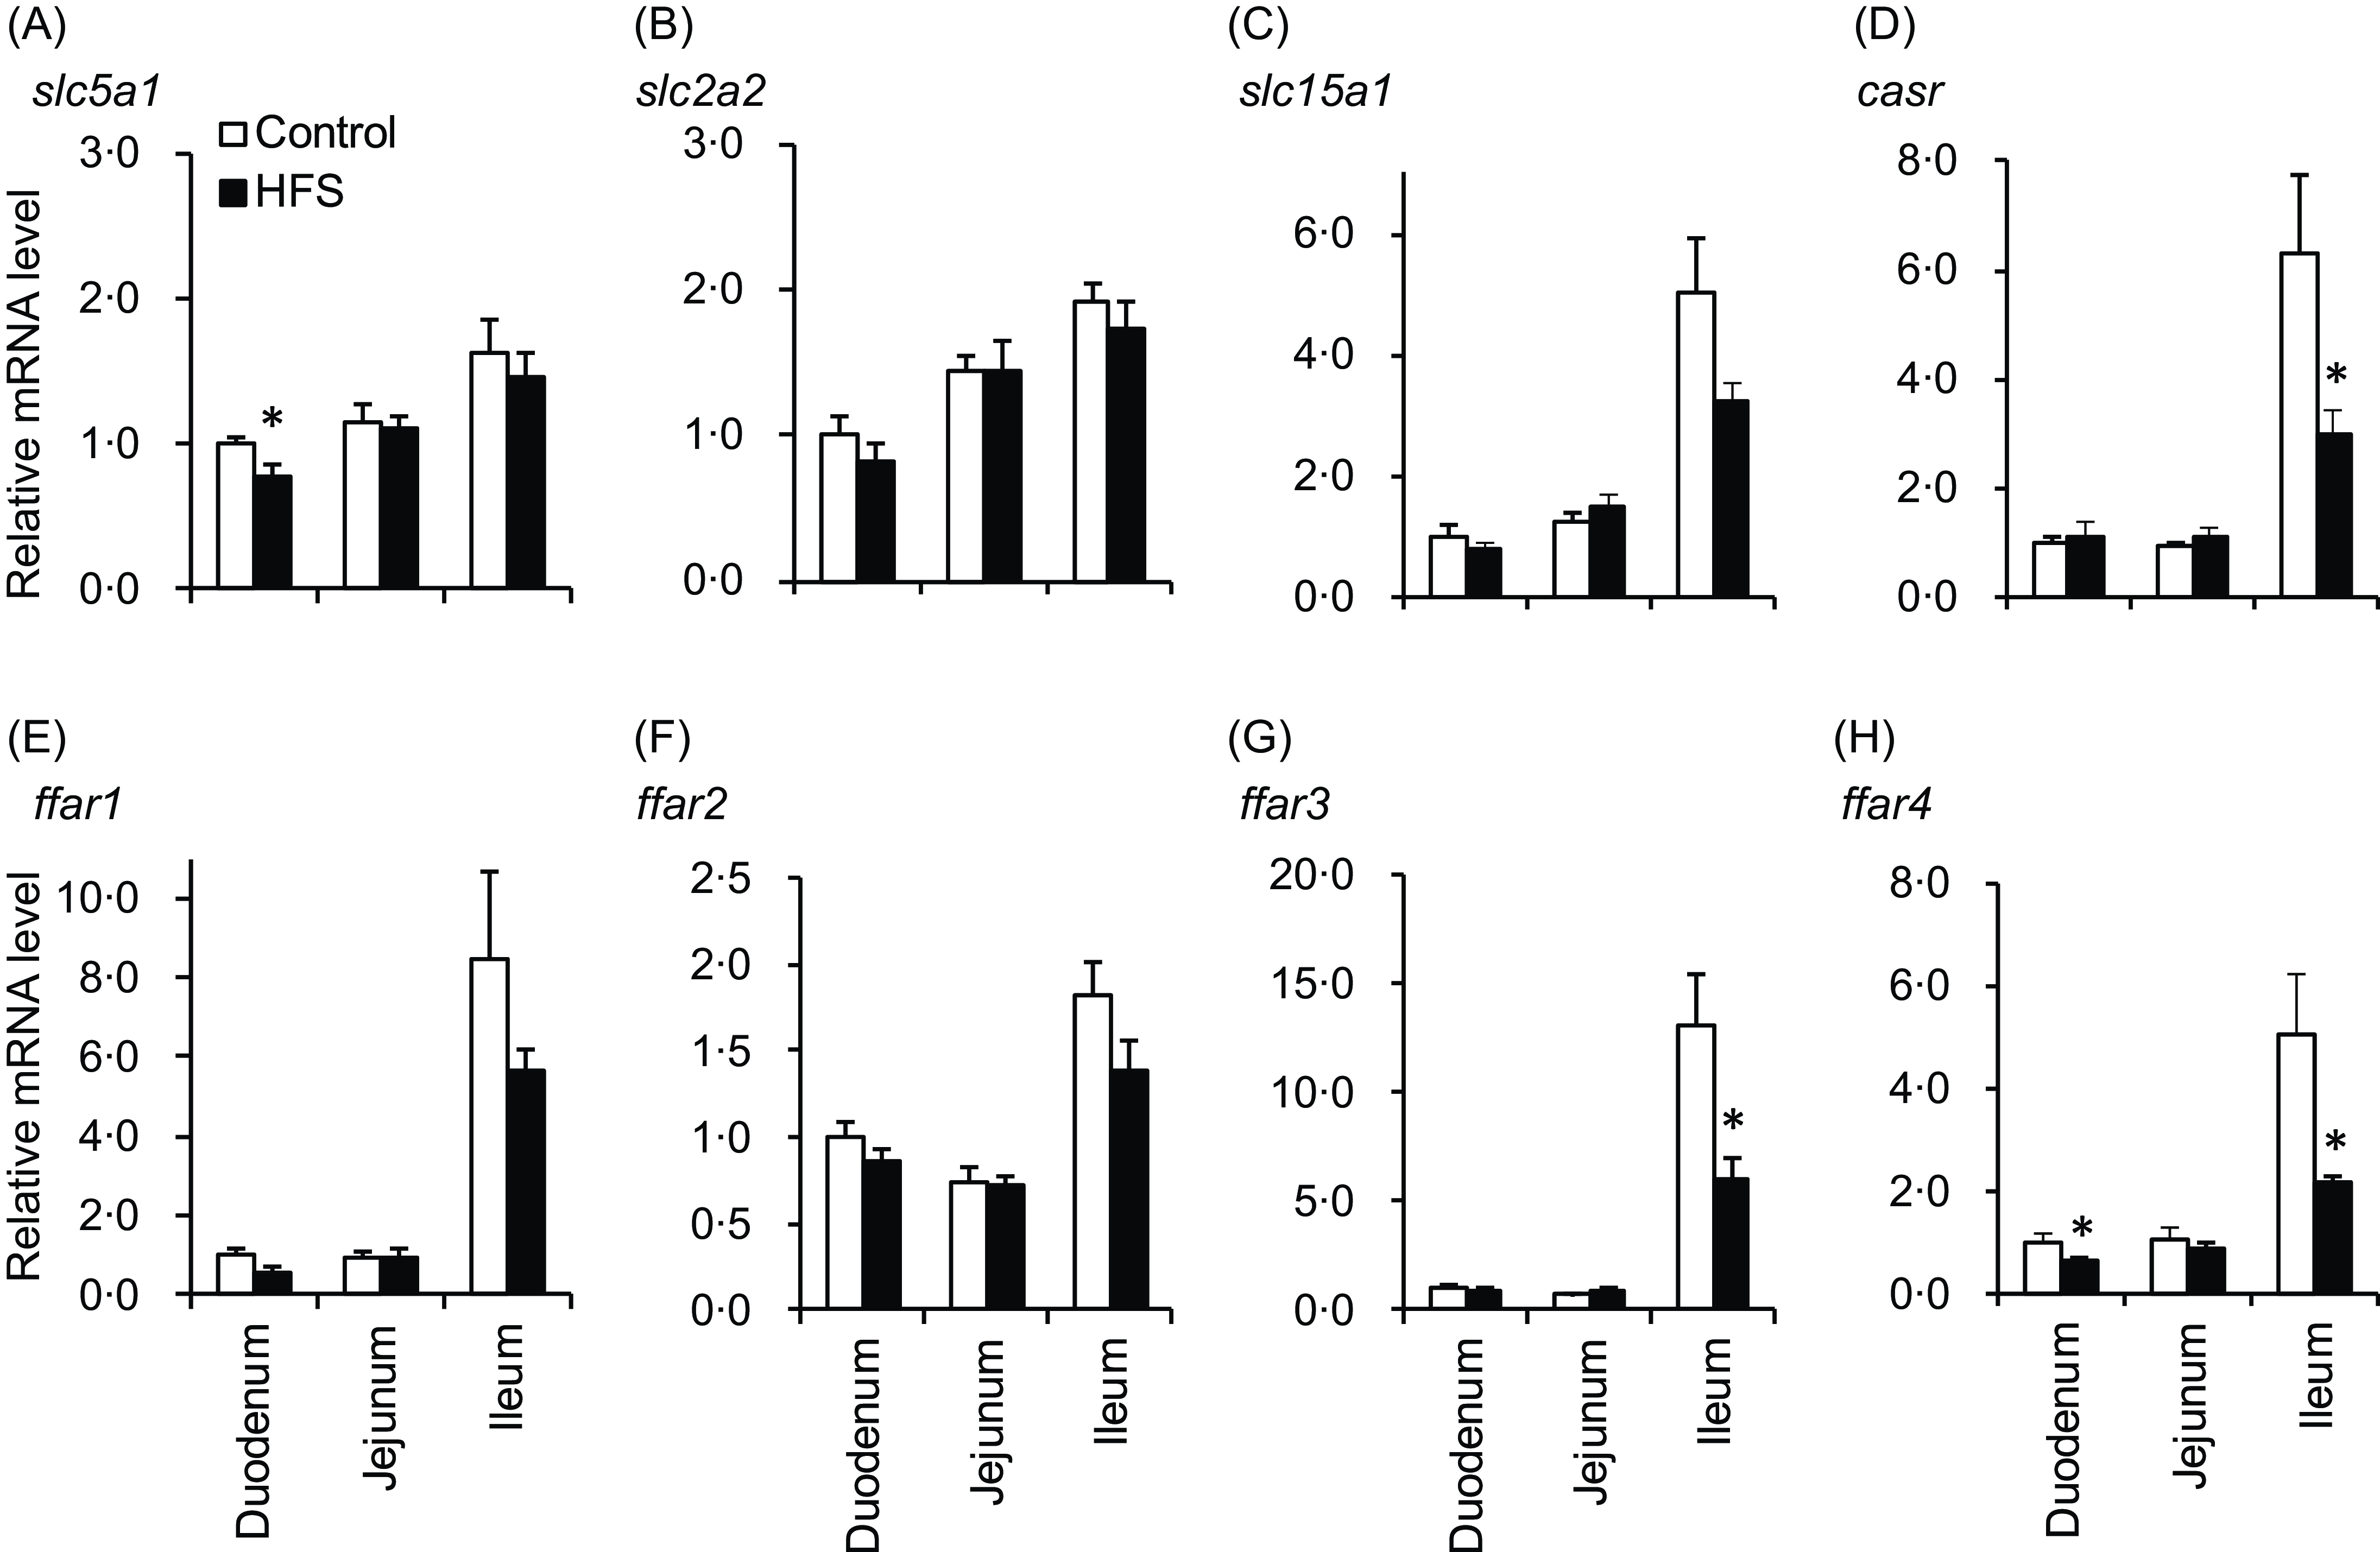
The mRNA expression of nutrient-sensing molecules in the small intestine was measured. The mRNA levels of slc5a1 (SGLT1) were lower in the duodenum of HFS-fed rats than in control rats, whereas slc2a2 (GLUT2) levels did not differ between treatments (Fig. 5(a) and (b)). Slc15a1 level (peptide transporter, Pept1) tended to be lower in the ileum of HFS-fed rats, and casr level (peptide and amin acid sensor) was significantly lower in the ileum of HFS-fed rats (Fig. 5(c) and (d)). mRNA levels of four fatty acid receptors (Fig. 5(e)–(h)) showed similar trends, and ffar3 and ffar4 levels were significantly lower in the ileum of HFS-fed rats compared with that of control rats (Fig. 5(g) and (h)).
mRNA expression levels of nutrient sensing molecules in the small intestine of control rats and rats with diet-induced obesity. Intestinal tissue samples were collected from rats fed the control or HFS diet for 5 weeks. mRNA expression levels were determined using real-time quantitative PCR (qPCR). Data are presented as the relative expression level to that of the duodenum in the control group normalised to the glyceraldehyde 3-phosphate dehydrogenase (gapdh) mRNA expression level. Values are presented as means ± sem (n 8). Asterisks (*) indicate significant differences between mean values between treatments (control v. HFS), as determined by Student’s t-test (P < 0·05). HFS, high-fat diet with sucrose solution.

Discussion
This study investigated GLP-1 response to various nutrients in control and HFS-fed rats. GLP-1 responses to the liquid diet, dextrin and soyabean oil were not diminished but were maintained or slightly increased in HFS-fed rats than in control rats. In particular, the response to whey protein was significantly higher in the HFS-fed rats. Further studies compared the role of the proximal and distal small intestines in the GLP-1 response to luminal nutrients in control and HFS-fed rats. The GLP-1 response to distal nutrient administration was greater in HFS-fed rats than in control rats. These results revealed that in rats with DIO, the GLP-1 response was maintained or enhanced regardless of the type of nutrient. Furthermore, the distal, but not the proximal, small intestine is responsible for the enhancement of the GLP-1 response.
In the present study, we used a high-fat diet and sucrose solution to induce obesogenic conditions(Reference Gil-Lozano, Wu and Martchenko29). These conditions successfully resulted in significant and reproducible BW gain and lipid accumulation in all experiments (Table 2). Notably, the excess energy intake (approx. 500–600 kcal) in HFS-fed rats compared with that in control rats was mainly attributed to energy intake from the sucrose solution, indicating that both control and HFS-fed rats had equivalent energy intake from their respective powder diets.
In Experiment 1, the GLP-1 response to the liquid diet in HFS-fed rats was higher than that in control rats (Fig. 2). Although the experimental diet was slightly different from our previous studies that employed an obesogenic diet containing high fat (30 % w/w) and high sucrose (40 % w/w)(Reference Nakajima, Hira and Hara17,Reference Pinyo, Hara and Hira22) , our results support the notion that nutrient-induced GLP-1 response is increased during the development of DIO in rat models(Reference Hira, Pinyo and Hara18). GLP-1 secretion was stimulated by macronutrients that were sufficiently included in the liquid diet (carbohydrate at 51·5 g, fat at 13·2 g and protein at 13·2 g in 250 ml of Ensure H). Further experiments were conducted to investigate whether GLP-1 response differed depending on the type of macronutrient used.
Dextrin- and soyabean oil-induced GLP-1 responses were slightly higher in HFS-fed rats than in control rats (Fig. 2(b) and (c)), whereas whey protein-induced GLP-1 response was significantly higher (Fig. 2(d)). No previous studies have compared GLP-1 responses to individual macronutrients in an obesity model. Our results indicate that the GLP-1 response is enhanced or maintained independent of the macronutrient type in DIO. The sensitivity to proteins and their digestive products may have been greater than that to carbohydrates and fats.
GLP-1 is primarily produced in the distal small intestine, and to some extent, in the proximal small intestine(Reference Svendsen, Pedersen and Albrechtsen32). As expected, the GLP-1 response to luminal nutrient load was greater after distal administration than after proximal administration in both control and HFS-fed rats (Fig. 4). We initially hypothesised that GLP-1-producing cells in the proximal small intestine may be responsible for the enhanced GLP-1 response in HFS-fed rats. However, in HFS-fed rats, the GLP-1 response was greater after distal administration but smaller after proximal administration compared to that in control rats. These results suggest that the distal small intestine, where GLP-1-producing cells are mainly localised, is responsible for the enhanced GLP-1 response in the HFS-fed rats.
In addition, basal GLP-1 concentrations were consistently higher in HFS-fed rats than in control rats, except in Experiment 2. These results suggest that HFS-fed rats exhibited higher GLP-1 production in the intestine. However, the GLP-1 content in the duodenum and jejunum was similar between treatments, while that in the ileum was lower in HFS-fed rats than in control rats (Fig. 4(a)). The density of GLP-1-producing cells, as assessed by immunohistochemistry, was also similar between the treatments (Fig. 4(b)). These results do not explain the enhanced GLP-1 secretion observed in the present study (Figs. 2 and 3).
We further analysed the length of the villi in the ileum (Fig. 4(c), (d) and (e)) and found that the GLP-1-positive villi in HFS-fed rats were longer than those in control rats. Increasing the luminal nutrient content, such as a high-fat diet, increases villi length(Reference Mao, Hu and Xiao33–Reference Stojanović, Altirriba and Rigo35). In the present study, the increase in the villi length was not statistically significant. Our experimental conditions may not have been sufficient to observe a significant increase in the ileal villus length.
A limitation of the present study is that GLP-1-negative villi do not necessarily indicate GLP-1-deficient villi. A villus was considered GLP-1-positive if GLP-1-producing cells were detected in the section of a single villus. Since GLP-1-producing cells are observed only small numbers (1–3) in a single villus ‘section,’ the GLP-1-negative villus might have contained GLP-1-producing cells if prepared by slicing from another angle.
The mRNA expression levels of various nutrient-sensing molecules did not increase in the ileum of HFS-fed rats compared with those of control rats (Fig. 5). Peptide transporter (PepT1) and CaSR are peptide and amino acid sensors, respectively, and ffar4 (GPR120) is a receptor for long-chain fatty acids that are expressed and function in GLP-1-producing cells(Reference Hjørne, Modvig and Holst4). Although GLP-1 responses were enhanced in HFS-fed rats (Fig. 2), the mRNA expression levels of these molecules decreased in the ileum of HFS-fed rats compared with those in control rats. These results do not explain the enhanced GLP-1 response observed in the HFS-fed rats.
Another limitation of the present study is that mRNA expression levels were analysed in the mucosa of intestinal tissues but not in GLP-1-producing cells. Using isolated GLP-1-producing cells of high-fat-fed mice, a previous study demonstrated decreased mRNA expression levels of slc5a1 (SGLT1), slc15a1 (PepT1) and ffar4 (GRP120) compared with those in control mice(Reference Richards, Pais and Habib12). These results seem consistent with those of the present study; however, in that study, GLP-1 responses to various nutrients were decreased in isolated GLP-1-producing cells from high-fat diet-fed mice. In another study, high-fat diet-fed mice had increased fasting plasma GLP-1 levels and GLP-1 cell density in the jejunum and colon (not investigated in the ileum)(Reference Aranias, Grosfeld and Poitou36). Glucose-induced GLP-1 secretion in the isolated perfused intestine is not impaired in mice with DIO(Reference Hunt, Holst and Jepsen14). Thus, experimental results on basal GLP-1 secretion, nutrient-induced GLP-1 secretion and intestinal GLP-1 remain controversial, even in mouse studies comparing normal and models with obesity(Reference Holst3,Reference Hira, Pinyo and Hara18) . Future studies using isolated GLP-1-producing cells from our rat model will provide valuable data to elucidate the molecular mechanisms underlying the enhanced GLP-1 response to nutrients in DIO.
Conclusion
In a rat model of DIO, GLP-1 responses to dextrin, soyabean oil and whey protein were enhanced compared with those in normal rats. These results demonstrate that the adaptive enhancement of GLP-1 secretion is responsive to all three macronutrients. Furthermore, the GLP-1 response to liquid diet administration into the lumen was enhanced in the distal small intestine of rats with DIO but not in the proximal small intestine, indicating that the distal small intestine is responsible for the adaptive enhancement of nutrient-induced GLP-1 secretion. These findings provide novel insights into the adaptive regulation of GLP-1 secretory function in DIO.
Supplementary material
For supplementary material/s referred to in this article, please visit https://doi.org/10.1017/S0007114525104066
Acknowledgements
This work was supported by JSPS KAKENHI Grant Number JP 23K23544/ 19K05860/ 16K07725.
A. S., S. T., K. Y. and T. H. were responsible for conducting the search, acquiring and analysing data, interpreting results and updating reference lists. Y. S. contributed to analysing data, interpreting results.
The authors declared no conflict of interest.