Introduction
Genus Crocuta Kaup, Reference Kaup1828, was represented by three species in the Late Pleistocene: African spotted hyena Crocuta crocuta (Erxleben, Reference Erxleben1777), which survived to the present day, and Eurasian cave hyenas, C. spelaea (Goldfuss, Reference Goldfuss1823), and C. ultima Matsumoto, Reference Matsumoto1915. Cave hyenas differ from the African species by their larger size and some features of tooth morphology, such as a wider p4 (Turner, Reference Turner1990; Hayssen and Noonan, Reference Hayssen and Noonan2021; Lewis and Werdelin, Reference Lewis and Werdelin2022). Crocuta ultima differs from C. spelaea in having more hypsodont premolars (Kurtén, Reference Kurtén1956), a broad skull, and a high mandible (Baryshnikov, Reference Baryshnikov2014), suggesting a relatively high degree of bone-cracking specialization of C. ultima dentition.
A number of researchers have considered cave hyenas as a subspecies of C. crocuta (Werdelin and Solounias, Reference Werdelin and Solounias1991; Croitor and Burlacu, Reference Croitor and Burlacu2020; Boev, Reference Boev2021; Diedrich, Reference Diedrich2021), but recent research of their morphology and paleogenome supports the designations of cave hyenas as separate species. Analysis of nuclear genome of extant and Pleistocene hyenas has shown that lineages of African and Eurasian Crocuta diverged around 2.5 Ma, followed by the divergence of C. spelaea and C. ultima at approximately 1.2 Ma (Sheng et al., Reference Sheng, Soubrier, Liu, Werdelin, Llamas, Thomson and Tuke2014; Westbury et al., Reference Westbury, Hartmann, Barlow, Preick, Ridush, Nagel and Rathgeber2020; Lewis and Werdelin, Reference Lewis and Werdelin2022).
It is thought that the behavior and ecology of cave hyenas were similar to modern spotted hyenas. They were capable of both hunting large herbivores and feeding on remains of prey of other large predators. Crocuta spelaea and C. ultima could utilize carcasses of their victims almost completely, consuming not only meat, but also viscera, skin, and bones (Kruuk, Reference Kruuk1972; Baryshnikov and Vereschagin, Reference Baryshnikov and Vereschagin1996; Jimenez et al., Reference Jimenez, Germonpré and Boudin2022). On the other hand, the relatively small anterior brain size of cave hyenas suggests that the Eurasian Late Pleistocene Crocuta were less-social animals than spotted hyenas (Vinuesa et al., Reference Vinuesa, Iurino, Madurell-Malapeira, Liu, Fortuny, Sardella and Alba2016).
Cave hyenas inhabited a vast territory spanning most of Northern Eurasia, except for regions north of 58° latitude (Baryshnikov and Vereschagin, Reference Baryshnikov and Vereschagin1996). The range of C. spelaea included Europe and a part of Asia; localities with remains of C. ultima are concentrated in East Asia, including south of the Russian Far East (Baryshnikov, Reference Baryshnikov2014; Lewis and Werdelin, Reference Lewis and Werdelin2022).
In a review of Quaternary hyenas from the former USSR, 71 localities from various regions of Russia, including the Caucasus, Urals, Altai, and Transbaikalia, are mentioned (Baryshnikov and Vereschagin, Reference Baryshnikov and Vereschagin1996). Finds of C. spelaea in caves of Crimea (Baryshnikov, Reference Baryshnikov1995; Enloe et al., Reference Enloe, David and Baryshnikov2000), from Barakaevskaya cave in the North Caucasus (Hoffecker, Baryshnikov, Reference Hoffecker and Baryshnikov1998), and from Denisova cave in Altai (Baryshnikov, Reference Baryshnikov1999) have been described. Finds of cave hyenas are also known from localities in Southern Siberia. Hyena remains are abundant in many localities in this region: partially mummified remains of a cave hyena have been found at Gorome cave (Eastern Sayan) (Tashak and Kobylkin, Reference Tashak and Kobylkin2015). Three almost complete skeletons have been found at Fanatikov cave (Khakassia) (Vasiliev and Ovodov, Reference Vasiliev and Ovodov2024), and more than 6000 hyena remains have been found at Razboinichya cave in Altai (Ovodov and Martynovich, Reference Ovodov and Martynovich2005). Despite the abundance and exceptional preservation of material from some of the Russian sites, almost no detailed studies of morphological and paleoecological features of these cave hyenas have been carried out.
Remains of C. spelaea have been found at 17 cave localities in the Urals. All caves are located in Southern Urals (Chelyabinsk Oblast and Republic of Bashkortostan) except for Pershinskaya cave in Sverdlovsk Oblast. Fossils of C. spelaea in these localities are fragmented and mainly represented by individual teeth; studies of Ural cave hyaenas were quite limited because of that fact (Baryshnikov and Vereschagin, Reference Baryshnikov and Vereschagin1996; Kuz’mina, Reference Kuz’mina2000; Kropacheva, Reference Kropacheva2003; Nikolskaia, Reference Nikolskaia2021). In 2021, a new locality with C. spelaea remains was discovered at Tip-Tugai cave. This site, which was described as a hyena den, is the first reported C. spelaea den in the Urals (Khantemirov et al., Reference Khantemirov, Kochnev, Strukova, Gimranov and Kosintsev2024). The relative abundance of remains of hyenas found at Tip-Tigai presents a unique opportunity to examine morphological and ecological features of C. spelaea from one of the least studied parts of its range.
Material and methods
Faunal and geological setting
Tip-Tugai cave was discovered in 2021 by members of the Magnitogorsk speleologist club Protei. The cave is located in the Burzyansky district of the Republic of Bashkortostan on the territory of the Bashkiria national park, 1.6 km downstream from the village of Kutanovo, on the right bank of the Belaya River, at an altitude of 365 m (52°59’28.6’’N, 57°00’22.3’’E; Fig. 1).
Geographical positions of Tip-Tugai and other Late Pleistocene sites with cave hyena remains studied in this paper. 1 = Binagadi; 2 = Tip-Tigai; 3 = Ignatievskaya; 4 = Serpievskaya I; 5 = Asha I, Pearl Grotto; 6 = Pobeda; 7 = Smelovskaya II; 8 = Syrtinskaya; 9 = Ustinovo; 10 = Ust-Katavskaya; 11 = Kualamatskya; 12 = Beidinskaya; 13 = Sikiyaz-Tamak 1 and 5; 14 = Yulaevo II, Wolf’s Den; 15 = Sukhaya; 16 = Tetyukhinskaya.

Figure 1 Long description
Two thematic maps depict Late Pleistocene sites with cave hyena remains. The first map covers Eurasia, highlighting site locations with green circles numbered 1 to 16. The map includes a scale of 2000 km and shows major geographic features like rivers and boundaries. The second map zooms into a region in Russia, specifically the southern Ural Mountains, with a scale of 100 km. It details the distribution of sites, clustered centrally with some extending eastward. The orientation is north-up. The numbers correspond to specific sites: 1 = Binagadi, 2 = Tip-Tigai, 3 = Ignatievskaya, 4 = Serpievskaya I, 5 = Asha I, Pearl Grotto, 6 = Pobeda, 7 = Smelovskaya II, 8 = Syrtinskaya, 9 = Ustinovo, 10 = Ust-Katavskaya, 11 = Kualamatskya, 12 = Beidinskaya, 13 = Sikiyaz-Tamak 1 and 5, 14 = Yulaevo II, Wolf’s Den, 15 = Sukhaya, 16 = Tetyukhinskaya. The maps provide a clear view of site distribution and geographic context.
The cave is a corridor type, length of the main passage is 83 m, average width 2.2 m, height 1.5 m, amplitude of levels between the lowest and highest points 7 m (Fig. 2). The excavation site, measuring 1.5 × 1.5 m, was located 40 m from the entrance (Fig. 2). Loose sediments are lithologically homogeneous, represented by brown loam with a thickness of ∼1 m; at a depth of 0.8–1.0 m a slight darkening of the sediments was noted. Angular calcified fragments of limestone 1–10 cm in size are present both in the sediments and on the surface of the cave. Their quantity decreases with depth.
Schematic plan of Tip-Tugai cave.

The sediments were excavated in layers of 10-cm thickness parallel to the cave surface. Sieves with 0.1 × 0.1 cm mesh size were used for screenwashing.
The remains of vertebrates in Tip-Tugai cave have different coloration. Some of the bones are weakly fossilized and have cream or light-yellow color. These bones are suspected to be of Holocene age. Most of the bones of this type were found on the surface of the cave and in the upper layers (up to 0.4 m).
Significant numbers of bones are black, brown, and dark gray in color and have a stronger degree of fossilization. Most bone remains of this type are concentrated in the middle part of excavated sediments (40–60 cm), although bones of this type are found on the cave surface too. Bones of Late Pleistocene animals, including cave hyenas C. spelaea, cave lions Panthera spelaea, and wooly mammoths Mammuthus primigenius had this type of preservation (Supplementary Table 1). The collection of animal bone remains from Tip-Tugai cave is stored in the museum of the Institute of Plant and Animal Ecology of the Ural Branch of the Russian Academy of Sciences (coll. IPAE 2400).
All fish, amphibian, reptile, and bird species found in the sediments of Tip-Tugai cave are typical for the Late Pleistocene faunas of the Southern Urals (Danukalova et al., Reference Danukalova, Kosintsev, Yakovlev, Yakovleva, Osipova, Kurmanov, van Kolfschoten and Izvarin2020) and are still present in extant Ural faunas. Species composition of the fauna of both large and small mammals (Supplementary Table 1) generally corresponds to Late Pleistocene paleofaunas of the Southern Urals (Danukalova et al., Reference Danukalova, Kosintsev, Yakovlev, Yakovleva, Osipova, Kurmanov, van Kolfschoten and Izvarin2020).
Radiocarbon age of a C. spelaea mandible (IPAE 2400/23) from Tip-Tugai is 45969 ± 1116 14C yr BP. Calibrated age (based on the Intcal20 calibration curve in the OxCal 4.4 software; Bronk Ramsey, Reference Bronk Ramsey1995; Reimer et al., Reference Reimer, Austin, Bard, Bayliss, Blackwell, Bronk Ramsey and Butzin2020) is 50,114–44,114 cal yr BP (2σ uncertainty, CCU AMS NSU-NSC, no. GV-5058, accelerator mass spectrometer MICADAS-28). This date and faunal composition of Tip-Tugai correspond to the MIS 3 isotope stage.
Morphometric and morphological analysis
Dental terminology and measurements used in this paper are presented in Figure 3. In Tables 1 and 2, the largest width of premolars P2, P3, p2, p3, and p4 is used for width values. All measurements were made with electronic caliper with 0.1 mm precision. All measurements are given in mm.
Schematic diagram of Crocuta spelaea teeth, showing dental terminology and measurements used in this paper.

Summary of pairwise comparisons using the Games–Howell test for Ural and Binagadi samples.

Table 1 Long description
Pairwise Games–Howell comparisons list which dental measurements differ significantly between Ural or Binagadi samples and several reference groups. For Ural, significant differences are reported for Goyet and for Binagadi in LP3, Lp2, Lp3, and Lm1, and for Kent’s Cavern in LP3 and Lp2. Ural also differs from Gotte de Rosee in LP3 and Lp3, and from Wookey Hole in LP3 only. No significant differences are reported for Ural versus Teufelslücke or versus C. ultima. For Binagadi, no differences are reported versus Goyet, but Lm1 differs versus Gotte de Rosee, Kent’s Cavern, and Wookey Hole. Binagadi versus Teufelslücke shows differences in Wp2, Lp3, and Lm1. The broadest set of differences for Binagadi is versus C. ultima, involving LP3, LP4, Lp3, Wp3, and Lm1. Results indicate LP3 and Lm1 are the most commonly flagged traits across comparisons, and only listed traits are significant at the stated alpha level.
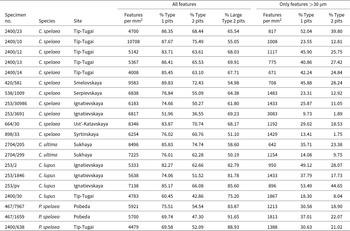
Results of microwear analysis of Crocuta spelaea, Crocuta ultima, Canis lupus, and Panthera spelaea carnassial.

Table 2 Long description
Microwear results are listed by specimen, species, and site, reporting feature density per square millimeter and pit-type percentages for all measured features and for only features larger than 30 micrometers. For all features, feature density is highest in Crocuta spelaea, ranging from about 4,008 to 10,708 per square millimeter, with the maximum at specimen 2400/10 from Tip-Tugai. Crocuta ultima shows similarly high overall densities at Sukhaya, about 7,225 to 8,496 per square millimeter. Canis lupus and Panthera spelaea have lower overall densities, roughly 4,479 to 7,138 per square millimeter, depending on specimen and site. Across all species, Type 1 pits make up a large share for all features, commonly around three quarters to nearly nine tenths, but one C. spelaea specimen from Ignatievskaya (253/3691) is notably lower at about 52 percent. Large Type 2 pit percentages vary widely, from about 50 percent up to the low 90s, with especially high values in P. spelaea from Pobeda and Tip-Tugai and in several C. lupus specimens. When only features larger than 30 micrometers are counted, feature densities drop markedly for every specimen, typically to the hundreds or low thousands per square millimeter, and Type 1 and Type 2 pit percentages also decrease. Comparisons should be made cautiously because values vary by specimen and site, and the two size filters describe different subsets of the same wear surface.
To compare size and morphology of hyena teeth from Tip-Tugai, we used literature data on C. spelaea from localities in England (Tornewton, Kent’s Cavern, Wookey Hole), France (Goyet, Grotte de Rosée), Austria (Teufelslücke) (Baryshnikov, Reference Baryshnikov2014; Lewis and Werdelin, Reference Lewis and Werdelin2022), Azerbaijan (Binagadi), Southern Urals (Smelovskaya II) (Baryshnikov and Vereschagin, Reference Baryshnikov and Vereschagin1996), several sites from Southern Siberia (Fanatikov, Proskyryakova, Denisova, Chumysh, Chik, Hyena’s Den) (Vasiliev and Ovodov, Reference Vasiliev and Ovodov2024), as well as C. ultima from Geographical Society cave in the Russian Far East (Baryshnikov, Reference Baryshnikov2014). Original data from the following localities were used (Fig. 1): C. ultima from Sukhaya (IPAE 2704) and Tetyukhinskaya (IPAE 2325) caves, Russian Far East, C. spelaea from Binagadi locality, Azerbaijan (coll. IPAE V (B) 38), and caves of the Southern Urals: Ignatievskaya (IPAE 253), Serpievskaya I (IPAE 538), Asha I (IPAE 248), Pobeda (IPAE 467), Smelovskaya II (IPAE 420), Syrtinskaya (IPAE 898), Ustinovo (IPAE 540), Ust-Katavskaya (IPAE 664), Kualamatskaya (IPAE 2154), Beidinskaya (IPAE 1113), Sikiyakh-Tamak-1 (UMNH 27), Sikiyaz-Tamak 5 (IPAE 821), Yulaevo II (IPAE 1808), Wolf’s Lair (IPAE 2344), and Pearl Grotto (IPAE 1100; IPAE 543). All hyena finds from the above localities are dated to the Late Pleistocene (Baryshnikov and Vereschagin, Reference Baryshnikov and Vereschagin1996; Kosintsev et al., Reference Kosintsev, Gasilin, Gimranov and Bachura2016; Danukalova et al., Reference Danukalova, Kosintsev, Yakovlev, Yakovleva, Osipova, Kurmanov, van Kolfschoten and Izvarin2020).
Statistical analysis was performed in PAST 4.04 (Shapiro–Wilk normality test; Hammer et al., Reference Hammer, Harper and Ryan2001) and in Rtools using rstat (Bartlett’s test for homogeneity of variance) and rstatix packages (Games–Howell post hoc test). A combined sample of Ural hyenas, including the Tip-Tugai sample was compared to C. spelaea samples from European sites and Binagadi and combined sample of C. ultima from Russian Far East sites.
Principal component analysis
Principal component analysis (PCA) was performed on log-transformed measurements of lower cheek teeth. Only mandibles with all lower cheek teeth present were used. The analysis was carried out in PAST 4.04 (Hammer et al., Reference Hammer, Harper and Ryan2001).
Microwear analysis
The following specimens were used in dental microwear analysis: four m1 (IPAE 2400/10, 2400/12, 2400/13, 2400/23) and one Dp4 (IPAE 2400/14) of C. spelaea from Tip-Tugai; m1 of C. spelaea from Ignatievskaya (IPAE 252/30986), Smelovskaya II (IPAE 420/581), Ust-Katavskaya (IPAE 664/30), and Serpievskaya I (IPAE 538/1009); two m1s of C. ultima from Sukhaya cave (IPAE 2704/205, 2704/299); three m1s of Canis lupus from Ignatievskaya cave (IPAE 253/2, 253/1846, 253/n.n.); one P4 of Ca. lupus from Tip-Tugai cave (IPAE 2400/30) and three m1s of P. spelaea from Tip-Tugai (IPAE 2400/638) and Pobeda (IPAE 467/1659, 467/7967).
One microphotograph of a paraconid and one microphotograph of a protoconid were taken from each tooth. Only one microphotograph was taken from specimens that lacked the protoconid (IPAE 2400/23, 420/581). One microphotograph from the cutting surface of the metastyle was taken from P4 of a wolf from Tip-Tugai (IPAE. 2400/30). The microphotographs were taken at ×220 magnification on an scanning electron microscope JSM-6490 LV at the CPC of the Ural Federal University. Teeth with poorly preserved enamel or taphonomic defects (features with an unusual morphology and size, or fresh features produced during the collecting process or during storage) were removed from the analysis, following King et al. (Reference King, Andrews and Boz1999).
Randomly selected areas (300 × 300 µm, Fig. 4) of microphotographs were chosen for analysis. The microwear was analyzed in the Microware 4.02 software (Ungar, Reference Ungar1995).
Schematic diagram showing stages of wear of Crocuta permanent teeth and corresponding approximate individual age.

Among the microwear features, two types of pits and scratches were distinguished following Van Valkenburgh et al., Reference Van Valkenburgh, Teaford and Walker1990. Type 1 pits were defined as features with length-to-width ratio of less than 10:1, features with higher ratio are Type 1 scratches. Type 2 pits have length-to-width ratio of less than 4:1, Type 2 scratches more than 4:1. Among Type 2 pits, large pits (length greater than 10 µm) were distinguished. Additionally, in order to directly compare our results with literature data on extant carnivores and minimize interobserver error, we used a second filtered dataset, where all features less than 30 µm in length were excluded from the analysis.
Individual age
To determine the individual ages of hyenas, degrees of tooth development and wear were used following classifications from research on spotted (Kruuk, Reference Kruuk1972) and cave (Jimenez et al., Reference Jimenez, Sanz, Daura, De Gaspar and García2019) hyenas. Four age groups were distinguished: (1) juvenile group (2- to 12-month old) included deciduous teeth and permanent teeth without formed roots; (2) subadult group (1–3 years) included permanent teeth without signs of wear or with weak level of wear with formed roots; (3) adult group (3–16 years) included permanent teeth with a medium level of wear; (4) old individuals group (aged more than 16 years) included permanent teeth with a significant level of wear (Fig. 4).
Bone modification
Taphonomic observation of large mammal bones was carried with MSP-2 stereomicroscope (Microanalysis, Russia). All 143 specimens with known genus or species were analyzed as well as 254 unidentified bone fragments of large mammals (Supplementary Table 1). We aimed to quantify the number of bone remains with modifications that are typically left by large predators such as cave hyenas (Rolfo et al., Reference Rolfo, Fiore, Gatta, Ceruleo, Di Mario, Ferracci, Petronio and Salari2025): pits, scores, furrows, crenulated edges, and acid etching (Haynes Reference Haynes1980; Delaney-Rivera et al., Reference Delaney-Rivera, Plummer, Hodgson, Forrest, Hertel and Oliver2009; Kuhn et al., Reference Kuhn, Berger and Skinner2010).
Abbreviations
IPAE = Institute of Plant and Animal Ecology, Ural Branch of Russian Academy of Sciences; UMNH = Ufa Museum of Natural History; n = sample size; lim = limits of variability; x = mean; σ = standard deviation; L = length; W = width; Ltr = trigonid length; Ltr/L - trigonid length to carnassial length ratio, in %; Lme = metastyle length.
Referred material
Skull
Skull fragment from juvenile individual (IPAE 2400/988).
Mandible
Left mandible ramus fragment from subadult individual with c1, p2, p3, p4, and m1 (IPAE 2400/23; Fig. 5A–C), right mandible ramus fragment from subadult individual with c1, p2, and p3 (IPAE 2400/24; Fig. 5D–F).
Remains of Crocuta spelaea from Tip-Tugai cave. (A–C) Left mandible fragment IPAE 2400/23; (D–F) right mandible fragment IPAE 2400/24; (G–I) p4 IPAE 2400/36. (A, D, G) Labial views; (B, E, H) median views; (C, F, I) occlusal views.

Deciduous teeth
Six deciduous incisors (IPAE 2400/717, 2400/725, 2400/755, 2400/765, 2400/766, 2400/958); left DP2 (IPAE 2400/42), right DP3 fragment (IPAE 2400/31), right DP4 (IPAE 2400/29), right Dp3 (IPAE 2400/47), and two left Dp4s (IPAE 2400/14, 2400/32).
Permanent teeth
Left I1 from juvenile individual (IPAE 2400/819), left and right C1 from one subadult individual (IPAE 2400/34, 2400/35), right C1 from adult individual (IPAE 2400/45), right P1 of juvenile individual (IPAE 2400/46), right P3 fragment from juvenile individual (IPAE 2400/26), left P4 from adult individual (IPAE2400/636), right P4 from juvenile individual (IPAE 2400/635), left P4 fragment from juvenile individual (IPAE 2400/40). Left c1 from subadult individual (IPAE 2400/27), two left c1 fragments from juvenile individuals (IPAE 2400/38, 39), right p2 from adult individual (IPAE 2400/37), left p3 from juvenile individual (IPAE 2400/25), left p3 fragment from juvenile individual (IPAE2400/26), p3 fragment from old individual (IPAE 2400/44), right p4 from juvenile individual (IPAE 2400/33), left p4 from subadult individual (IPAE 2400/36; Fig. 5G–I), left p4 from old individual (IPAE 2400/43), left p4 fragment from adult individual (IPAE 2400/637), left and right m1 from subadult individuals (IPAE 2400/10, 2400/13), and right m1 fragment from adult individual (IPAE 2400/12).
Results
Description
Mandibles
Both hemimandible fragments lack a vertical ramus and posterior part of horizontal ramus. Both hemimandibles have noticeable hyena gnaw marks (Fig. 5). Tooth row curves labially at the level of p2 and p3. Mandible measurements are presented in Supplementary Table 2.
Deciduous teeth
The upper deciduous premolar DP2 has a central conical main cusp. The cingulum surrounds the mesial and distal part of the tooth. Only the mesial part of DP3 is preserved; metacone, protocone, and distal part of the paracone have broken off. Mesial paracone crest connects to a small conical cusp located at the base of the paracone on the mesio-lingual side. There is another conical cusp at the mesial margin of the tooth. DP4 has a triangular shape. The low paracone has weak buccal, lingual, and distal crests. There is a protocone on the lingual side of the tooth, represented by a semicircular crest.
The lower deciduous premolar Dp3 has a central high conical main cusp, a mesial accessory cusp, and a distal accessory cusp. The mesial accessory cusp is shifted lingually. The cingulid surrounds the distal part of the tooth and there is a small cusp (lingual cusp in Fig. 3) on the disto-lingual part of the tooth. The paraconid and protoconid of Dp4 form two blades, like on the permanent m1. The protoconid is slightly higher than the paraconid. Talonid is well developed and separated from trigonid by enamel depression. The talonid bears three small cusps: entoconid, hypoconulid, and hypoconid.
Measurements of deciduous teeth are presented in Supplementary Table 3.
Permanent teeth
Incisors and canines of hyenas from Tip-Tugai have morphology typical of crocutoid hyenas (Baryshnikov, Reference Baryshnikov2014). Upper incisor I1 has two small diverging cusps on the inner side of the main cusp. The upper canine C1 has two crests on the mesial and distal sides of the tooth. The mesial crest forms an enamel triangle at the base of the tooth. Lower canine has lingual and distal crests. The lingual crest is noticeably stronger at the base of the crown, but no enamel triangle is present.
The P1 is a small tooth with one low central cusp and one root. P2 has one central main cusp and a distal accessory cusp. The mesial accessory cusp is reduced and represented by an enamel bump. The mesial part of the main cusp crest is shifted lingually. A cingulum surrounds the mesial and lingual portion of the tooth.
The parastyle of P4 is shorter and lower than the paracone. The metastyle has an enamel depression on the buccal side of the tooth, separating the metastyle blade into two parts. The lingual cingulum spans from the protocone to the posterior margin of the tooth. The angle between the longitudinal axis of the protocone and the longitudinal axis of P4 exceeds 90° and the mesial border of the protocone exceeds the mesial surface of the parastyle.
Lower p2 is a relatively low tooth. The distal accessory cusp is well developed, the mesial accessory cusp is reduced. The posterior part of the tooth bulges lingually. There is a lingual cingulid on one of the specimens. The tall conical p3 has a small distal accessory cusp, the mesial accessory cusp is reduced and is represented by an enamel bump. Some specimens have a cingulid running along the mesial and lingual portion of the tooth. In other specimens, the cingulid is poorly developed or absent. The p4 has a conical main cusp, a well-developed distal accessory cusp, and a small mesial accessory cusp. On one p4 the mesial accessory cusp is well developed and comparable in size to the distal accessory cusp. The posterior part of the tooth bulges lingually and a small cusp can be present on the disto-lingual part of the tooth. On one specimen, another small accessory cusp is appressed behind the distal accessory cusp. The cingulid is developed only in the posterior part of the tooth.
The m1 protoconid is shorter than the paraconid. A strongly reduced metaconid is present on all specimens. The distal crest of the protoconid is diverging into two crests near its base. Talonid is strongly reduced, with a single low hypoconid. The lingual edge of the talonid of one specimen also bears a second small cusp, which is probably a reduced entoconid. The paraconid is surrounded by a well-developed cingulid.
Measurements of permanent teeth are presented in Supplementary Table 4.
Statistical analysis
Summary statistics and results of Shapiro–Wilk normality test for all studied samples are presented in Supplementary Table 5. Results for Bartlett’s test for homogeneity of variance are presented in Supplementary Table 6. Since the variances were unequal for half of the studied variables and sample sizes were unequal, we used the Games–Howell method for multiple planned comparisons of means. The full results for this analysis are given in Supplementary Table 7; summarized results for Ural and Binagadi hyenas are presented in Table 1.
Ural hyenas have significantly longer P3s than all of the C. spelaea European sites except Teufelslücke (for Ural vs. Teufelslücke p = 0.055). The difference in length of p2 and p3 is not so uniform but still present in some of the comparisons with European samples. No significant difference between mean teeth size of Ural hyenas and C. ultima has been found. The Binagadi sample differs from all other samples except Goyet in having significantly shorter m1s.
Principal component analysis
Results of principal component analysis of p2–m1 dental measurements are presented in Figure 6. Loading and percentage of explained variance for first, second, and third principal components as well as scores for each specimen are given in Supplemental Tables 8 and 9. The first component reflected the overall dentition size and explained the largest percentage of variance. The second component, with negative loading for length and width of the second premolar, represents the relative reduction of p2.
Bivariate plots of the scores of two first principal components and their corresponding component loading plots for lower dentition of cave hyenas.

Figure 6 Long description
The scatter plot illustrates the principal component analysis of lower dentition measurements in cave hyenas. The horizontal axis represents the first principal component (PC1), explaining 65.65 percent of the variance, while the vertical axis represents the second principal component (PC2), explaining 11.93 percent of the variance. Data points are color-coded and shaped to represent different groups: C. spelaea, Europa (blue circles), C. spelaea, Ural (green squares), C. spelaea, Biryusa (orange diamonds), C. spelaea, Siberia (yellow triangles), C. ulitino, Geographical society cove (purple triangles) and C. spelaea, Tip-Tugai (red squares). The plot shows a general clustering of groups with some overlap, particularly between C. spelaea, Europa and C. spelaea, Ural. There are no distinct outliers. The inset bar graph displays loading values for dental measurements such as Lp2, Wp2, Lp3, Wp3, Lp4, Wp4, Lm1 and Wm1, indicating which measurements contribute most to PC1 and PC2. The plot reveals differences in dentition size and shape among the groups, with PC1 reflecting overall size and PC2 indicating relative reduction in certain measurements.
The specimen from Tip-Tigai lies within the morphospace of European and Ural C. spelaea and has a relatively high PC1 score. Two Ural specimens from Ust’-Katavskaya are outside the range of European specimens, with IPAE 664/30 having the highest PC1 score and IPAE 664/64 having the second highest PC2 score. One of the specimens from Geographical Society has the highest PC2 score. Siberian specimens lie within the European C. spelaea morphospace and all have a positive PC1 score. One of the Binagadi specimens has the lowest PC1 score.
Dental microwear analysis
The results of the dental microwear analysis of C. spelaea from Tip-Tugai and other Late Pleistocene predators made on the scanning electron microscope are presented in Table 2. On average, the density of features in the microwear of cave hyenas is higher than that of wolves and lions. At the same time, the density varies greatly, including in C. spelaea specimens from Tip-Tugai. The juvenile specimen IPAE 2400/23 had the lowest feature density.
The percentage of large pits in microwear is higher in Ca. lupus and P. spelaea than in C. spelaea. Four studied cave hyena carnassial specimens from Tip-Tugai have a similar ratio of microwear features, including a juvenile individual (Fig. 7).
Bivariate diagram showing percentage ratios of pits and large pits in the microwear of Crocuta spelaea, C. ultima, Canis lupus, and Panthera spelaea carnassials.

Figure 7 Long description
The scatter plot illustrates the relationship between the percentage of large Type 2 pits and Type 2 pits for different specimens. The horizontal axis represents Type 2 pits percentage, ranging from 45 to 75 percent, while the vertical axis represents large Type 2 pits percentage, ranging from 45 to 100 percent. The plot includes various symbols and colors to denote different specimens: red squares for C. spelaea from Tip-Tugai, green squares for C. spelaea from Ust-Katavskaya, yellow circles for C. spelaea from Serpievskaya, purple diamonds for C. spelaea from Smelovskaya, blue triangles for C. spelaea from Syrtinskaya, purple triangles for C. ultima from Sukhaya, black crosses for Ca. lupus and black plus signs for P. spelaea. The data points show a general clustering between 50 to 70 percent on the horizontal axis and 55 to 95 percent on the vertical axis, with no clear outliers. The plot does not indicate a strong positive or negative correlation, as the points are widely distributed across the axes. The legend effectively categorizes the specimens by color and symbol, aiding in the identification of each group.
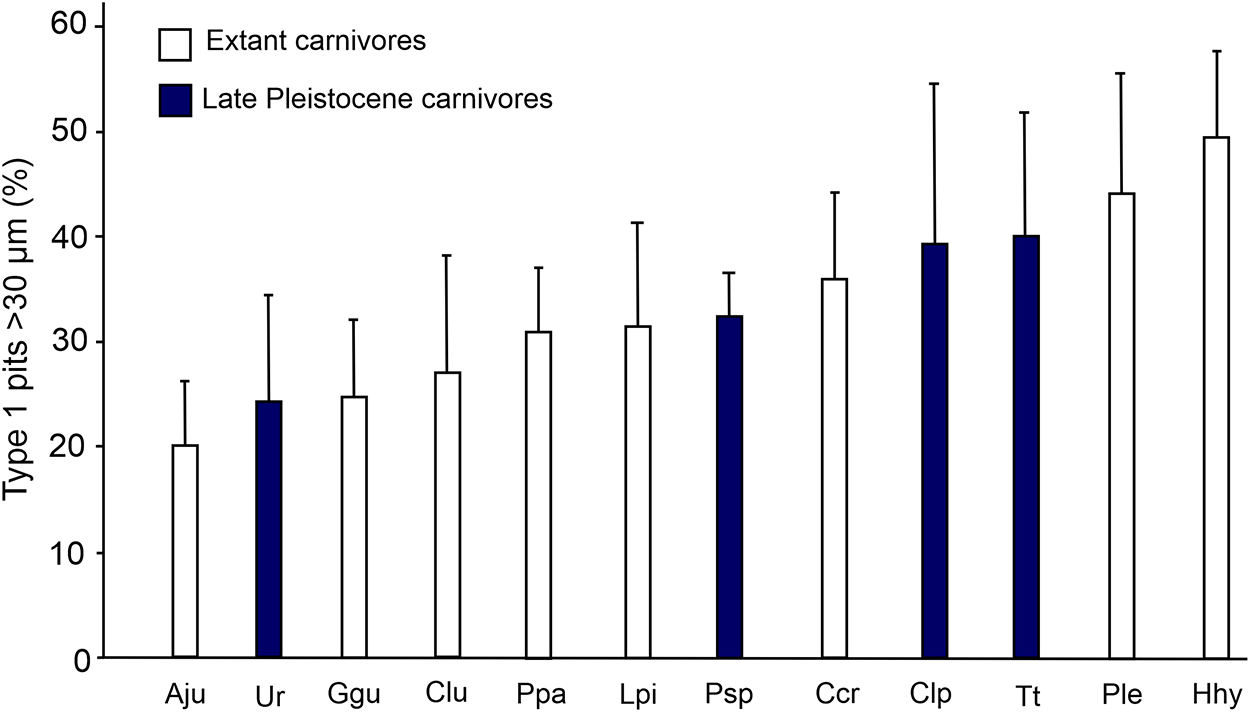
Results of pit frequency comparison between studied Late Pleistocene carnivores with extant carnivores based on a filtered dataset are shown in Figure 8. The average pit frequency of C. spelaea specimen from Tip-Tugai is close to extant C. crocuta. Specimen IPAE 2400/23 had the highest ratio (52 %), close to the mean value of Hyaena hyaena. Canis lupus from Tip-Tugai and Ignatievskaya had higher pit frequency than extant wolves. Studied Late Pleistocene lions had somewhat lower pit frequency than extant P. leo. Crocuta spelaea from other Ural sites had lower ratios than extant spotted hyenas and cave hyenas from Tip-Tugai.
Bar plots of mean relative frequency (<1:10 ratio) of Type 1 pits for extant carnivores (data from Van Valkenburgh et al., Reference Van Valkenburgh, Teaford and Walker1990) and extinct lions, wolves, and hyenas from Late Pleistocene sites based only on features longer than 30 µm. Error bars represent 95% confidence intervals. Aju = Acionyx jubatus (n = 10); Ur = C. spelaea, Ural (n = 4); Ggu = Gulo gulo (n = 10); Clu = Canis lupus (n = 10); Ppa = P. pardus (n = 10); Lpi = Lycaon pictus (n = 10); Psp = Panthera spelaea, Tip-Tugai and Pobeda (n = 3); Ccr = C. crocuta (n = 10); Clp = Ca. lupus, Tip-Tugai, Ignatievskaya (n = 4); Tt = C. spelaea, Tip-Tugai (n = 4); Ple = P. leo (n = 10); Hhy = Hyaena hyaena (n = 10). Data on extant carnivores from Van Valkenburgh et al., Reference Van Valkenburgh, Teaford and Walker1990.

Comparison and discussion
Morphology and teeth size
The morphology of deciduous teeth of C. spelaea from Tip-Tugai is generally typical for Crocuta. There are three weakly developed cusps on the Dp4 talonid. The same condition is observed in many specimens from other localities of the Southern Urals. On Dp4 specimens of C. ultima from the Geographical Society cave, cusps on the talonid are either absent or extremely reduced. The Dp4 talonid cusps are also absent in one specimen from Ignatievskaya cave.
The only Dp3 of C. spelaea from Tip-Tugai has a relatively large dimension. The ratio of trigonid length to the total length of Dp4s of hyenas from Tip-Tugai is close to the values for other Ural and European C. spelaea. Two specimens of Dp4s of hyenas from Tip-Tugai have a relatively longer trigonid (i.e., the talonid is more reduced; Table 3).
Measurements of lower deciduous teeth of C. spelaea and C. ultima.

Table 3 Long description
Lower deciduous tooth measurements are listed for two taxa across several localities, reporting sample size and observed ranges for Dp3 length and width, plus Dp4 length, trigonid length, trigonid-to-total length ratio, and width. C. spelaea from Tip-Tigai has single Dp3 values (length 14.8, width 6.7) and Dp4 ranges from 18.7 to 19.7 in length with widths from 6.7 to 7.4. C. spelaea from the Urals has the largest sample for Dp3 (11 to 12 specimens) with Dp3 length ranging 13.4 to 15.2 and width 6.2 to 7.8; mean values are 14.07 for length and 6.93 for width. For the Urals Dp4, length ranges 19.5 to 20.2 with a mean of 19.87, trigonid length ranges 15.4 to 16.0 with a mean of 15.70, the trigonid-to-total ratio ranges 77.7 to 80.4 with a mean of 79.03, and width ranges 6.3 to 7.4 with a mean of 6.77. C. spelaea from Tornewton shows smaller mean Dp3 length (13.56) and width (6.60) than the Urals, while Dp4 is slightly longer on average (mean length 20.37) and notably wider (mean width 7.84), with Dp4 length spanning 19.1 to 21.9 and width spanning 7.2 to 8.8. C. ultima from the Russian Far East is based on two specimens and overlaps strongly with C. spelaea, with Dp3 length 13.0 to 14.2 and Dp4 length 18.8 to 21.8, and relatively wide Dp4 values from 7.8 to 8.5. Comparisons should be treated cautiously because some groups have very small sample sizes and some entries provide only ranges without means.
All three studied complete m1 specimens from Tip-Tugai had a small metaconid. In the evolution of genus Crocuta, there is a tendency for the m1 metaconid to be reduced (Lewis and Werdelin, Reference Lewis and Werdelin2022), but some individuals of cave hyenas retain this cusp. The frequency of occurrence of the metaconid in European C. spelaea ranges from 22 to 55% (Kurtén, Reference Kurtén1956). For C. ultima from the Russian Far East the frequency is 24% (Baryshnikov, Reference Baryshnikov2014). Metaconids are present in 29% of cave hyena m1 specimens from Ural sites (excluding Tip-Tugai). The presence of a metaconid on all examined specimens from Tip-Tugai can be explained by a small sample size.
The mandible size of C. spelaea from Tip-Tugai is close to European hyenas and does not reach the size of the mandible from Ust-Katavskaya (Table 4). The large mandible from Ust-Katavskaya evidently belonged to an exceptionally large individual.
Mandible measurements of Crocuta spelaea and Crocuta ultima.

Table 4 Long description
Mandible measurements in millimeters are summarized for Crocuta spelaea from four localities and Crocuta ultima from one locality, reporting sample size plus ranges and, where available, mean values. Measures include height before the second premolar, canine to first molar length, second premolar to first molar length, and second premolar to fourth premolar length. Crocuta ultima from Geographical Society cave has height before the second premolar ranging from 42.5 to 47.4 with a mean of 45.20, higher than Crocuta spelaea ranges that run from 37.1 to 45.2 across sites. For canine to first molar length, Crocuta ultima lists two values, 117.4 and 120.0, exceeding Crocuta spelaea ranges such as 105.3 to 115.8 at Binagadi and 109.8 to 113.5 at Tornewton. For second premolar to first molar length, Crocuta ultima ranges from 91.2 to 98.3 with a mean of 93.83, compared with Crocuta spelaea means near 89.00 at Tornewton and 86.97 at Binagadi. For second premolar to fourth premolar length, Crocuta ultima ranges from 59.7 to 61.6 with a mean of 60.65, overlapping Crocuta spelaea means around 59.47 at Tornewton and 59.73 at Binagadi, and within the broader Crocuta spelaea ranges. Some cells are missing, including canine to first molar length for the Ust-Katavskaya sample and the mean for Crocuta ultima canine to first molar length, and several groups have very small sample sizes, so comparisons should be treated as indicative rather than definitive.
In terms of tooth size, hyenas from Tip-Tugai differ from other Ural hyenas in having somewhat shorter p3s and larger p4s (Table 5). One of the p4 specimens of C. spelaea from Tip-Tugai exceeds all p4 specimens used for comparison in length (Fig. 9).
Bivariate diagrams showing size distribution of (A) P2, (B) P4, (C) p4, and (D) m1 of cave hyenas.

Figure 9 Long description
Four scatter plots labeled A, B, C and D display bivariate size distributions of cave hyena teeth. Each plot uses the same five category groups shown in the legend: C. spelaea from Tip-Tugai, C. spelaea from Europe, C. spelaea from Ural, C. ultima from Russian Far East and C. spelaea from Binagadi. Plot A has LP2 on the horizontal axis and Wp2 on the vertical axis. The horizontal axis extends from approximately 16 to 21 and the vertical axis from approximately 11 to 16. Data points for C. spelaea from Europe form the densest cluster in this panel. C. spelaea from Tip-Tugai plots at the higher end of the length range. C. ultima from Russian Far East and C. spelaea from Ural occupy a mid-range position. C. spelaea from Binagadi tends toward the lower end of both axes. Plot B has LP3 on the horizontal axis and Wp3 on the vertical axis. The horizontal axis extends from approximately 39 to 45 and the vertical axis from approximately 16 to 24. C. spelaea from Europe again forms the largest and densest grouping. C. spelaea from Tip-Tugai and Ural are positioned toward the higher length values. C. spelaea from Binagadi plots at the lower end of both axes. C. ultima from Russian Far East overlaps with the Ural group. Plot C has Lp4 on the horizontal axis and Wp4 on the vertical axis. The horizontal axis extends from approximately 22 to 27 and the vertical axis from approximately 13 to 17. C. spelaea from Europe forms the densest cluster at mid-range values. C. spelaea from Tip-Tugai extends toward the higher length end and represents a notable outlier group in length. C. spelaea from Binagadi remains at the lower end of both axes. C. ultima from Russian Far East and C. spelaea from Ural are positioned near the mid-range. Plot D has Lm1 on the horizontal axis and Wm1 on the vertical axis. The horizontal axis extends from approximately 29 to 38 and the vertical axis from approximately 12 to 17. C. spelaea from Europe forms the broadest and densest scatter. C. spelaea from Tip-Tugai plots at the higher end of the length axis. C. spelaea from Binagadi plots at the lower end of both axes. C. ultima from Russian Far East and C. spelaea from Ural occupy mid-range positions. Across all four panels, width tends to increase with length and C. spelaea from Binagadi consistently occupies the lower size range while C. spelaea from Tip-Tugai and Ural tend toward larger values.
Measurements of lower teeth of C. spelaea and C. ultima.

Table 5 Long description
Lower-tooth measurements are summarized for p2, p3, p4, and m1, reporting sample size, observed range, and mean values for length and width (m1 also includes trigonid length). C. spelaea is listed for Tip-Tigai, Urals, Western Europe, Binagadi (Azerbaijan), and Siberia, and C. ultima for the Russian Far East. Mean p4 length is similar across groups, about 23 to 25, with Western Europe near 24.27 and C. ultima near 24.56. Mean m1 length also overlaps strongly, about 30 to 34, with Western Europe near 32.53, Urals near 33.51, Tip-Tigai near 33.90, Siberia near 32.70, and C. ultima near 33.28. Western Europe shows the largest sample sizes (hundreds) and broad ranges, while Tip-Tigai and C. ultima have smaller samples and narrower coverage. Siberia lacks m1 trigonid length values, so comparisons for that specific measure cannot be made for that region. Overall, the ranges for most measures overlap widely among regions and between species, suggesting limited separation based on these tooth dimensions alone.
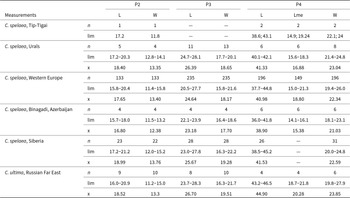
Statistical analysis showed that Ural hyenas (combined in one sample, including Tip-Tugai) have significantly longer p2s, p3s, and P3s than some of the European hyenas (Tables 2, 4, 5), which could mean that the dentition of Ural C. spelaea was relatively more adapted to bone-crushing. A similar evolutionary trend was noted for C. ultima (Baryshnikov, Reference Baryshnikov2014). It is worth noting that C. spelaea from Siberian localities also seemingly have large P3s (Table 6), but the published data did not allow us to use this sample in the analysis. Short lower carnassials of C. spelaea from Binagadi are also a noteworthy example of geographical variation of cave hyenas.
Measurements of upper teeth of C. spelaea and C. ultima.

Table 6 Long description
Upper tooth measurements are summarized for P2, P3, and P4, reporting sample size, observed range, and mean for length and width; P4 also includes a middle length measure and width. C. spelaea shows wide geographic sampling, especially Western Europe, with large sample sizes for P2 and P3 and slightly smaller counts for P4 measures. Mean P2 length in C. spelaea ranges from about 16.80 in Binagadi to 18.99 in Siberia, with Western Europe averaging 17.65; P2 width means cluster near 12.4 to 13.8. Mean P3 length in C. spelaea is about 23.18 in Binagadi, 24.64 in Western Europe, and 25.67 in Siberia, with corresponding mean widths around 17.7 to 19.3. For P4 in C. spelaea, mean length is about 38.90 in Binagadi and about 41.0 to 41.5 in Western Europe, Urals, and Siberia; mean P4 width is roughly 21.0 to 23.0. C. ultima from the Russian Far East has higher P4 values than C. spelaea, with mean P4 length 44.90 and mean middle length 20.28, while its P2 and P3 means are similar to the higher end of C. spelaea ranges. Some cells are missing, including P3 values for the Tip-Tigai sample and the P4 middle length for Siberia, so comparisons for those measures are incomplete.
Results of principal component analysis also show a trend for larger overall dentition size of Ural hyenas relative to the European C. spelaea, as represented by a high PC1 score in all specimens, with a large specimen from Ust’-Katavskaya having the highest score out of all specimens (Fig. 6). The other specimen from Ust’-Katavskaya has a high PC2 score, suggesting a possible trend of relative reduction of p2s and therefore increasing hypercarnivorous adaptation.
Sexual dimorphism
Females of modern spotted hyenas are on average larger than males in body size, with little or no dimorphism in skull size (McElhinny, Reference McElhinny2009; Vinuesa, Reference Vinuesa2018). It has been reported that females also have longer m1s on average (Gittleman and Van Valkenburgh, Reference Gittleman and Van Valkenburgh1997), although other authors did not find signs of sexual dimorphism in C. crocuta teeth size (Lewis and Werdelin, Reference Lewis and Werdelin2022). The degree to which spotted hyenas exhibit sexual dimorphism also varies among different populations (Hayssen and Noonan, Reference Hayssen and Noonan2021).
We found no credible evidence of sexual dimorphism in cave hyena tooth size while analyzing our dataset. It is possible that sexual dimorphism in cave hyenas was weak relative to other large carnivores, like in modern spotted hyenas (McElhinny, Reference McElhinny2009). Therefore, sexual size dimorphism could have been obscured by chronological and individual variation. Nevertheless, we think that the large size of the three m1s of C. spelaea from Tip-Tugai could be explained if these teeth belonged to females.
Cave hyena diet
Dental microwear parameters
All the studied cave hyenas clearly differentiate from Late Pleistocene lions and wolves by having lower ratios of large Type 2 pits (Fig. 7). This observation correlates with the results of other research, where it was shown that microwear features in the spotted hyena C. crocuta are on average shorter and narrower than in Ca. lupus and P. leo (Van Valkenburgh et al., Reference Van Valkenburgh, Teaford and Walker1990), and that the microwear of cave hyenas is dominated by small pits (Rivals et al., Reference Rivals, Baryshnikov, Prilepskaya and Belyaev2022).
Four studied cave hyena carnassial specimens from Tip-Tugai have similar ratios of Type 2 pits and large Type 2 pits (Fig. 7). This phenomenon is particularly interesting because one of these specimens is a deciduous carnassial Dp4 (IPAE 2400/14). The pit ratio of this specimen is the closest to the ratio of specimen IPAE 2400/12, which belonged to an adult individual. The Dp4 IPAE 2400/14 has a significant level of wear consistent with an individual age of ∼12 months, which shows that this hyena cub had already transitioned to an adult diet containing bone and meat. This agrees with data on spotted hyenas, whose cubs are already actively eating meat and can consume bones at the age of 12 months (Kruuk, Reference Kruuk1972). Study of microwear features of m1s and Dp4s of hyenas from Bukhtarminskaya, Prolom 2 and Geographic Society caves also showed similarity of microwear of juvenile and adult individuals (Rivals et al., Reference Rivals, Baryshnikov, Prilepskaya and Belyaev2022).
Using the filtered dataset with features <30µm excluded allowed us to directly compare Type 1 pit frequency in microwear of studied specimens with extant carnivores (Fig. 8). The average pit frequency of C. spelaea specimens from Tip-Tugai is close to extant spotted hyenas, indicating that bones were a significant part of Tip-Tugai hyenas’ diet. On the other hand, C. spelaea from other Ural sites have relatively low pit frequency but small sample sizes limit the interpretability of these results.
It is important to note that pit frequency and other microwear parameters do not directly correlate with the ratio of hard and soft foods in carnivore diets. All terrestrial meat-eating carnivores encounter bone or grit in their diet occasionally. Hard substances inflict grater damage on enamel than meat, so even a small amount of crushed bone could have a marked effect. Also, some carnivores, for example H. hyaena, sometimes feed on hard fruit, which can have a similar effect on the enamel as consuming bone (Van Valkenburgh et al., Reference Van Valkenburgh, Teaford and Walker1990).
Another factor that could influence the diet of cave hyenas, and therefore their teeth microwear, could be the hierarchical position of individuals. Among modern C. crocuta, females often have a larger proportion of meat in their diet compared to males (Kruuk, Reference Kruuk1972). All m1 specimens of C. spelaea from Tip-Tugai are large in size and could have belonged to females. Three of them have similar Type 2 pit and large Type 2 pit ratios. The carnassial of a hyena from Ust-Katavskaya, also probably belonging to a large female, is close in microwear feature ratio to these specimens from Tip-Tugai, perhaps due to similar hierarchical position of these individuals in their clans (Fig. 8). In spotted hyena clans, hyena cubs “inherit” the hierarchical position of their mothers (Kruuk, Reference Kruuk1972), which can also explain the similarity of the Dp4 microwear of one-year-old cubs to that of an adult animal. At the same time, the other large m1 specimen of Tip-Tugai hyena had a markedly different ratio of large pits. A large-scale study of Late Pleistocene Crocuta teeth microwear and their sexual dimorphism is required to confirm or deny these findings.
Taphonomic features
Analysis of bone modification showed that 50% of all studied large herbivore bones have gnaw marks consistent with modifications left by hyenas. Additionally, two horse teeth had signs of acid etching. While the possibility of other large carnivores playing a role in forming the faunal assemblage of Tip-Tugai cave cannot be ruled out, we think that most of the large herbivore remains ended up in the cave as a result of cave hyena hunting and scavenging.
Therefore, composition of the large herbivore fauna of Tip-Tugai can partially reflect the diet of hyenas that lived there. Most of the found limb bones of bison Bison priscus (66.6%), giant deer Megaloceros gigantaeus (100%), woolly rhinoceros Coelodonta antiquitatis (71.4%), and camel Camelus sp. (100%) bear hyena teeth marks (Fig. 10). The remains of mammoths and horses do not bear noticeable carnivore teeth marks, but they are likely to have been brought to the cave by hyenas too. Bones of these herbivores are often found at other cave hyena dens (Diedrich, Reference Diedrich2012b). The exception is the camel, an animal that is rarely found among Late Pleistocene faunas of the Southern Urals (Kosintsev and Bachura, Reference Kosintsev and Bachura2013).
Herbivore bones with Crocuta spelaea teeth marks from Tip-Tugai cave. (A) Camelus sp. metapodia IPAE 2400/3; (B, D) Megaloceros giganteus metapodiae IPAE 2400/791 and IPAE 2400/794; (C, E) long bones of undetermined species IPAE 2400/978 and IPAE 2400/980; (F) Coelodonta antiquitatis talus IPAE 2400/809.

Bone fragments with gnaw marks of hyena cubs were also found at the cave (Fig. 10B, C, E). These bone fragments are called nibbling sticks. They were used by the cubs as “toys” that they nibbled on, imitating the behavior of adults (Diedrich, Reference Diedrich2012a; Rivals et al., Reference Rivals, Baryshnikov, Prilepskaya and Belyaev2022). It is possible that the similarity of Dp4 microwear with m1 microwear of C. spelaea from Tip-Tugai described above is related to this cub activity.
An important question for understanding behavior and diet of cave hyenas is whether the bones of herbivores found at the den were obtained as a result of active hunting. Modern spotted hyenas often hunt wildebeests Connochates sp., zebras Equus sp., and herbivores of smaller size. Sometimes they hunt adult African buffalos Syncerus caffer. In rare cases spotted hyenas can hunt elephants and rhinoceroses, but only juvenile individuals if they are not under parental protection (Kruuk, Reference Kruuk1972). It can be assumed that cave hyenas could have hunted Pleistocene horses, deer, and bison, given that C. spelaea and C. ultima were larger than modern C. crocuta. They may also have taken carcasses of these animals from other predators and fed on carrion, including carcasses of woolly rhinoceroses and mammoths.
It is also worth noting that the remains of large herbivores found at a hyena den do not fully reflect the dietary preferences of ancient hyenas. In modern spotted hyenas, at certain times of the year, the bulk of their diet consists of herbivore cubs, of which almost no bones are left (Kruuk, Reference Kruuk1972). Denser bones of large herbivores are much more likely to be preserved in hyena dens, so the quantitative composition of the remains of large herbivores does not fully reflect food preferences of extinct hyenas (Katsagoni et al., Reference Katsagoni, Konidaris, Giusti, Harvati and Kostopoulos2022).
Conclusion
Cave hyenas from Tip-Tugai are similar to other Ural hyenas in morphology and tooth size. All m1s of Tip-Tugai hyenas are relatively large, which can be explained by sexual dimorphism of cave hyenas. Crocuta spelaea from Tip-Tugai also differ from all other hyenas used for comparison in having an exceptionally large p4.
Comparison of the teeth dimensions of Ural C. spelaea (including Tip-Tugai specimens) with European C. spelaea from different sites showed that Ural cave hyenas have significantly longer P3s than most of the European samples, and p2s and p3s that are significantly longer than two out of five European samples. This fact suggests a higher degree of bone-cracking specialization in dentition of Ural hyenas. Principal component analysis also showed that Ural hyenas tend to have an overall larger lower dentition than European C. spelaea and, in the case of one specimen, more reduced p2.
Analysis of carnassial microwear of C. spelaea from Tip-Tugai indicated that adult hyenas and a juvenile individual had a significant amount bone in their diet. The results of microwear analysis also suggest that the hierarchical position of individuals could be a factor that influenced cave hyena diet and therefore teeth microwear, but further studies are needed to confirm this notion.
A large number of herbivore bone fragments with traces of teeth of both adult hyenas and cubs were found in Tip-Tugai cave. Cave hyenas had a significant influence on the formation of the Tip-Tugai cave taphocenosis by bringing parts of carcasses of large herbivores into the cave. The bones with traces of hyena teeth indicate that the diet of C. spelaea from Tip-Tugai included giant deer, bison, horses, camels, woolly rhinoceroses, and mammoths.
These results show the potential of multiproxy studies of sites with C. spelaea remains for understanding morphological and ecological diversity of this species, especially for the less-studied parts of its range.
Supplementary material
The supplementary material for this article can be found at https://doi.org/10.1017/qua.2026.10104.
Acknowledgment
The authors thank two anonymous reviewers for their constructive comments and suggestions, which greatly improved the manuscript.
Disclosure statement
The authors declare that they have no known competing financial interests or personal relationships that could have appeared to influence the work reported in this paper.