Introduction
The US Fish and Wildlife Service (USFWS) classified the risk of extinction of the Puerto Rico subspecies of the Plain Pigeon Patagioenas inornata wetmorei as endangered in 1970 (USFWS 1982). The Plain Pigeon most likely became endangered in the early 1900s because of widespread deforestation from agriculture, unsuccessful reproduction from nest predation in remaining forest fragments, unsustainable hunting pressure, and the direct hit of hurricanes San Ciriaco (Saffir–Simpson Hurricane Wind Scale, category 4) in 1899, San Felipe (category 5) in 1928, and San Ciprian (category 4) in 1932 (Koenig Reference Koenig1953; Miyamoto et al. Reference Miyamoto, Allard and Moreno1994; USFWS 1982; Wetmore Reference Wetmore1916; Wiley Reference Wiley and Temple1985). For additional information about the impacts of these hurricanes, refer to Boose et al. (Reference Boose, Serrano and Foster2004). The direct hit of very intense hurricanes (category 4−5) can cause severe population declines and increase the risk of extirpation or extinction of Caribbean birds with restricted distributions and small population sizes (Beissinger et al. Reference Beissinger, Wunderle, Meyers, Sæther and Engen2008; Rivera-Milán et al. Reference Rivera-Milán, Bertuol, Simal and Rusk2015, Reference Rivera-Milán, Madden and Verdel2021, Reference Rivera-Milán, Martínez, Matos, Guzmán, Ruiz-Lebrón and Ventosa-Febles2022, Reference Rivera-Milán, Gerbracht and Simal2025).
Owing to climate change, the frequency of very intense hurricanes is expected to increase in the Caribbean region (Knutson et al. Reference Knutson, Camargo, Chan, Emanuel, Ho and Kossin2020). Since we started monitoring the columbid game and non-game species of Puerto Rico in April–June 1986 (Rivera-Milán et al. Reference Rivera-Milán, Boomer and Martínez2014, Reference Rivera-Milán, Boomer and Martínez2016, Reference Rivera-Milán, Martínez, Matos, Guzmán, Ruiz-Lebrón and Ventosa-Febles2022), three hurricanes have made landfall: Hugo (category 3) in September 1989, Georges (category 3) in September 1998, and Maria (category 4) in September 2017. Hurricane Irma (category 5) passed about 100 km off the north-east coast of the island on 6 September 2017 (Cangialosi et al. Reference Cangialosi, Latto and Berg2021), and 11 days later Hurricane Maria entered from the south-east and exited in the north-west (Pasch et al. Reference Pasch, Penny and Berg2023). Irma was a very intense hurricane that mostly affected the north-eastern corner of the island (Cangialosi et al. Reference Cangialosi, Latto and Berg2021). However, Maria has been the most devastating hurricane to make landfall since Hurricane San Ciriaco in 1899−1932 (Boose et al. Reference Boose, Serrano and Foster2004; Hall et al. Reference Hall, Muscarella, Quebberman, Arellano, Thompson and Zimmerman2020; Uriarte et al. Reference Uriarte, Thompson and Zimmerman2019), with as much as 500 mm of rainfall in 24 hours and winds up to 250 km/hour (Pasch et al. Reference Pasch, Penny and Berg2023).
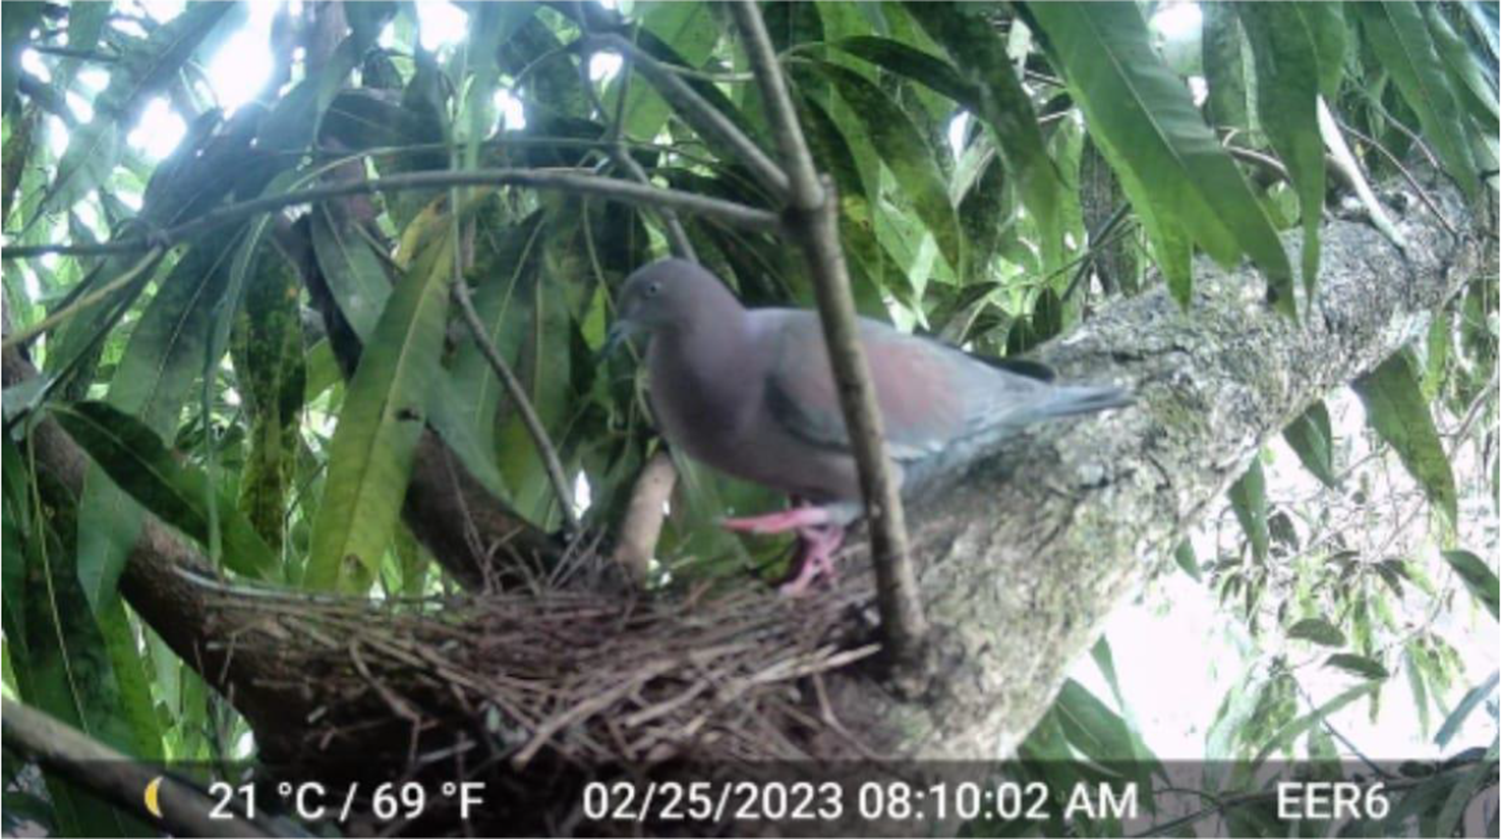
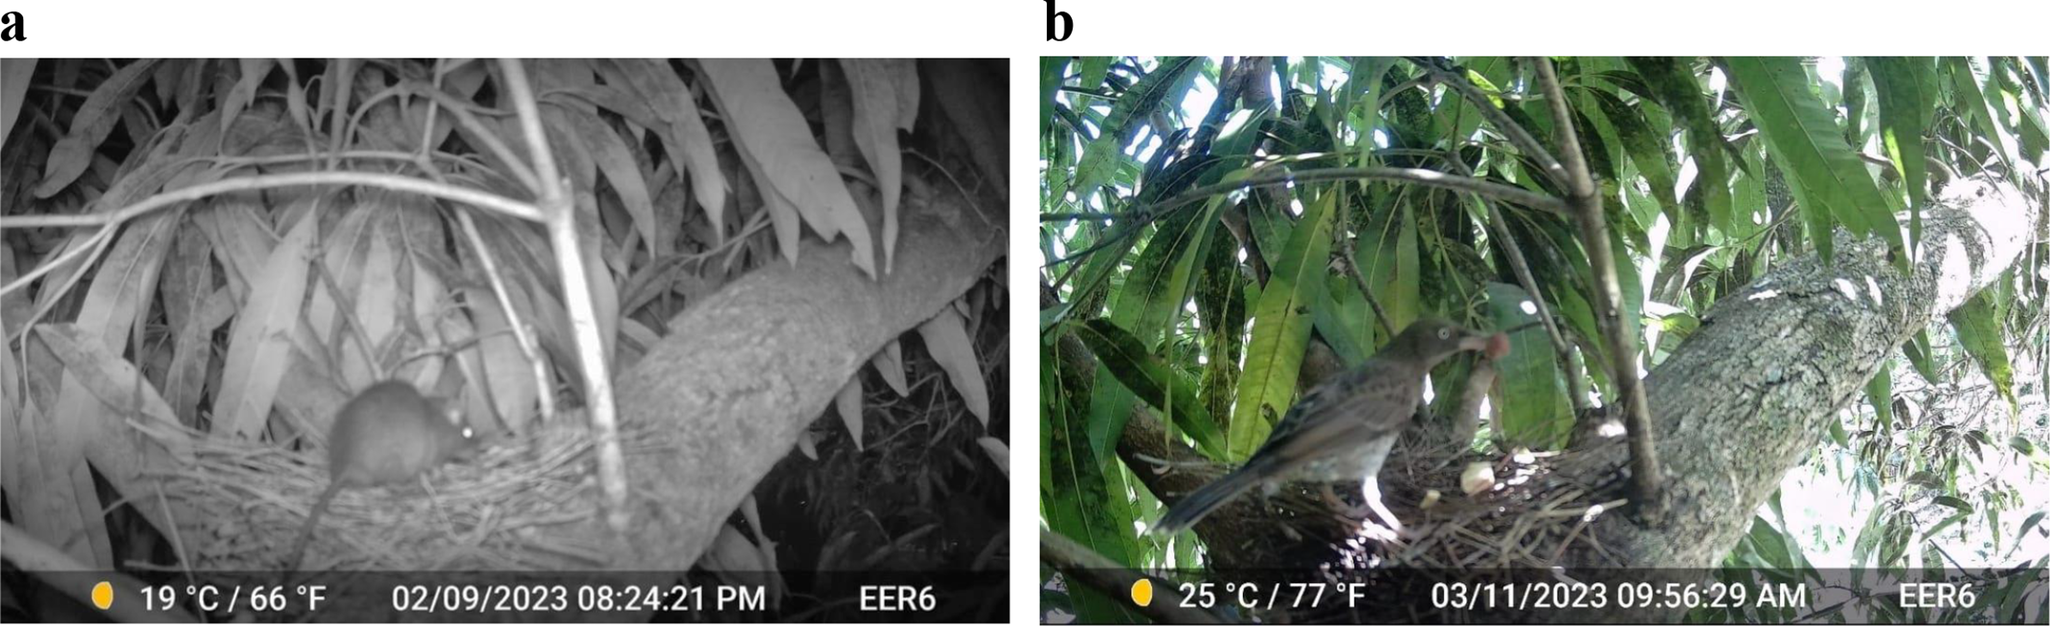
The reduction of vegetation cover from uprooted trees, stem breaks, and defoliation can limit food supplies, particularly for fruit/seed-eating birds such as the Plain Pigeon (Wiley and Wunderle Reference Wiley and Wunderle1993, Wunderle Reference Wunderle1995). The lack of adequate cover and food, in turn, can increase predation and decrease demographic rates, causing prolonged population bottlenecks (Beissinger et al. Reference Beissinger, Wunderle, Meyers, Sæther and Engen2008; Rivera-Milán et al. Reference Rivera-Milán, Martínez, Matos, Guzmán, Ruiz-Lebrón and Ventosa-Febles2022; Wiley and Wunderle Reference Wiley and Wunderle1993). Although the Plain Pigeon population recovered rapidly from hurricanes Hugo and Georges (Rivera-Milán et al. Reference Rivera-Milán, Ruiz, Cruz, Vázquez and Martínez2003b, Reference Rivera-Milán, Boomer and Martínez2016), we expected a prolonged recovery time from hurricanes Irma and Maria mainly due to unsuccessful reproduction from mammalian and avian nest predation (Figures 1 and 2; Ventosa-Febles Reference Ventosa-Febles2019) and anthropogenic disturbances, including habitat loss and degradation from urban development (Martinuzzi et al. Reference Martinuzzi, Gould and Ramos-González2007), the disturbance of active nests in forest fragments near houses and roads (Ruiz-Lebrón et al. Reference Ruiz-Lebrón, Gutiérrez, Valentín and Ventosa-Febles2021), and illegal hunting (Rivera-Milán et al. Reference Rivera-Milán, Boomer and Martínez2014, Reference Rivera-Milán, Boomer and Martínez2016).
Puerto Rico Plain Pigeon Patagioenas inornata wetmorei nesting on a mango tree Mangifera indica. (Photograph: E. Ventosa-Febles, Effective Environmental Restoration).

(a) Nest predation by the black rat Rattus rattus and (b) Pearly-eyed Thrasher Margarops fuscatus. (Photographs: E. Ventosa-Febles, Effective Environmental Restoration).

Motivated by the severe population decline suffered after hurricanes Irma and Maria in 2017 (Rivera-Milán et al. Reference Rivera-Milán, Martínez, Matos, Guzmán, Ruiz-Lebrón and Ventosa-Febles2022), we used distance sampling to estimate abundance (density and population size) in April–June 2018−2024, accounting for post-hurricane changes in detection probability. We used the distance-sampling abundance estimates of April–June 1986−2024 to populate a Bayesian state–space logistic model and update posterior estimates of population carrying capacity (K), maximum population growth rate (rmax), population recovery time (1/rmax; May Reference May and May1976), and predicted abundance in April–June 2025−2034 (N 2025−2034), accounting for observation error (e.g. from incomplete counts due to imperfect detection) and process variance (e.g. due to year-to-year variation in abundance from births and deaths in a geographically isolated population). In addition, we used the model-based posterior estimates of predicted abundance to assess potential extinction risk (probability P[N 2025−2034 = 0|data]), population self-sustainability above 5,000 individuals (P[N 2025−2034 >5,000|data]; Traill et al. Reference Traill, Brook, Frankham and Bradshaw2010), and population surpassing the 2.5th percentile of carrying capacity as in the late 1990s (P[N 2025−2034 >30,000|data]; Rivera-Milán et al. Reference Rivera-Milán, Boomer and Martínez2016, Reference Rivera-Milán, Martínez, Matos, Guzmán, Ruiz-Lebrón and Ventosa-Febles2022).
Methods
Distance sampling
Here we focus on count data collected at 1,400 points that were surveyed once per year in April–June 2018−2024. The survey region covered 749,000 ha (Rivera-Milán et al. Reference Rivera-Milán, Boomer and Martínez2016; Figure 1). We used teams of two observers to meet the basic assumptions of distance sampling (Buckland et al. Reference Buckland, Anderson, Burnham, Laake, Borchers and Thomas2001, Reference Buckland, Rexstad, Marques and Oedekoven2015). That is: (1) certain detection of pigeon singles and clusters of pigeons at the point centres; (2) detection of pigeon singles and clusters of pigeons at initial locations, before any responsive movement; (3) correct distance measurements from the point centres to initial locations of pigeon singles and the perceived geometric centre of clusters of pigeons; (4) accurate cluster size estimation; (5) representative coverage of the survey region by the surveyed points. To maximise detection probability of pigeons present and available at the surveyed points (
 $ {\hat{P}}_d $
; Nichols et al. Reference Nichols, Thomas, Conn, Thomson, Cooch and Conroy2009), the teams of two observers carried out the surveys between the second week of April and the second week of June, comprising the peak of nesting activity and density of active nests of columbids on the island (Rivera-Milán Reference Rivera-Milán1996, Reference Rivera-Milán2001; Rivera-Milán et al. Reference Rivera-Milán, Ruiz, Cruz and Sustache2003a). The two observers remained side by side at the point centres (distance r = 0) and conducted six-minute counts of the pigeons present and available within 0−440 m. One observer mainly recorded the data and the other observer mainly measured detection distances with a binocular rangefinder. Detection distances were measured to pigeon singles or the perceived geometric centre of pigeon clusters. A cluster was defined as two or more pigeons within 10 m of each other, showing similar behaviour (e.g. perching on neighbouring tree branches).
We modelled detection probability as a function of distance r and covariates represented by vector z (i.e. g [r, z]; Buckland et al. Reference Buckland, Rexstad, Marques and Oedekoven2015). We estimated density as
 $$ \hat{D}=\frac{n\overline{s}}{2\pi k{\hat{P}}_d\left({\mathbf{z}}_i\right)}, $$
where is the number of individuals/ha, n is the number of single and cluster detections, is the average cluster size, π is the ratio of the circumference of a circle to its diameter (~3.14159…), and k = 1,400 points. The surveyed area of each point (πr
2) covered 608,212 m2 (~61 ha). We estimated population size by extrapolating estimated density to the 749,000-ha survey region (i.e.
 $ \hat{N}=\hat{D}\times A $
, where A = kπr
2/10,000). To improve the fit of detection models (P value >0.05), we right truncated the ungrouped distance data (w = 261 m; Buckland et al. Reference Buckland, Anderson, Burnham, Laake, Borchers and Thomas2001), and estimated detection probability as
 $$ {\hat{P}}_d\left({\mathbf{z}}_i\right)=\frac{2}{w^2}\int_0^wr\hat{g}\left(r,{\mathbf{z}}_i\right) dr. $$
We evaluated the fit of uniform, half-normal, and hazard-rate detection models with Pearson’s χ 2 test, Kolmogorov–Smirnov test, and Cramer–von Mises family tests (Buckland et al. Reference Buckland, Anderson, Burnham, Laake, Borchers and Thomas2004, Reference Buckland, Rexstad, Marques and Oedekoven2015). We based model selection on minimisation of Akaike information criterion (AIC) (Buckland et al. Reference Buckland, Anderson, Burnham, Laake, Borchers and Thomas2001, Reference Buckland, Rexstad, Marques and Oedekoven2015). Based on AIC, we selected the half-normal key function with one cosine series expansion to model the detection function. We included cluster size as a continuous covariate and year as a categorical covariate (0 = 2018, 1 = 2019, 2 = 2021, 3 = 2022, 4 = 2023, 5 = 2024) in the half-normal detection model. We also post-stratified the distance data by year (Buckland et al. Reference Buckland, Anderson, Burnham, Laake, Borchers and Thomas2001, Reference Buckland, Rexstad, Marques and Oedekoven2015). Owing to the COVID-19 pandemic, we did not conduct surveys in April–June 2020. For data analysis, we used the program DISTANCE 7.5, Release 2 (Thomas et al. Reference Thomas, Buckland, Rexstad, Laake, Strindberg and Hedley2010). We present results as means and bootstrapped standard errors (SE). We provide details of other statistical analyses with corresponding results.
Bayesian state–space logistic model
We modelled annual changes in abundance with the discrete logistic equation, including human-induced mortality from an unknown number of pigeons illegally hunted on the island (Rivera-Milán et al. Reference Rivera-Milán, Boomer and Martínez2014, Reference Rivera-Milán, Boomer and Martínez2016, Reference Rivera-Milán, Martínez, Matos, Guzmán, Ruiz-Lebrón and Ventosa-Febles2022). That is
 $$ {N}_{t+1}={N}_t+{r}_{max}{N}_t\left[1-\left(\frac{N_t}{K}\right)\right]-{M}_t, $$
where K is the population carrying capacity, rmax is the maximum intrinsic rate of population growth, Nt is the true unknown abundance state of the population, and Mt is the number of deaths in year t. The number of deaths Mt = Nt mt, where mt is the mortality rate between year t and t + 1. We generated annual mortality rates randomly as part of the Markov Chain Monte Carlo (MCMC) algorithm (Hobbs and Hooten Reference Hobbs and Hooten2015) with the uniform distribution (mt ~ Uniform [0.01, 0.25]; Rivera-Milán et al. Reference Rivera-Milán, Boomer and Martínez2016). In addition to parameters K and rmax, we used the model to obtain posterior estimates of population recovery time (1/rmax) and predicted abundance for April–June 2025−2034 (N 2025−2034). Based on ecological theory for single population models (May Reference May and May1976, chapter 2), we used 1/rmax to estimate the time (in years) needed for the pigeon population to recover from the 2017 hurricanes. In that sense, 1/rmax is a measure of population resilience (Pimm Reference Pimm1991, chapter 1).
We reparametrised the unknown abundance state as a proportion of population carrying capacity (i.e. Pt = Nt/K) to reduce the autocorrelation of MCMC samples. We assumed that the error of state model predictions ε was lognormally distributed with mean 0 and estimated standard deviation (SD) σprocess. Based on this reparameterisation, we projected abundance for April–June 2025−2034 with
 $$ {P}_{t+1}=\left[{P}_t+{r}_{max}{P}_t\left(1-{P}_t\right)-\frac{M_t}{K}\right]{\mathrm{e}}^{\varepsilon_t}. $$
We modelled abundance proportion of the first year using a lognormal distribution with mean P
0 and variance
 $ {\unicode{x03C3}_{P_0}}_2 $
. That is
 $$ {P}_1\sim \mathrm{Lognormal}\;\left({P}_0,{\unicode{x03C3}_{P_0}}_2\right). $$
While the process model in the state–space formulation accounted for year-to-year variation in pigeon abundance, we also related true unknown abundance state to the survey-based, distance-sampling abundance estimates to account for observation error. To complete the observation model of the state–space formulation, we related true unknown abundance state (Nt = PtK) to estimated abundance with
 $$ \log\;\left({y}_t\right)=\log\;\left({P}_tK\right)+{\mu}_t, $$
where
 $$ {\mu}_t\sim \mathrm{Normal}\;\left(0,{\unicode{x03C3}}_{t,\mathrm{observation}}^2\right). $$
We assumed human-induced mortality occurred after the April–June peak of reproduction, and that all pigeons, regardless of sex and age class, had equal mortality probability between year t and t + 1. We also assumed additive mortality from natural and anthropogenic disturbances, although the model formulation allowed for compensation through linear density-dependent population growth.
Based on results presented in Rivera-Milán et al. (Reference Rivera-Milán, Martínez, Matos, Guzmán, Ruiz-Lebrón and Ventosa-Febles2022, Table 4), we used informed uniform priors (Hobbs and Hooten Reference Hobbs and Hooten2015) for population carrying capacity (K ~ Uniform [30,538, 58,600]) and maximum population growth rate (rmax ~ Uniform [0.095, 0.295]). We generated parameter posterior distributions by running program JAGS version 4.3.0 (Plummer Reference Plummer2003) within R version 4.0.4 (R Core Team 2021) using R package R2JAGS version 0.6−1 (Su and Yajima Reference Su and Yajima2021). We ran 250,000 iterations and used the first 50,000 iterations for a burn-in period. We thinned three Markov chains by 25 to obtain samples of 8,000 iterations per chain. We checked for convergence of the MCMC algorithm with trace plots and node summary statistics (e.g. Brooks–Gelman–Rubin diagnostic statistic
 $ \hat{R} $
= 1.00−1.01; Gelman and Hill Reference Gelman and Hill2007) and made posterior predictive checks with Bayesian pb values (i.e. 0.1 <pb <0.9; Hobbs and Hooten Reference Hobbs and Hooten2015). We present results as means and MCMC SD with 2.5th, 50th, and 97.5th percentiles.
Potential extinction risk and population self-sustainability
We used the Bayesian state–space logistic model to assess the potential risk of extinction (i.e. probability Pr[N 2025−2034 = 0|data]) from the fraction of annual posterior samples with predicted abundance dropping below a single individual in April–June 2025−2034. Similarly, we used the posterior samples of predicted abundance to assess population self-sustainability above 5,000 individuals (Pr[N 2025−2034 >5,000|data]; Traill et al. Reference Traill, Brook, Frankham and Bradshaw2010), and population surpassing the 2.5th percentile of carrying capacity as in the late 1990s (Pr[N 2025−2034 >30,000|data]; Rivera-Milán et al. Reference Rivera-Milán, Boomer and Martínez2016, Reference Rivera-Milán, Martínez, Matos, Guzmán, Ruiz-Lebrón and Ventosa-Febles2022). We assumed 5,000 would be the minimum number of individuals needed for the population to remain demographically sustainable and ecologically functional during the next 10 years in the face of additive mortality from nest predation and natural and anthropogenic disturbances (Traill et al. Reference Traill, Brook, Frankham and Bradshaw2010). We used a 10-year modelling horizon, based on the time needed for the USFWS to conduct two five-year status reviews (https://www.fws.gov/project/five-year-status-reviews).
Results
Distance sampling
We made 92 detections (n) at 1,400 points (k) in April–June 2018−2024. That is, the encounter rate (n/k) was 0.066 (SE = 0.010). Cluster detection was not size biased (
 $ \overline{s} $
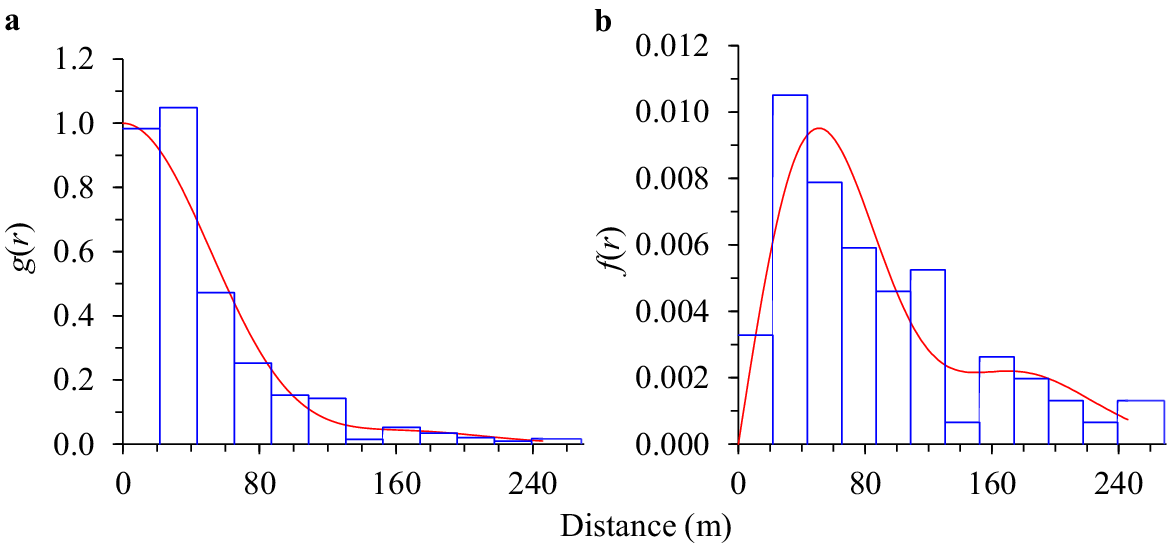
= 1.49, SE = 0.09; Pearson’s r = −0.12, df = 90, P = 0.26). The half-normal key function with one cosine series expansion and without covariates provided the best fit to the distance data (Pearson’s χ2 = 6.98, df = 8, P = 0.54; P >0.40 for the Kolmogorov–Smirnov test and Cramer–von Mises family tests; AIC = 749.28) (Figure 3). The cluster size and year covariates received little or no support from the distance data (ΔAIC ≥4.88). The detection probability was 0.096 (SE = 0.012) within 261 m of the point centres (Figure 3). That is, effective detection radius (w × [
 $ {\hat{P}}_d $
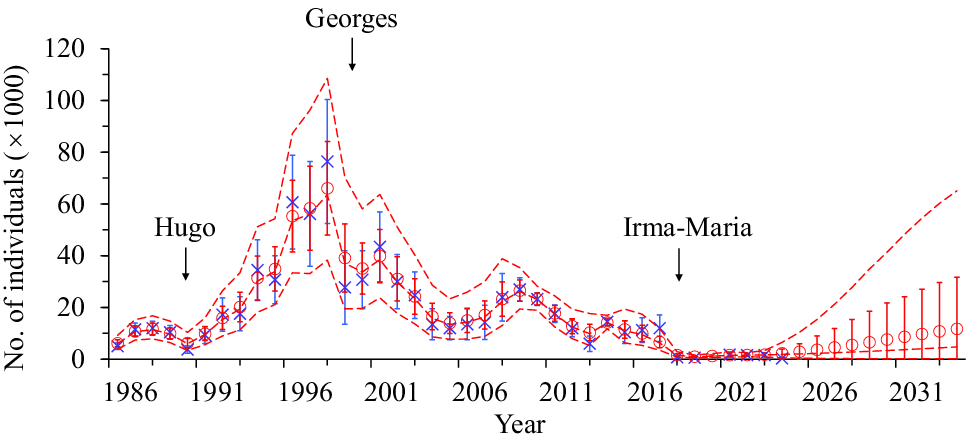
]0.5) was 81 m (SE = 5). In April–June 2018−2024, density averaged 0.0015 individuals/ha (SE = 0.0006) and population size averaged 1,097 individuals (SE = 455) in the 749,000-ha survey region (Figure 4).
(a) Puerto Rico Plain Pigeon detection probability and (b) probability density function based on the half-normal key function with one cosine series expansion and 92 detections made within 261 m of the centre of 1,400 points surveyed on Puerto Rico in April–June 2019−2024.

Puerto Rico Plain Pigeon distance-sampling abundance estimates (blue crosses for mean with vertical lines for bootstrapped SE) in April–June 1986−2024, and Bayesian state–space logistic model posterior estimates of predicted abundance (red circles for mean with vertical lines for MCMC SD) with 2.5th, 50th, and 97.5th percentiles (red dashed lines) in April–June 1986−2034.

Bayesian state–space logistic model
Markov chains and node summary statistics showed adequate convergence of the MCMC algorithm (Brooks–Gelman–Rubin diagnostic statistic
 $ \hat{R} $
= 1.001). There was no evidence of model lack of fit (pb = 0.58). The posterior estimate of mean K was 41,580 individuals (SD = 8,052, with 2.5th, 50th, and 97.5th percentiles = 30,509, 40,171, and 57,760). The posterior estimate of mean rmax was 0.183 (SD = 0.056, with 2.5th, 50th, and 97.5th percentiles = 0.099, 0.178, and 0.285). The posterior estimate of mean 1/rmax was 6 years (SD = 2, with 2.5th, 50th, and 97.5th percentiles = 10, 6, and 4). The posterior estimate of mean N
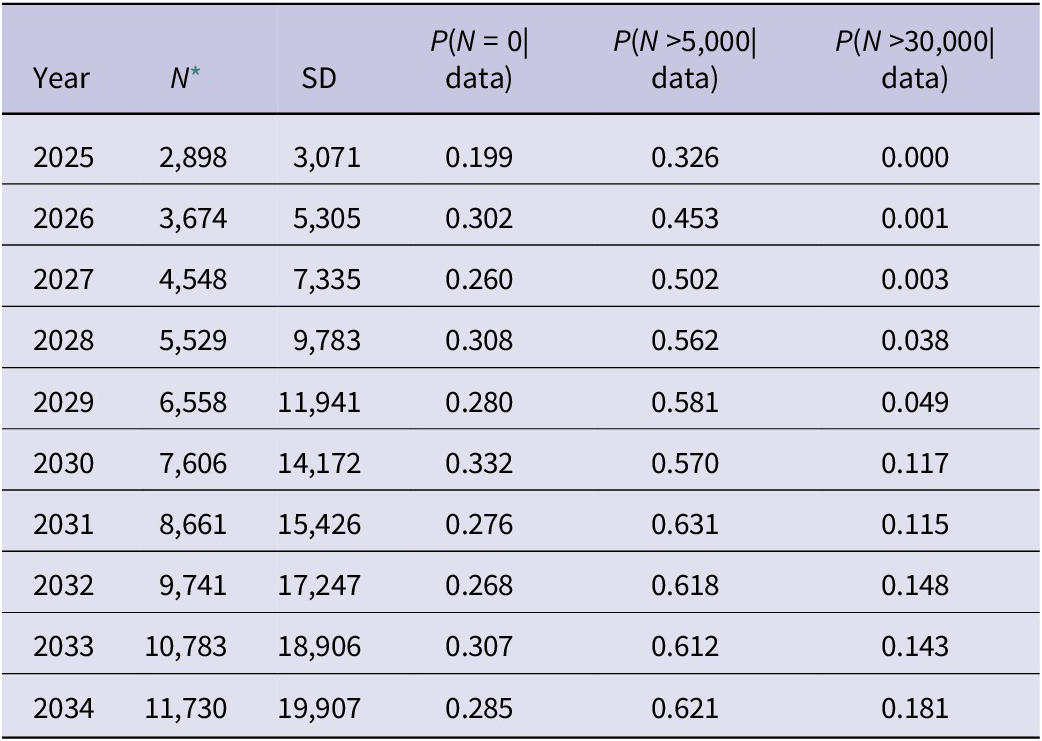
2025−2034 was 7,173 individuals (SD = 12,309 with 2.5th, 50th, and 97.5th percentiles = 233, 3,287, and 37,881) (Table 1 and Figure 4).
Puerto Rico Plain Pigeon potential risk of extinction (probability Pr[N 2025−2034 = 0|data]), population self-sustainability above 5,000 individuals (Pr[N 2025−2034 = 5,000|data]), and population surpassing the 2.5th percentile of carrying capacity (Pr[N 2025−2034 = 30,000|data]) based on the Bayesian state–space logistic model posterior samples of predicted abundance (N 2025−2034) for April−June 2025–2034

* Posterior mean of predicted abundance and MCMC SD (as in Figure 4).
Potential extinction risk and population self-sustainability
Estimated population size was 11,984 individuals (SE = 5,129) in April–June 2017 and declined to 749 individuals (SE = 354) in April–June 2018, 529 individuals (SE = 237) in April–June 2019, and 287 individuals (SE = 75) in April–June 2024 (Figure 4). The population has not recovered from the severe decline suffered after the 2017 hurricanes, with range Pr(N 2024−2033 = 0|data) = 0.199−0.332, range Pr(N 2024−2033 >5,000|data) = 0.326−0.631, and range Pr(N 2024−2033 >30,000|data) = 0.000−0.181 in April–June 2025−2034 (Table 1).
Discussion
We used distance sampling to estimate the abundance of the Puerto Rico Plain Pigeon in April–June 1986−2024, accounting for changes in detection probability after hurricanes Irma and Maria in September 2017. We used the distance-sampling abundance estimates to populate a Bayesian state–space logistic model and update posterior estimates of population carrying capacity, population maximum growth rate, population recovery time, and predicted abundance in April–June 2025−2034. In addition, we used the annual posterior samples of predicted abundance to assess potential extinction risk, population self-sustainability above 5,000 individuals (Traill et al. Reference Traill, Brook, Frankham and Bradshaw2010), and population surpassing the 2.5th percentile of carrying capacity as in the late 1990s (Rivera-Milán et al. Reference Rivera-Milán, Boomer and Martínez2016, Reference Rivera-Milán, Martínez, Matos, Guzmán, Ruiz-Lebrón and Ventosa-Febles2022). The methods applied here are grounded in statistical theory (Buckland et al. Reference Buckland, Anderson, Burnham, Laake, Borchers and Thomas2001, Reference Buckland, Anderson, Burnham, Laake, Borchers and Thomas2004, Reference Buckland, Rexstad, Marques and Oedekoven2015; Hobbs and Hooten Reference Hobbs and Hooten2015) and have been used to estimate the abundance and monitor the population dynamics of columbids and other landbirds on Puerto Rico and elsewhere in the Caribbean before and after extreme weather events (Rivera-Milán et al. Reference Rivera-Milán, Collazo, Stahala, Moore, Davis and Herring2005, Reference Rivera-Milán, Boomer and Martínez2014, Reference Rivera-Milán, Bertuol, Simal and Rusk2015, Reference Rivera-Milán, Simal, Bertuol and Boomer2018, Reference Rivera-Milán, Madden and Verdel2021, Reference Rivera-Milán, Gerbracht and Simal2025). Through annual comparisons of survey-based abundance estimates and model-based abundance predictions we can evaluate the results of management actions aiming as a minimum to maintain the pigeon population above self-sustainability levels (i.e.
 $ \hat{N} $
>5,000 individuals; Traill et al. Reference Traill, Brook, Frankham and Bradshaw2010). Although we made simplifying assumptions (e.g. linear density-dependent population growth in response to natural and anthropogenic disturbances), restricting the state–space model to essential parameters sufficed for description, estimation, and prediction, accounting for observation process variances. Annually updated abundance predictions can improve our understanding of demographic sustainability, ecological functionality, and population viability and resilience to future hurricanes.
In the logistic model, parameter K represented the abundance above which the pigeon population would tend to decline because of density-dependent factors (e.g. intraspecific competition for suitable nesting habitat with low predator densities; Rivera-Milán Reference Rivera-Milán1996, Reference Rivera-Milán2001; Rivera-Milán et al. Reference Rivera-Milán, Ruiz, Cruz and Sustache2003a, Reference Rivera-Milán, Martínez, Matos, Guzmán, Ruiz-Lebrón and Ventosa-Febles2022). The Plain Pigeon population increased from low numbers (e.g.
 $ \hat{N} $
= 3,745 individuals, SE = 1,393 in April–June 1990, after Hurricane Hugo; Figure 4) and surpassed carrying capacity (e.g.
 $ \hat{N} $
= 76,398 individuals, SE = 23,968 in April–June 1998, before Hurricane Georges; Figure 4) during a period of natural reforestation in abandoned agricultural areas (Brandeis and Turner Reference Brandeis and Turner2013; Koenig Reference Koenig1953, Yuan et al. Reference Yuan, López, Arnold, Brand, Klein and Schmidt2017). However, the pigeon population was already at low numbers before the 2017 hurricanes (i.e.
 $ \hat{N} $
= 11,984 individuals, SE = 5,129 in April–June 2017, and the additive effects of nest predation and natural and anthropogenic disturbances may be keeping the population well below self-sustainability levels (e.g.
 $ \hat{N} $
= 287 individuals, SE = 75 in April–June 2024, which is the lowest estimated abundance since monitoring started in April–June 1986 (Figure 4).
In the model, parameter rmax represented the exponential rate of increase of the Plain Pigeon population at lowered abundance (i.e. free from the effects of density-dependent factors) and under favourable environmental conditions (e.g. with adequate vegetation cover and food supplies to maximise annual reproductive output). As it is difficult to estimate rmax in a fluctuating island environment, we need long-term, survey-based monitoring data and a flexible modelling framework to keep updating the parameter posterior estimates before and after extreme weather events, accounting for observation and process variances (Hobbs and Hooten Reference Hobbs and Hooten2015; Rivera-Milán et al. Reference Rivera-Milán, Boomer and Martínez2016, Reference Rivera-Milán, Martínez, Matos, Guzmán, Ruiz-Lebrón and Ventosa-Febles2022). In addition, because parameter posterior distributions may be skewed, the median is more reliable than the mean as a measure of central tendency of the point estimator (Link et al. Reference Link, Schofield, Barker and Sauer2018). The Plain Pigeon had a median rmax of 0.178, which is the lowest among the resident columbids of Puerto Rico, except for the Ruddy Quail-Dove Geotrygon montana, Key West Quail-Dove G. chrysia, and Bridled Quail-Dove G. mystacea, which are ground nesters and had a median rmax of 0.159 when their distance-sampling abundance estimates were considered combined in the Bayesian state–space logistic model (F.F. Rivera-Milán, unpublished data). For example, median rmax was 0.627 for the Zenaida Dove Zenaida aurita, 0.555 for the Scaly-naped Pigeon Patagioenas squamosa, and 0.227 for the White-crowned Pigeon P. leucocephala (F.F. Rivera-Milán, unpublished data). That is, when compared with other more abundant above-ground nesting resident columbids, the Plain Pigeon showed lower population resilience (i.e. longer recovery time 1/rmax).
Owing to adaptations and strategies typical of the columbids (e.g. crop-milk production, multiple brooding, and extended nesting; Blockstein and Westmoreland Reference Blockstein, Westmoreland, Baskett, Sayre, Tomlinson and Mirarchi1993), successful reproduction is of key importance for fast population recovery after extreme weather events (Rivera-Milán Reference Rivera-Milán1996, Reference Rivera-Milán2001; Rivera-Milán et al. Reference Rivera-Milán, Ruiz, Cruz and Sustache2003a). However, contrary to other resident columbids, which were actively calling and nesting during the 2018−2024 surveys, the Plain Pigeon was rarely detected calling or nesting, with most of the monitored nesting attempts deemed unsuccessful due to nest predation mainly by black rats Rattus rattus and Pearly-eyed Thrashers Margarops fuscatus (Ventosa-Febles Reference Ventosa-Febles2019) (Figures 1 and 2), and anthropogenic disturbances such as cutting the branches of nesting trees near houses and roads (Ruiz-Lebrón et al. Reference Ruiz-Lebrón, Gutiérrez, Valentín and Ventosa-Febles2021). In addition to frequently unsuccessful reproduction, the Plain Pigeon has a clutch size of one egg instead of the typical columbid clutch size of two eggs. Therefore, regardless of reproductive adaptations and strategies shared with other resident columbids, a clutch size of one egg can further limit the annual reproductive capacity of the Plain Pigeon, lowering rmax and increasing 1/rmax. Worst-case scenario, the 2.5th percentile of rmax was 0.099 and 1/rmax was 10 years.
The Plain Pigeon population may reach self-sustainability levels (range Pr[N 2025−2034 >5,000|data]) = 0.326−0.631), but currently is undergoing a prolonged bottleneck and may become extinct (range Pr[N 2025−2034 = 0|data]) = 0.199−0.332), particularly if reproduction continues to be mostly unsuccessful, anthropogenic disturbances remain unabated, and on top of that another devastating hurricane makes landfall during the next 10 years. With this concern in mind, in addition to removing predators from nesting sites to increase and maintain reproductive success rate above 0.40 (SE = 0.05; Rivera-Milán et al. Reference Rivera-Milán, Ruiz, Cruz and Sustache2003a, Ruiz-Lebrón et al. Reference Ruiz-Lebrón, Gutiérrez, Valentín and Ventosa-Febles2021; Ventosa-Febles Reference Ventosa-Febles2019), we have made recommendations to help mitigate the negative impacts of natural and anthropogenic disturbances (Rivera-Milán et al. Reference Rivera-Milán, Boomer and Martínez2016, Reference Rivera-Milán, Martínez, Matos, Guzmán, Ruiz-Lebrón and Ventosa-Febles2022), including public and hunter education to address the disturbance of active nests and illegal hunting, and engaging private landowners in the conservation of foraging and nesting habitats through programmes such as the Partners for Fish and Wildlife (www.fws.caribbean/ES/ and www.fws.gov/partners/). The Puerto Rico Plain Pigeon subspecies is a unique conservation unit (Miyamoto et al. Reference Miyamoto, Allard and Moreno1994, Rusello et al. Reference Rusello, Stahala, Lalonde, Schmidt and Amato2010) in urgent need of management to increase and maintain abundance above 5,000 individuals (Traill et al. Reference Traill, Brook, Frankham and Bradshaw2010), but preferably surpassing the 2.5th percentile of population carrying capacity as in the late 1990s (range Pr[N 2025−2034 >30,000|data] = 0.000−0.181 in April–June 2025−2034 (Table 1 and Figure 4).
Acknowledgements
This assessment was possible thanks to the support of the USFWS, Division of Migratory Bird Management, Branch of Assessment and Decision Support, the USFWS Endangered Species Conservation/Recovery Implementation Funds, and the Puerto Rico Department of Natural and Environmental Resources, Division of Terrestrial Ecology through Commonwealth and Federal Aid Funds. The findings and conclusions in this article are those of the authors and do not necessarily represent the views, determinations or policies of our respective government agencies and nongovernmental organisations. Similarly, the use of trade, firm or product names does not imply endorsement by our agencies or organisations.