Introduction
Toll-interacting protein (Tollip) localizes to early endosomes (Capelluto, Reference Capelluto2012; Lu et al., Reference Lu, Psakhye and Jentsch2014), multivesicular bodies (Katoh et al., Reference Katoh, Shiba, Mitsuhashi, Yanagida, Takatsu and Nakayama2004) and Golgi apparatus (Li et al., Reference Li, Hu and Li2004) and closely relates to IL-1β, IL-13, toll-like receptor, TGF-β and cGAS-STING signaling pathways (Burns et al., Reference Burns, Clatworthy, Martin, Martinon, Plumpton, Maschera, Lewis, Ray, Tschopp and Volpe2000; Zhang and Ghosh, Reference Zhang and Ghosh2002; Zhu et al., Reference Zhu, Wang, Luo, Zhang, Ding, Jiang, Wang, Pan and Chen2012; Ito et al., Reference Ito, Schaefer, Sanchez, Francisco, Alam, Martin, Ledford, Stevenson, Jiang, Li, Kraft and Chu2018; Pokatayev et al., Reference Pokatayev, Yang, Tu, Dobbs, Wu, Kalb and Yan2020). Tollip from human contained four transcriptional forms (Lo et al., Reference Lo, Beckhouse, Boulus and Wells2009) with three typical domains, including the TBD (Tom1-binding domain), central C2 (conserved 2) domain and CUE (coupling of ubiquitin to endoplasmic reticulum degradation) domain (Yamakami et al., Reference Yamakami, Yoshimori and Yokosawa2003). As a lipid molecule binding domain (Ankem et al., Reference Ankem, Mitra, Sun, Moreno, Chutvirasakul, Azurmendi, Li and Capelluto2011), the C2 domain mediated the specific binding to PtdIns3P or PtdIns(3,4,5) (Li et al., Reference Li, Hu and Li2004) and resulted in membrane localization. The C-terminal domain triggered intramolecular ubiquitination (Kang et al., Reference Kang, Daniels, Francis, Shih, Salerno, Hicke and Radhakrishnan2003; Shih et al., Reference Shih, Prag, Francis, Sutanto, Hurley and Hicke2003) and protein-protein interactions (Zhang and Ghosh, Reference Zhang and Ghosh2002; Lim et al., Reference Lim, Newman, Williams, Masino, Aitkenhead, Gravard, Gileadi and Svejstrup2019).
In vertebrates, tollip inhibited TLR-mediated immune responses and apoptosis by binding to TLRs (Zhang and Ghosh, Reference Zhang and Ghosh2002; Mukherjee and Biswas, Reference Mukherjee and Biswas2014) or IL-1R-mediated signaling pathway through regulation of phosphorylation (Burns et al., Reference Burns, Clatworthy, Martin, Martinon, Plumpton, Maschera, Lewis, Ray, Tschopp and Volpe2000). It was reported that tollip activated the immune system by stabilizing STING proteins (Pokatayev et al., Reference Pokatayev, Yang, Tu, Dobbs, Wu, Kalb and Yan2020) and overexpression of tollip inhibited NF-κB activation. Some clues indicated the important role of tollip in human diseases like cancer (Ahmed et al., Reference Ahmed, Lai, Zada, Hwang, Pham, Yun and Kim2018), inflammation (Maillard et al., Reference Maillard, Bega, Uhlig, Barnich, Grandjean, Chamaillard, Michetti and Velin2014; Katayanagi et al., Reference Katayanagi, Setoguchi, Kitagawa, Okamoto and Miyazaki2022) Alzheimer's disease (Cribbs et al., Reference Cribbs, Berchtold, Perreau, Coleman, Rogers, Tenner and Cotman2012), Parkinson's disease (Ryan and Tumbarello, Reference Ryan and Tumbarello2021), Huntington's disease (Doi et al., Reference Doi, Mitsui, Kurosawa, Machida, Kuroiwa and Nukina2004). Although some functions of tollip in few non-mammals have been partially documented (Rebl et al., Reference Rebl, Høyheim, Fischer, Köllner, Siegl and Seyfert2008, Reference Rebl, Rebl, Li, Goldammer and Seyfert2011; Zhang et al., Reference Zhang, Li, Wang, Wang, Zhang, Hu, Zhang, Wang, Wang and Bao2015; Shan et al., Reference Shan, Wang, Zhang, Zhu, An and Yang2016; Feng et al., Reference Feng, Lin, Wang and Zhang2019; Jiang et al., Reference Jiang, Nissa, Guo, Zhang, Zheng and Zou2022), the roles of tollip in insects remained unclear.
The oak silkworm Antheraea pernyi is one of the important wild silk-producing insets in China and used for food, silk reeling, and medicinal purposes (Liu et al., Reference Liu, Li, Li and Qin2010; Li et al., Reference Li, Zhang, Lin and Terenius2017). It was well known that diapause, molting, metamorphosis as well as immunity were very important for the growth of insects (Hillyer, Reference Hillyer2016; Kang et al., Reference Kang, Zhang, Wang, Zhao, Han, Wang and Zhao2019; Truman, Reference Truman2019; Numata and Shintani, Reference Numata and Shintani2023) and 20-hydroxyecdysone (20E) could promote the apoptosis and autophagy during these biological processes (Romanelli et al., Reference Romanelli, Casati, Franzetti and Tettamanti2014; Dong et al., Reference Dong, Jing, Liu, Wang and Zhao2015). In this study, a tollip homolog was first characterized from A. pernyi and its expression patterns were investigated in various tissues, developmental stages or under different challenges. The protein interaction between ubiquitin and Ap-tollip was determined. In addition, RNA interference of Ap-tollip was performed to explore its effect on the expression of target genes in apoptosis and autophagy signal pathways.
Materials and methods
Experimental animals
Healthy A.pernyi pupae were maintained at 4°C and released from stasis according to the method (Bao et al., Reference Bao, Zhu, Yu, Luo, Zhang, Yue and Fang2022), then the pupae were used for moth production. After copulation and laying eggs, some fertilized eggs were collected on days 2, 4, 6, 8, 10, 12, and 14. The other fertilized eggs were kept at 22°C with 70% humidity and 12 h light:12 h dark for ants hatching. The larvae were fed at 22°C with fresh oak leaves until 4th instar and used for experiments.
Sequence analysis of Ap-Tollip
Total RNA or DNA was extracted from fat body and used for PCR. Specific primers (shown in Table 1) were designed for the identification of genomic sequence of Tollip. The PCR procedure was 94°C 5 min pre-denaturation, followed by 35 cycles of 95°C 30s denaturation, 54–56°C 40s annealing and 72°C 1 min extension, and a final extension at 72°C for 5 min. PCR products were purified and sequenced by BGI Genomics Co., Ltd (Shenzhen, China).
The sequence of Ap-Tollip was analyzed by BLAST (https://blast.ncbi.nlm.nih.gov). The amino acid sequence and conserved domains of Ap-Tollip proteins was predicted using AAT Bioquest (https://www.aatbio.com/) and SMART (https://www.smart.embl.de/) software, respectively. The Prabi (https://npsa-prabi.ibcp.fr/cgi-bin/npsa_automat.pl?page=/NPSA/npsa_sopma.html) and Phyre2 tool (Kelley et al., Reference Kelley, Mezulis, Yates, Wass and Sternberg2015) were used for prediction of Secondary structures and tertiary structures. Multiple sequence comparisons were performed using DNAMAN with its default parameters. A neighbor-joining phylogenetic tree was constructed using MEGA software (Kumar et al., Reference Kumar, Stecher, Li, Knyaz and Tamura2018) based on Tollip sequences from different species.
Primers for the PCR amplification of Ap-Tollip genomic sequence

Protein expression and purification
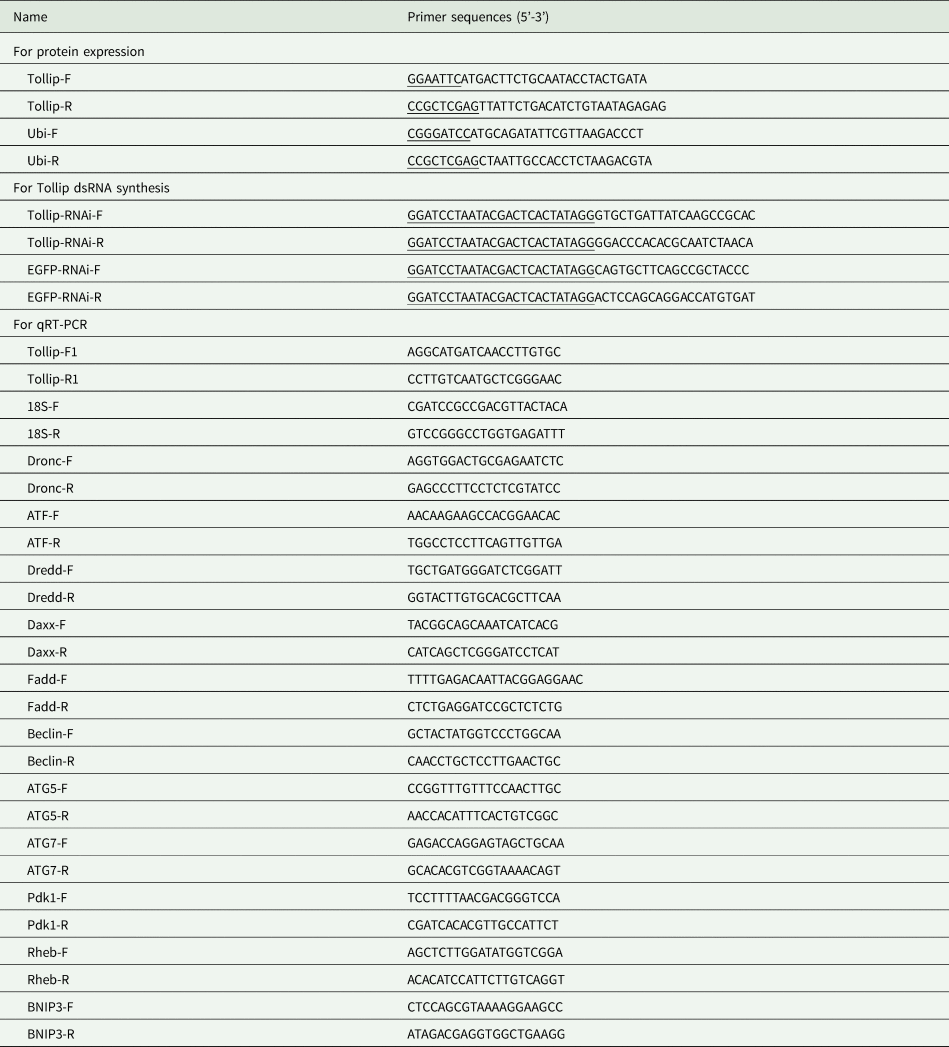
To investigate the interaction between Ap-Tollip and ubiquitin, fragments of Ap-Tollip and Ap-ubiquitin were amplified by PCR using specific primers (Tollip-F and Tollip-R, Ubi-F and Ubi-R, Table 2) and then ligated to pET-28a (+) or PGEX-4 T-1 vector after digestion with restriction enzymes. The recombinant plasmids were transformed into E. coli BL21(DE3) cells for protein expression induced by IPTG (isopropyl-β-D-thiogalactopyranoside). The recombinant proteins were purified using Proteinlso® Ni-NTA Resin or Proteinlso® GST Resin (TransGen Biotech, Beijing), then were visualized by 12% SDS-PAGE and the concentration of purified proteins was quantified by BCA method (Walker, Reference Walker1994). In addition, the antiserum against Ap-Tollip was prepared. Briefly, the purified Ap-Tollip proteins (100 μg) were incubated with adjuvant and immunized New Zealand white rabbits at two-week intervals, the antibodies were collected after the fourth immunization and used for western blotting.
Primers used for real-time PCR, protein expression and RNAi

Note: Restriction sites are underlined, T7 promoters are double underlined.
Western blotting
Protein samples were separated by 12% SDS-PAGE electrophoresis, and then transferred to PVDF (polyvinylidene difluoride) membrane (Millipore Sigma, USA) and blocked with PBST (phosphate buffered saline containing 0.1% Tween-20) containing 5% non-fat milk powder for 1 h. Then, 5 mg of purified proteins were incubated with the PVDF membrane for 4 h at room temperature. After washing with PBST, membranes were incubated with primary antibodies for 2 h and then incubated with the secondary antibodies (TransGen Biotech, Beijing) for 50 min at room temperature. Finally, the membranes were stained with the Enhanced HRP-DAB Fifth Color Development Kit (Tiangen, Beijing).
Pull-down assay
To further confirm the interaction between Ap-Tollip and Ap-ubiquitin, Ap-Tollip protein was used as pery protein and Ap-Ubi as bait protein. Pull-down assay was performed using Pierce™ His Protein Interaction Pull-down Kit (Thermo Scientific, USA) according to the instructions. The purified recombinant Ap-Tollip protein was immobilized on His agarose beads and then the purified recombinant Ap-ubiquitin proteins were incubated with Ap-Tollip proteins. The eluate was collected for SDS-PAGE electrophoresis and subsequently validated by western blotting using anti-GST antibodies. Non-treated agarose was used as a negative control.
Real-time PCR
The cDNA was reverse transcribed using PrimeScript™ RT Master Mix (Takara, China) with RNA templates from different tissues and the concentration of cDNA was adjusted to 150 ng/μL with ddH2O. The primers of candidated genes for PCR were listed in Table 2 and the PCR program was: 95°C for 5 min, followed by 40 cycles of 95°C for 15 s, 58°C for 30 s and 72°C for 30 s. The relative expression of genes was calculated using the 2−ΔΔct method (Livak and Schmittgen, Reference Livak and Schmittgen2001) and 18S rRNA gene (GenBank accession no. DQ347469) was selected as an internal reference. Each experiment was performed in three replicates. The data were analyzed by Student's t-test or one-way ANOVA analysis using SPSS software and difference was considered as significant when P-value was less than 0.05.
Expression pattern analysis of Ap-Tollip
The tissues epidermis, fat body, midgut, hemocytes, silk gland and malpighian tubule were collected for tissue distribution analysis. Total RNA was extracted using Trizol method and total protein from each tissue was extracted using the Total Animal Protein Extraction Kit (Coolaber, Beijing) according to the instructions. The expression level of Ap-Tollip was detected by real-time PCR or western blotting using anti-Tollip and anti-β-tublin antibodies. For different developmental stages, the fertilized eggs at 2, 4, 6, 8, 10, 12 or 14 day after oviposition as well as the larvae from 1st to 4th instars were collected for real-time PCR analysis. Thirty eggs or three larvae were concluded in each group and all the experiments were done in tripilcate. For various challenges, 10 μL of lipopolysaccharide (LPS, 1 μg/μL) or polyinosinic: polycytidylic acid (poly I: C, 1 μg/μL) or 20-hydroxyecdysone (20E, 1 μg/μL) was injected into each A. pernyi pupa, respectively, and hemocytes or fat bodies were collected at 3 h, 6 h, 9 h, 12 h and 24 h post-injection. Three pupae were injected in each group and biological sampling was repeated three times. The PBS injection group was used as a negative control,
RNAi of Ap-Tollip
The dsRNA sequences of Ap-Tollip and EGFP were synthesized in vitro using ScriptMAXTM Thermo T7 Transcription Kit (TOYOBO, Japan)according to the instructions. dsRNA concentration was measured using an Ultra-micro nucleic acid concentration meter and adjusted to 1 μg/μL. 10 μl dsRNA was separately injected into each pupa and fat bodies were collected at 24 h and 48 h after injection. The changes in the expression levels of candidated genes involved in autophagy and apoptosis pathways were detected by real-time PCR after RNAi. The EGFP dsRNA injection group was used as a control.
Results
Sequence analysis of Ap-Tollip
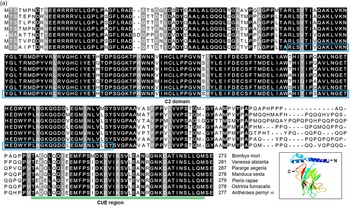
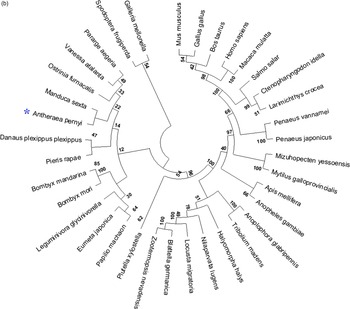
The genomic sequence of Ap-Tollip was 15,060 bp long with eight exons and seven introns (shown in fig. 1 and supplementary file). Several possible promotor sites (1656–1706 bp and 2221–2271 bp) and binding sites for transcription factors CREB and ATF were predicted. The open reading frame of Ap-Tollip (GenBank accession no. OQ447887) was 834 bp long and encoded a protein including a conserved C2 domain (65–183 aa) and a CUE region (235–275 aa). The predicted Ap-Tollip protein included 31.77% alpha helix, 6.86% beta turn and 44.77% random coil (fig. 2A). It was highly homologous to those Tollip proteins from Lepidopteran insects in terms of conserved structural domains (fig. 2B).
Genomic sequence analysis of Ap-Tollip. The exons and introns were marked by black and gray, respectively. UTR, untranslated region.

(a) Sequence alignment of Ap-Tollip with other insect Tollips. The conserved C2 domain was boxed and the CUE domain was double underlined. The predicted three-dimensional structure of Ap-Tollip was shown at the bottom right-hand corner. (b) Phylogenetic trees were constructed using the neighbor-joining method based on the amino acid sequences of Tollip proteins from different species. Numbers close to each branching point indicate the percentage of 1000 bootstrap iterations supporting the branch. The GenBank numbers for these tollip sequences are:Bombyx mori (XP_037871305), Vanessa atalanta (XP_047538853), Pararge aegeria (XP_039747777), Manduca sexta (XP_030035003), Pieris rapae (XP_022120383), Ostrinia furnacalis (XP_028157188), Mus musculus (CAB58121), Gallus gallus (NP_001006471), Bos taurus (NP_001035050), Homo sapiens (CAB58118), Macaca mulatta (NP_001248200), Salmo salar (ACI33751), Ctenopharyngodon idella (AFM09715),Larimichthys crocea (XP_027137215), Penaeus vannamei (AET79206), Penaeus japonicus (BAK19511), Mizuhopecten yessoensis (AKO62848), Mytilus galloprovincialis (AHI17285), Apis mellifera (XP_624417), Anopheles gambiae (XP_562476), Anoplophora glabripennis (XP_018572445), Tribolium madens (XP_044255367), Halyomorpha halys (XP_014283422), Nilaparvata lugens (XP_022189393), Locusta migratoria (AWJ58418), Blattella germanica (PSN31565), Zootermopsis nevadensis (XP_021925455), Plutella xylostella (XP_037976358), Papilio machaon (XP_045539518), Eumeta japonica (GBP04589), Leguminivora glycinivorella (AXS59135), Bombyx mandarina (XP_028042731), Danaus plexippus plexippus (XP_032522997), Spodoptera frugiperda (XP_050552012), Galleria mellonella (XP_026751574).

Fig 2. continue

Protein interaction between Ap-Tollip and Ap-ubiquitin
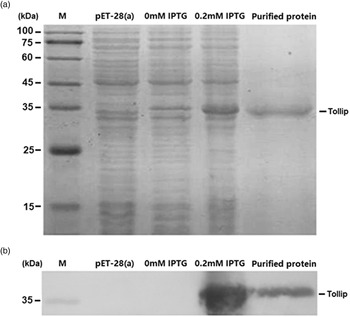
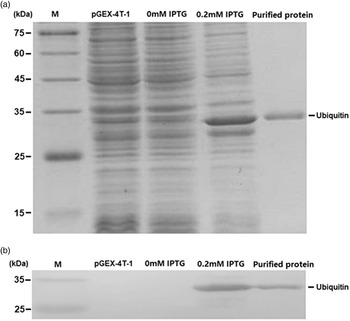
Recombinant Ap-Tollip (fig. 3) and Ap-ubiquitin (fig. 4) proteins corresponding to the predicted molecular weights (about 36 kDa and 34 kDa, respectively) were successfully expressed and purified from in E. coli cells, which was confirmed by SDS-PAGE and western blotting. After protein purification, the interaction between Ap-Tollip and ubiquitin was further verified by His pull-down method. In His pull-down assay, non-treated agarose was set as a negative control and immobilized bait was used as a positive control. Two specific protein bands were found after pull-down assay and were consistent with the sizes of Ap-Tollip and Ap-ubiquitin (fig. 5A), and further western-blotting also confirmed it (fig. 5B). His pull-down assay indicated that Ap-Tollip could bind ubiquitin in vitro.
Protein expression, purification (a) and western blotting of Ap-Tollip (b). The protein expression of Ap-Tollip was induced by IPTG. Crude extracts of E. coli transformed with pET-28 (a+) vector or pET-28 (a+)-Tollip recombinant plasmids were subjected to SDS-PAGE and stained with Coomassie brilliant blue R250. The western blot was performed using anti-His tag antibodies. M, protein marker.

Protein expression, purification (a) and western blotting of Ap-Ubiquitin (b). Crude extracts of E. coli transformed with pGEX-4 T-1 vector or pGEX-4 T-Ubiquitin recombinant plasmids were used for SDS-PAGE analysis. The western blot was carried out using anti-GST tag antibodies. M, protein marker.

Pull-down assay of Ap-Tollip and Ap-Ubiquitin. (a) SDS-PAGE of collected eluate. (b) Western blotting of Ap-Ubiquitin. Tollip, purified Ap-Tollip protein; Tollip + Ubiquitin, protein eluate; Ubiquitin, purified Ap-Ubiquitin protein; Agarose, Agarose Gel control; M, protein Marker.

Expression of Ap-Tollip in different tissues and developmental stages
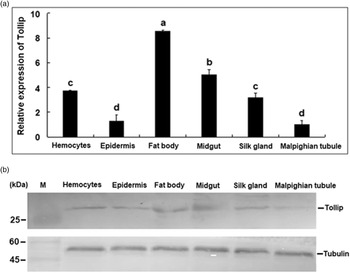
Six tissues of A.pernyi larvae at the 3rd day of 4th instar were collected and total RNA and proteins was extracted for real-time PCR (fig. 6A) and western blotting (fig. 6B). The results showed that Ap-Tollip was widely expressed in examined tissues with the highest expression level in the fat body, while the lowest expression was found in the malpighian tubule. In addition, the result of real-time PCR was in agreement with that of western blotting. As far as the developmental stages were concerned, Ap-Tollip was obviously upregulated in eggs from the 10th day to the 14th day (fig. 7A). In larvae, higher expression levels were found at the 3rd day of the 1st or 2nd instar as well as the 1st day of the 4th instar (fig. 7B).
Tissue distribution of Ap-Tollip. The expression levels of Ap-Tollip were determined by real-time PCR and western blotting. The data were analyzed by one-way ANOVA and presented as the mean ± SE of independent experiments performed in triplicate. Bars labeled with different letters indicated significant differences (P < 0.05). Western blot of tubulin was used as a control.

Expression of Ap-Tollip in egg (a) and larvae (b). Real-time PCR was used to determine the expression levels of Ap-Tollip. The relative expression of Ap-Tollip was calculated using the 2−ΔΔct method and 18S rRNA gene was used as an internal reference. The data were presented as the mean ± SE and each experiment was performed in triplicate.

Expression patterns of Ap-Tollip under various challenges
Real-time PCR was carried out to investigate the role of Ap-Tollip in immunity and development of A. pernyi. In fat body, the expression of Ap-Tollip was significantly triggered by LPS or poly I: C from 3 to 9 h post-induction and more than 15-fold changes were detected at the peaks (fig. 8A, D). Although the Ap-Tollip expression was induced by poly I: C in hemocytes from 9 to 24 h post-induction, it was downregulated by LPS at 3, 12 and 24 h (fig. 8B, C). For 20E challenge, the transcript levels of Ap-Tollip showed a decreasing trend from 3 to 9 h and obvious up-regulation at 24 h was found (fig. 9).
Expression profiles of Ap-Tollip in fat bodies and hemocytes under Poly (I: C) (a and b) or LPS (c and d) challenge. These tissues were collected 3, 6, 9, 12, or 24 h post-injection and the PBS-injected groups were used as the calibrators. Bars represent mean ± S.E. (n = 3) and asterisks represented significant differences (P < 0.05).

Expression levels of Ap-Tollip in fat bodies after 20-hydroxyecdysone induction. The Ap-Tollip mRNA level in the PBS-injected group was designated as a control. Significant differences between control and treatment groups were indicated by asterisks.

Effects of Ap-Tollip RNAi on the expression of apoptosis and autophagy-related genes
RNAi was performed to explore the effects of Ap-Tollip on the candidate genes related with the immunity and development. Five apoptosis-related genes (Dronc, ATF-2, Dredd, Daxx, Fadd) and six autophagy-related genes (Beclin-1, ATG5, ATG7, Pdk1, Rheb, BNIP3) were selected for real-time PCR assays. As shown in Fig. S1, the expression level of Ap-Tollip decreased significantly at 48 h after RNA interference. Except for Daxx (fig. 10A) and ATG7 (fig. 10B) genes, these candidate genes were significantly downregulated after RNAi.
Effect of Ap-Tollip RNAi on the expression of candidate genes. (a) Expression of apoptosis-related genes at 48 h after RNAi. (b) Expression of autophagy-related genes at 48 h after RNAi. The dsEGFP-injected group was used as a control.

Discussion
Tollip was reported to involve in multiple signal pathways (Yamakami and Yokosawa, Reference Yamakami and Yokosawa2004; Lang and Mansell, Reference Lang and Mansell2007; Toruń et al., Reference Toruń, Szymańska, Castanon, Wolińska-Nizioł, Bartosik, Jastrzębski, Miętkowska, González-Gaitán and Miaczynska2015). Although many tollip sequences from various insect species have been deposited in public database, their roles were less reported. Here, the genomic sequence of Ap-Tollip was identified with eight exons and seven introns as well as several binding sites of transcription factors (ATF and CREB) in the 5’-UTR, which was similar to that of Bombyx mori (GenBank accession no. BHWX01000014.1). Previous reports shown that ATF participated in apoptosis not only as a substrate for JNK and p38 (Maekawa et al., Reference Maekawa, Sano, Shinagawa, Rahman, Sakuma, Nomura, Licht and Ishii2008), but also bound to c-Jun to form a dimer to mediate apoptosis (Yuan et al., Reference Yuan, Gong, Luo, Zheng, Song, Ma, Guo, Hu, Thiel, Vinson, Hu, Wang and Li2009). CREB could induce the autophagy through multiple signal pathways (Seok et al., Reference Seok, Fu, Choi, Li, Zhu, Kumar, Sun, Yoon, Kang, Zhong, Ma, Kemper and Kemper2014; Liu et al., Reference Liu, Li, Zhou, Zhang, Meng, Liu, Zhang, He, He and Geng2020; Wang et al., Reference Wang, Liu, Xu, Yang, Wang, Song, Liu, Wang, You, Sun, Wang, Liu and Yan2021) enhance gene transcription (Jing et al., Reference Jing, Wang, Han, Dong, Wang and Zhao2016). We also found that the expression of CREB was upregulated in the fat body of A. pernyi upon fungi and virus challenges (Gao et al., Reference Gao, Sun, Sun, Chen, Kausar, Tian, Zhu and Liu2018). In addition, the predicted Ap-Tollip protein shared conserved C2 and CUE domains with other known tollips from invertebrates and vertebrates. The interaction between Ap-Tollip and Ap-Ubiquitin was also verified in vitro by His Pull-Down assay (fig. 5). All these suggested that Ap-Tollip had similar functions like tollips from other animals and was involved in various biological processes such as immunity and development in A. pernyi.
According to the results, Ap-Tollip was widely distributed in various tissues with higher expression levels in the immune-related tissues (fig. 6). Considering that LPS or poly (I:C) was extensively used as bacterial endotoxin and viral dsRNA to investigate the immune response in animals (Yamaguchi et al., Reference Yamaguchi, Argueta, Masuhiro, Kagishita, Nonaka, Saito, Hanazawa and Yamashita2005; Bai et al., Reference Bai, Cui, Gao, Liu, Lv and Zheng2021), the expression pattern of Ap-Tollip in the hemocytes and fat bodies induced by LPS or poly (I:C) was investigated (fig. 8). Both of LPS and poly (I:C) could regulate the expression of Ap-Tollip in these two tissues and the fat bodies were more sensitive to immune challenges compared with hemocytes. Some reports also confirmed the roles of tollip in the anti-virus response and triggering the NF-kapaB pathway in other animals (Lu et al., Reference Lu, Li, Wang, Su, Jin, Li and Li2013; Wei et al., Reference Wei, Xu, Chen, Zhang, Li, Wei, Yan and Qin2015; Jiang et al., Reference Jiang, Nissa, Guo, Zhang, Zheng and Zou2022; Wang et al., Reference Wang, Liu, Mao, Xu, Wang, Zhang, Liu, Xia, Yang and Yan2022). It was considered that Ap-Tollip was involved in the regulation of innate immunity in A. pernyi.
To further investigate the function of Ap-Tollip in the developmental process of A. pernyi, the expression patterns of Ap-Tollip in eggs and larvae were examined. It was found that Ap-Tollip was highly expressed in late stages of eggs and the expression level of Ap-Tollip varied in different instars (fig. 7). Meanwhile, the expression levels of Ap-Tollip were detected in fat body of pupa induced by 20-hydroxyecdysone. It was known that 20-hydroxyecdysone played a key role in controlling molting and larval-pupal metamorphosis of insects (Liu et al., Reference Liu, Dai, Guo, Li, Ma, Tian, Cao, Zhang, Palli and Li2015; Niwa and Niwa, Reference Niwa and Niwa2016) as well as apoptosis (Li et al., Reference Li, Tian, Guo, Guo, Zhang, Gu, Palli, Cao and Li2016a, Reference Li, Li, Yang, Wang and Zhao2016b). Recently, 20-hydroxyecdysone was found to take part in the pupal diapause termination of A.pernyi (Li et al., Reference Li, Liu, Xie, Zhang and Li2020; Du et al., Reference Du, Zhao, Wang, Ma, Yao, Zhu, Yang, Zhang, Sun, Liang, Xing and Duan2022). In this experiment, 20E obviously induced the expression of Ap-Tollip in the fat body of pupa (fig. 9) and RNAi of Ap-Tollip influenced the expression of candidate genes involved in apoptosis pathway (Fadd, Dronc, Dredd, ATF2) and autophagy pathway (ATG5, Beclin1, Rheb, Pdk1 and BNIP3) (fig. 10). These clues shown Ap-Tollip was correlated with the apoptosis and autophagy in the fat body of A. pernyi pupa.
In summary, a Tollip gene was identified from A. perni and it participated in the regulation of immunity and development. Further work should be focused on the Ap-Tollip-mediated signal pathways and its partners.
Supplementary material
The supplementary material for this article can be found at https://doi.org/10.1017/S0007485323000184.
Acknowledgements
This research was supported by the National College Students' Innovation and Entrepreneurship Training Program [202210364097], Foundation for Innovative Research Groups of Anhui Agricultural University [ANRC2019032] and the Natural Science Foundations of Anhui Higher Education Institutions of China [2022AH050923].
Conflict of interest
The authors have no conflict of interest to declare.