


1. Introduction
The heat exchange between ocean and atmosphere in polar regions is strongly influenced by ice cover. in winter, the insulating effect of the ice can reduce by two orders of magnitude the amount of heat transferred (Reference Maykut and UntersteinerMaykut, 1986). Sea ice can thicken either by thermodynamic growth or by dynamic (rafting and ridging) processes. Studies of sea-ice cores from this region (Reference Worby, Massom, Allison, Lytle, Heil and M. O.Worby and others, 1998) and from other regions of Antarctica (e.g. Reference LangeLange, 1988; Reference Jeffries and WeeksJeffries and Weeks, 1993) have shown that Antarctic sea ice thicker than about 0.6 m usually results from deformation rather than thermodynamic growth. The ice-growth rate in open water regions formed as the ice diverges can exceed the basal freezing rate by several orders of magnitude. The motion of sea ice has been shown to be highly correlated with the winds (e.g. Allison, 1989; Reference Kottmeier, Olf, Frieden and RothKottmeier and others, 1992). Alternating periods of ice convergence and divergence are caused by the frequent passage of synoptic systems in the sea-ice zone and the associated variation in winds (Kottmeier and others, 1992; Reference MassomMassom, 1992; Reference Worby, Bindoff, Lytle, Allison and MassomWorby and others, 1998). The wide range in air temperatures associated with these systems will alter the growth rate of the ice, particularly in open water regions (Reference Launiainen, Vihma, Johannessen, Muench and OverlandLauniainen and Vihma, 1994). Consequently, understanding the role of sea-ice dynamics during intervals of convergence, or in the formation of open water during intervals of divergence, is crucial when estimating the sca-icc thickness. in this paper we describe sea-ice deformation and associated open water formation due to dynamic processes. These dynamic processes are combined with a onc-dimensional thermodynamic model (Heil and others, 1996) to estimate ice growth in the short-lived open water areas.
2. Field Experiment and Atmospheric Conditions
During the austral winter of 1995, as part of the Australian National Antarctic Research Expedition (ANARE), a mult[disciplinary field programme was carried out in the inner pack of the East Antarctic, south of the Antarctic Divergence, centred near 65° S, 140° Ε (Worby and others, 1996). The drift and deformation of the sea ice was measured by a network of drifting buoys deployed on sea-ice does. Their position was determined either using the global positioning system (OPS, seven buoys) or with the Argos system (three buoys; CLS Argos, 1985). The GPS receivers recorded hourly-positional data, which allowed estimates to be made of the high-frequency components of the drift and deformation. Previous studies (e.g. Reference Wadhams, Sear, Crane, Rnwe, Morrison and LimbertWadhams and others, 1989; Massom, 1992) relied on data collected at lower frequency and discussed sea-ice deformation primarily in conjunction with synoptic weather systems, a low-frequency process. The accuracy of the positional measurements using GPS is better than ± 100 m. The accuracy of the Argos system is ± 200 m. The seven buoys with GPS positioning used in this experiment were recovered at the end of the experiment, while the Argos-only buoys were left in the ice.
The overall experiment focused on a square region, approximately 110 km on each side. The buoys were deployed so they would drift from the east through this region. After the initial buoy configuration had passed westward through the region in less than 10 days, all except three of the buoys (thereafter forming the array called B3-West) were recovered. A secondary strain array (B3-East) consisting of two GPS buoys and one Argos buoy was then deployed on the eastern side of the box. This array allowed investigation of the temporal variability of the ice deformation over the same physical region. We arranged the buoys into six different arrays with average areas of 110 2980 km2. The range of array sizes allows us to determine whether similar ice deformation takes place at different spatial scales. The deployment of the buoys was staggered in time, and varied in length from 9.8 to 15.7 days. For the analysis of high-frequency motion and its effect on the growth of sea ice we concentrate, in this paper, on data related to the original array configuration (A5) only. Other arrays are discussed with in the context of temporal and spatial variability.
Meteorological observations (air pressure, winds, air temperature, relative humidity and incoming shortwave radiation) were collected routinely during the experiment. There is a good correlation between the buoy drift and the wind velocities (Worby and others, 1996). Synoptic charts from the European Centre for Medium-range Weather Forecasting (ECMWF) analysis were used to extract the large-scale atmospheric circulation in the East Antarctic sea-ice zone during the experiment. Synoptic systems moved over the region every 3-8 days. For example, a low-pressure system with air pressure below 950 hPa passed through the region on 16 August (day of year (DoY) 228), followed by an even stronger system with a minimum air pressure of 934hPa on 25 August (DoY 237). The surface temperatures were warm prior to the experiment, with some temperatures above 0°C, and some melting was observed. During the initial 3 days after deployment of the buoys, the surface temperatures ranged from -15° to -4°C, but, with the passage of a low-pressure system on 6 August (DoY 218), temperatures briefly warmed, peaking near the freezing point. After the passage of this system, temperatures plunged to —23°C and remained low for the rest of the experiment ( 29° to 13°C). The passage of these systems through the sea ice is a common feature in this region (Worby and others, 1998). During succeeding cold periods, new ice formed rapidly in the leads, and we observed very little open water. As observed from the bridge of the vessel, the percentages of nilas and grey ice were 3-23% and 0-14%, respectively. in general, the ice concentration and floe size in the region decreased towards the north (Worby and others, 1996).
3. Drift Results
The buoys were deployed with in the coastal current oil East Antarctica, where the ice drift is predominantly westward. At the beginning of the passage of a low-pressure system, the buoys described a full anticyclonic rotation. They then drifted northeast (Fig. 1), with the wind direction having changed from easterly to west-southwesterly. This drift behaviour confirms that on short time-scales (hours to a few days), the ice responds to the wind stress rather than to the forcing of oceanic currents. After the passage of the first low, the buoys resumed their general westward drift, until the passage of the next low-pressure system caused another deviation from the mean drift path.
Array A5 was the high-resolution array of five buoys deployed early in the experiment. The mean hourly drift speed of the centroid of A5 was 0.20 m s−1 and the mean daily displacement 16.9 km. The zonal velocity had a net westward
Drift of the buoys used in the deformation calculations. 0000 UT buoy positions are marked with triangles. The outline of the oceanographie experiment box is also shown. The southern leg of the box is roughly parallel to the bottom topography. ETOP05 data (NOAA, 1988) are used to contour the bathymetry.

component (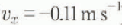 ), while the meridional flow showed a small net component to the north (vy
=0.02 m s−1). Frequency analysis (Fig. 2) of the various velocity components of the individual drifters shows that half of the spectral power density is stored above periods of 2.5 days (0.4 cycles d−1), near the frequency of the passage of synoptic systems. A secondary peak is found around 13 hours, close to the inertial and the semi-diurnal lunar tidal periods. This is similar to the results reported for the Weddell Sea (Kottmeier and others, 1992). However, because oflhe large water depth in this region (around 2900 m), the peak at 13 hours is probably caused by inertial motion rather than by tides (personal communication from G. D. Hubbert, 1996). Further analysis of this high-frequency motion can be found in Reference Hibler, Heil and LytleHibler and others (1998). Based on the coherence spectra between the wind and the ice velocities, we estimate that the atmospheric forcing on the ice drift accounts for 40-60% of the total energy in the velocity spectrum, primarily in the low
(a) Time series and (b) frequency spectrum of the centroid of array A5. The power density has units of (m s−1)−2 per frequency bin.

frequencies. Similar results have been found in the Weddell Sea (Reference Limbert, Morrison, Sear, Wadharms and RoweLimbert and others, 1989; Wadharns and others, 1989; Massom, 1992). There were no direct ocean-current measurements. However, oceanic currents are probably a source of some of the low-frequency (< 1 cycle d−1) energy. Ice-floe interaction may also influence the energy spectrum, particularly at higher frequencies.
4. Sea-Ice Deformation
Components of sea-ice deformation can be described using differential kinematic parameters (DKPs) (e.g. Wadharns and others, 1989; Massom, 1992). The DKPs are divergence (D), vorticity (V), shear (S) and normal (N) deformation. Only D, S and Ν contribute to the sea-ice deformation, while V describes the rotational component of the icefield. For the definition of the DKPs we follow Reference KirwanKirwan (1975) and Reference Molinari and KirwanMolinari and Kirwan (1975). From the buoys deployed we define various strain arrays (Fig. 3), comprising four arrays during the initial deployment phase, one array during the second phase and a further array extending over the middle part of the experiment. The arrays vary in size as well as in position. The time scries of the divergence of array A5 is shown in figure 4a. Strong signals and often reversal of sign in the divergence are associated with passages of synoptic weather systems (e.g. the spike at the end of DoY 219). Following Saucier (1955) and Wadharns and others (1989), within a time-span δt the change of area (δA) enclosed by the strain array can be related to the divergence (D) by:

Solving this for the change in area per time-step and integrating over the total time of the experiment, we derive the cumulative change in area of the buoy array. During the first 3.5 days, array A5 underwent a reduction in area to 90% of the initial size. During the next 1.5 days, the array rapidly expanded to 110% of its original size (Fig. 5). This was followed by a second interval of compaction. At the time A5 was abandoned, there was negligible change in the total area, i.e. very little net divergence. Spectral analysis of the divergence (fig. 4b) shows energy contributions over the entire spectrum. The spectral peak at 13 hours is most likely associated with the inertial motion. Approximately one-quarter of the energy is contained in periods greater than 1 day, probably generated by the synoptic systems. The results of the frequency analysis for shear and normal deformation also indicate equal energy input from high- and low-frequency processes.
Configuration of the strain arrays at their initial positions. Note that the deployment of the arrays did not take place simultaneously, but over 2 weeks.

(a) Time series and (b) spectral analysis of the divergence of array A5. Note the large spike in divergence during the passage of a low-pressure system around DoY 219.

Comparison of the area of array A5 at deployment with that at recovery would wrongly suggest little deformation had occurred. The high-tcmporal-rcsolution data reveal that there were many cycles of convergence and divergence on time-scales less than 1 day. For each of these sub-daily cycles, sea ice grows in the open water areas as the ice diverges, and subsequently rafts or ridges into thicker lloes during periods of convergence.
Divergence is the dominant kinematic parameter, generally at least twice the magnitude of the normal or shear deformation and mostly exceeding the vorticity (table 1). Only the array to the north (A3-North) shows comparable values of the three deformation parameters. in addition, the vorticity for this array is high compared to most of the other arrays. All buoy arrays except A3-West show a positive net divergence. in order to estimate the influence of array size and array position on the DKPs, we compare A3-East, A3-West and A3-North over the same time. We find the highest divergence for the array furthest north. This is probably because of lower ice thickness and reduced ice concentration observed in that region, resulting in an increase in free drift for individual ice floes. A3-Wesl and A3-East are of similar scale, and reside in the southernmost part of the experimental box. The magnitude of the divergence is similar for both. However, net divergence for A3-West is negative; the array is converging while A3-East is diverging.
Time series of the relative area enclosed by array A5. Over the 7 day period, only a small net change was measured.

Distribution of the DKPs over the various strain arrays during the experiment

The vorticity of the array to the east shows slightly stronger clockwise rotation. Shear and normal deformation of the two arrays are of the same order but of opposing sign. The differences in the three DKPs determining the deformation may be caused by boundary effects; in the region of investigation the ocean topography is not strictly aligned to the east west axis. This is likely to result in a strengthened northward deflection of the mean ice transport (Fig. 1) as the ice drifts westward. However, forced to the north the ice is prone to encounter more westward-drifting ice. This causes the pack, which is closer to the bathymétrie boundary (i.e. the ice within array A3-Wcst) to converge relative to the ice at a greater distance from the obstacle. For comparison, arrays further north (e.g. A3-Nofth and B3-West) show increased divergence which we relate to a decrease in ice concentration and floe size compared to the south.
With the redeployment ofa strain array (B3-East) to the east to the hydrographie box in the latter part of the experiment, we have the opportunity to examine temporal changes in the sea-ice drift and the DKPs over the same region. Here we compare B3-East with A3-North. The two arrays took overlapping paths, with B3-East covering on average nearly ten times the area and passing 2 weeks later through the region. The divergence of B3-East is slightly smaller than for A3-North. Shear deformation drops to less than half of the previous amplitude and reverses sign, indicating a stretching of the axis along 135-315° (0° being true north). The normal deformation drops significantly and reverses sign, stretching along the 0-180° (north south) axis. These changes in the DKPs are attributed to changed conditions related to the passing synoptic weather systems. The lower value for shear and normal deformation, together with the change of sign for these two parameters, is very likely related to westerly winds generated by a low-pressure system moving over the experimental domain.
For strain arrays deployed within a uniform oceanic system, such as here where all buoys were deployed south of the Antarctic Divergence, the effect of array size on the deformation rates is not as crucial as for arrays deployed in more divergent oceanic systems (e.g. Wadharns and others, 1989). However, the larger arrays tend to exhibit the largest divergence. It is difficult to separate the effects of array size from local effects of ice concentration or thickness. The larger arrays experienced a lower ice concentration to the north which also may have increased the total divergence. The interpretation of the lower net divergence rate for array A5 (medium size) compared to its smaller sub-arrays might indicate that the deformation signals of the sub-arrays are acting to cancel each other out, thereby reducing the overall signal of the larger array. Hence, a large array size might act to mask small-scale regional ice deformation.
The importance of high-frequency measurements and analysis on the DKPs, especially the divergence, can be highlighted by artificially smoothing the time series. Various low-pass filters with time banding between 2 and 24 hours were constructed and applied to the buoy position data. A comparison of the original data with the 24 hour low-pass filtered data shows that the mean velocity of the centroid decreased only slightly, while the divergence spectrum decreased significantly, containing less than half of the original energy.
5. Calculation of Enhanced Ice Growth
The total ice growth in leads opened by divergence is estimated for array A5 as follows. A one-dimensional multilayer thermodynamic model for the growth of sea ice (for details see Heil and others, 1996) is initialised each time the divergence changed sign from negative to positive, and is forced on hourly time-steps with observed meteorological parameters. For each time-step for which a new open water area had formed, a separate one-dimensional slab of ice is grown over this particular area. The various ice columns are kept growing until negative divergence is encountered. From there the areas containing the thinnest ice slabs are considered to collapse first and to be redistributed on the established ice cover by rafting and ridging in order to account for the reduced array area. The mass of ice newly produced in the various open water patches is derived as the product of the thickness of ice grown in each slab and the area of open water present when the model is initialised for this particular column summed over all time-steps. The total mass of ice grown in newly formed open water during the existence of array A5 is derived by accouniing for all divergent situations. Over a time of 7 days, the ice-growth contribution from the leads averaged over the total area of the array is 2.8 cm. This rapid ice growth in leads enhances the overall ice growth with in the array. The regular ice growth of the pack consists of growth onto the base of existing ice does and thickening by rafting or ridging of previously established ice, i.e. ice that existed prior to the last cycle of divergence and convergence. From bridge-based observations (Allison and Worby, 1994), a total increase in ice thickness of 5-7 cm is estimated for the region around A5 for the 7 day interval. Comparison of this with the result from the one-dimensional model indicates that approx-imately 40-50% of the total increase in ice thickness can be attributed to rapid ice formation in short-lived open water areas. That is, the high-frequency processes in sea-ice deformation significantly enhance the growth of the ice. Calculations with low temporal resolution are therefore unable to account for the enhanced ice growth in short-lived open water areas.
6. Conclusions
The results of this study show that half or more of the total energy in ice deformation is concentrated ai frequencies greater than 1 cycle d−1. This high-frequency divergence increased the ice-formation rate by up to 50% during the 3 week experiment in East Antarctica in 1995. Consequently, the cumulative effect of sub-daily processes of deformation is critical in the estimation of the total seasonal sea-ice formation rate. The comparison between hourly and daily averaged deformation data shows that, in the latter case, a considerable amount of the energy is removed by the smoothing. Also, the power spectrum has a significant amplitude at the Nyquist frequency associated with our sampling rate of once per hour, suggesting that even higher-frequency components may be present. To determine the maximum frequency which is important for calculating ice-deformation rates, increased spatial and temporal resolution is needed. From the results of this study, we suggest that, in future, buoy (and therefore ice ι positional data should be measured with GPS receivers or even differential GPS, in order to detect fine-scale deformation processes. However, the more important advantage of GPS receivers over the Argos system is the liner temporal resolution with which positional data can be collected. Considering possible positional errors and loss of data, we suggest that future deformation studies should interrogate the GPS position of each buoy every 10 min, in order to gain a statistically sound dataset with a suitable time resolution.
Acknowledgements
Thanks to the numerous people, including the captain and crew of the RSV Aurora Australis, who contributed to the success of the field experiment during which the data were obtained. Crucial input on the design of the experiment came from R. A. Massom and A. P. Worby. P.H. thanks G. D. Hubbert of Global Environmental Modelling Services, WarrandytC. Victoria, for the discussion on tidal and inertial motion. ECMWF charts were provided by M. J. Pook of the Bureau of Meteorology Regional Office, Hobart. figures 1 and 3 were produced with Generic Mapping Tools software (Reference Wessel and SmithWessel and Smith, 1991). The authors thank K.J. Michael and the second (anonymous) reviewer for their critical comments on the manuscript, as well as R. A. Massom for his guidance during completion of the paper.



