Introduction
Determining which factors are responsible for structuring fish communities in the natural ecosystem is a primary focus in aquatic ecology (Tesfay Reference Tesfay2016). Studies on freshwater fish have shown that biological, chemical and physical factors cause differences within and among communities and all operate on a range of both local and large spatial scales (Erȍs Reference Erȍs2007; Hossain et al. Reference Hossain, Das, Sarker and Rahaman2012). On a local scale, biological factors (Wang et al. Reference Wang, Lyons and Kanehl2003), physical factors (e.g., habitat diversity) (Hossain et al. Reference Hossain, Das, Sarker and Rahaman2012), water chemistry and water temperature (Araoye Reference Araoye2009) and flood regime and channel morphology in floodplain rivers (Moses Reference Moses1987) interact to influence fish species community distribution and relative abundance. Species richness and distribution in floodplain habitats are highly determined by physical factors (Hossain et al. Reference Hossain, Das, Sarker and Rahaman2012; Tongnunui et al. Reference Tongnunui, Beamish and Kongchaiya2016) while biological ones being more important under stable environmental conditions (Axenrot & Hansson Reference Axenrot and Hansson2004). Floodplain fish and fisheries are also characterized by diverse species assemblages, fishing gear and threats (Welcomme Reference Welcomee1985).
Tropical floodplain fisheries are a key livelihood of the socio-economically marginalized riparian communities, particularly in Africa, Asia and South America (Mosepele Reference Mosepele2014). Floodplain rivers of the lower reaches of the Abbay and Tekeze Basins are the only water resources that support all life requested activities in northwestern Ethiopia (e.g., domestic use, fisheries, irrigation). Fisheries of these floodplain rivers are also the mainstay of livelihoods for fishing communities of the Alitash National Park (ALNP). Despite the role of these rivers for food security through fisheries, they are under pressure from various development activities including hydropower plant construction and water abstraction for irrigation. The areas of ALNP and the whole course of the two basins in the Ethiopian plateau are also a corridor of herds of cattle and the riverside provides dry season grazing. Illegal fishers using piscicides for fishing are massive in the area (pers. obs.).
Urbanization following the shorelines of these habitats largely contributed to the modification of the natural hydrological cycle besides habitat loss and hence could affect fish communities. Due to the above and other human activities, these floodplain rivers are facing habitat alteration and modifications for agriculture that affect fisheries and hence associated livelihoods. Thus, understanding what factors are involved in the structuring of riverine fish community abundance and distribution is an important step towards managing and conserving the remaining floodplain ecosystem (Welcomme Reference Welcomee1985).
Local habitat patterns created in the moving littoral areas of floodplain rivers are disposed to disturbance triggered by seasonal variation patterns between drying and inundation. This disturbance can affect biological, chemical and physical factors in temporary rivers, which collectively act on individual or species level and can determine fish distribution and relative abundance. However, regardless of the possible environmental alterations due to human activities and their impending effects, there is no published ecological study available on fish community structure in the Abbay and Tekeze Basins along the ALNP. Of course, some reports and limited studies are available on the species occurrences (e.g., Tesfaye Reference Tesfaye2006; Tewabe Reference Tewabe2008; Golubtsov & Darkov Reference Golubtsov and Darkov2008). These studies focused only on fish diversity and lacked information on ecological factors that determine fish distribution and abundance. Therefore, this study tried to address the effects of different environmental factors on distribution and abundance of fish. It was also intended to describe fish assemblages and community structure of the ALNP in relation to water physico-chemical parameters in order to draft appropriate management strategies for riverine fisheries.
Materials and methods
Study sites
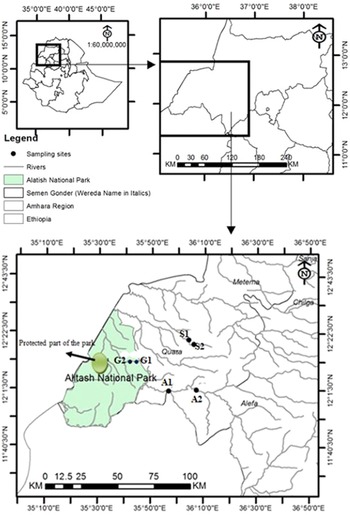
The ALNP is situated at 110 47′ 4″ to 120 31′3.6″ N latitude and 350 15′ 48″ to 350 48′ 51″ E longitude in northwestern Ethiopia (Figure 1). The park was established in 2006 as key biological resource conservation area in northwestern lowland. It covers an area of 266,570 hectares and is drained by Ayima and Gelegu Rivers (Abbay Basin) and Shinfa River (Tekeze Basin). These aforementioned rivers are floodplain and become small water pools during the dry season. These pools remain along the rocky bed of the river courses hold water up to the next rainy season and are easily accessed by fishers. For this study, sampling sites were selected based on the relative accessibility for sampling, habitat types and the level of fishing pressure operated on rivers. The six sites were coded as A1 and A2 representing Ayima and G1 and G2 representing the Gelegu, while Shinfa is represented by S1 and S2 (Figure 1). These sampling sites were assigned during the reconnaissance period based on relative accessibility for sampling and habitat types.
Sampling sites for collection of fish and water samples from Ayima (A1 and A2), Gelegu (G1 and G2) and Shinfa (S1 and S2) Rivers, northwestern Ethiopia.

Two complementary data sets of ichthyofauna and environmental variables on seasonal basis were collected from the six sampling sites. A1 (Abbay Dar) – is pool to riffle with a muddy and rarely sandy bottom and A2 (Farshaho) – is rocky with sandy bottom and largely riffle. River Gelegu has largely rocky eroded gorges with a very narrow channel of 3–17 m. Hence, the sampling sites at this river were rocky bottom at G1 (St. George) and muddy and sandy to rocky bottom at G2 (Shimelgir). G1 is riffle to pool, whereas G2 is precisely pool. In Shinfa, Duldula Bahir (S2) is rather riffled with muddy bottom and Ziqesh Bahir (S1) is pool with rocky substratum. Morphometric variables of the sampling sites such as site depth (m) measured using PLASTIMO ECHOTEST II-73420, channel length (m) measured using a rope and Secchi depth (cm) gauged by a standard 20 cm diameter Secchi disc were taken seasonally during each sampling occasion (Table 1). Points using Global Positioning System (GPS) were taken to locate sampling stations on a map (Table 1).
Summary of sampling sites with a GPS position A1 and A2 (Ayima), G1 and G2 (Gelegu) and S1 and S2 (Shinfa); Alt. = Altitude.

Fish sampling and specimen identifications
Fish samples were collected from April 2018 to November 2019 for two dry and two wet sampling times. In each sampling event, fishing was done for a period of six days. As much as possible, our fishing effort was similar in all sampling sites including the number of gillnets used in all settings. Gillnets having stretched mesh sizes of 4–14 cm with a panel length of 25–75 m and width of 1.5–2 m per mesh size were used for fish sampling. Hooks, long and hand lines, cast nets, old mosquito nets and electro-fishing were also used for fishing. Specimen identification was made using morphometric and meristic parameters by referring identification keys (Sandon Reference Sandon1950; Tedla Reference Tedla1973; Golubstov et al. Reference Golubstov, Darkov, Dgebuadze and Mina1995; Getahun & Dejen Reference Getahun and Dejen2012; Habteselassie Reference Habteselassie2012).
Water physico-chemical parameters
Water samples for physico-chemical parameter analysis were taken concomitantly with fish catches. Some parameters such as conductivity (EC) (µScm−1), dissolved oxygen (DO) (mgL−1), water temperature (T0) (0C) and pH were measured using a Multimeter probe (Model HQ 40d) in the field. Water transparency was measured with Secchi disc (20 cm in diameter). The concentrations of phosphates, nitrates, nitrites, silica, ammonium ions and total phosphorus were determined in the laboratory using spectrophotometer based on standard methods (APHA 1998). In addition, river morphometric variables were measured from each site including depth and channel diameter.
Data analysis
Descriptive statistics was used to determine the average values of each physico-chemical parameter and to evaluate the percentage contribution in weight and number of each fish species. Multivariate analysis of variance (MANOVA) was used to test for significant spatial differences of the physico-chemical parameters between the sampling sites. After running MANOVA, significant spatial differences on the parameters were observed, and then, one-way analysis of variance (ANOVA) was used to test the specific physico-chemical parameters that attributed to significant variation between study sites between the sampling sites in the rivers.
The index of relative importance (IRI) combines simultaneously individuals number (N), weight (Wt) and frequency of occurrence (FO), to evaluate ecological importance of fish species. This index was originally used for fish diet analysis and then later modified for the assessments of ecological importance of a species in an assemblage (Pinkas et al. Reference Pinkas, Oliphant and Iverson1971). This index can be computed for each species as IRIi = (%Wti + %Ni)*%FOi; and run to evaluate overall %IRI as:
 $$\% {\rm{IRIi}} = {{\left( {\% {\rm{Wti}} + \% {\rm{Ni}}} \right){\rm{*}}\% {\rm{FOi}}} \over {\sum\nolimits_{{\rm{i}} = 1}^{\rm{S}} {\left( {\% {\rm{Wti}} + \% {\rm{Ni}}} \right)} {\rm{*}}\% {\rm{FOi}}}}{\rm{X}}100$$
where % Wti = percentage weight of each species of total catch; % Ni = number of each species of total catch; % FOi = percentage of frequency of occurrence of each species in total settings; S = total number of species.
To maintain a resemblance matrix measured as Cophenetic correlation index, the unweighted pair group algorithm method of arithmetic mean averaging (UPGMA) and the Bray-Curtis similarity index were used for clustering in a dendrogram. For clustering, the mean fish number at each sampling site was employed to explore the pattern of fish community structure. A similarity percentage (SIMPER), based on the Bray-Curtis dissimilarity measure, was used to find out specific fish species that contributed to dissimilarity between the three river fish composition (Clarke Reference Clarke1993; Zuur et al. Reference Zuur, Ieno and Smith2007). All statistical analysis was performed in PAST version 3.20 (Hammer et al. Reference Hammer, Harper and Ryan2001), SPSS version 24.0 and Microsoft Office Excel 2007.
Detrended correspondence analysis (DCA) was performed to determine if species response followed linear or unimodal model (Legendre & Legendre Reference Legendre and Legendre1998; Lepš & Šmilauer Reference Lepš and Šmilauer2003). Therefore, based on this analysis a linear ordination was used because the gradient length along axis-1 in DCA was less than 3.0 turnover units. A redundancy analysis (RDA) triplot of species, sites and environmental variable data was used to determine fish community structure that could be explained by the specific measured environmental variables. Then, the extent of variability in fish assemblages explained by each environmental variable was explored further with RDA, a constrained ordination technique, using forward selection for appropriate environmental variable (Lepš & Šmilauer Reference Lepš and Šmilauer2003). Only environmental variables explaining significant variance (p < 0.05) were retained in the model and tested for significance. The relationships between species and the selected environmental variables were examined in RDA ordination plots based on species scores. All ordination procedures were performed in CANOCO for Windows Version 4.5 (ter Braak & Šmilauer Reference ter Braak and Smilauer1997–2002).
Results
Water physico-chemical parameters
All parameters, but the level of pH, EC and T0, differed significantly between the sampling sites (ANOVA, p < 0.05; Table 2). The mean values of EC ranged from 260.06±193.0 to 305.87±251.4 µScm−1 and did not show significant variation among the sampling sites (p = 0.479). The pH range of the water was slightly alkaline (8.08–8.39) and was higher at A1 and smaller at S1 but there was no significant difference among sites (p = 0.320; Table 2). The mean values of T0 ranged from 27.32 ± 2.90 to 29.68 ± 2.0 0C, and there was no significant difference among the sampling stations (p = 0.108; F = 1.897; Table 2). The mean level of DO in all sites was 7.26 ± 0.6 to 8.95 ± 0.7 mg L−1 and significantly different among sites (P = 0.002; F = 18.444).
Summary of descriptive statistical results of water physico-chemical and morphometric variables of study sites (DO-dissolved oxygen; T0-temperature; NO2 −-nitrite; NO3 −-nitrate; NH4 +-ammonium ion; SiO2-silicate; PO4 −2 –phosphate; TP-total phosphorus; EC-conductivity; SD = Secchi depth; SZ-site depth; CD-channel diameter).

* Statistically significant values at p < 0.05.
Fish assemblages
A total of 2719 fish specimens belonging to 43 species were sampled, and the number of species across families and specimens across species were different. Based on frequency of individual occurrence (FOi), only 5 fish species (Synodontis schall = 95.8%, S. serratus = 83.3%, Oreochromis niloticus = 83.3%, Labeobarbus bynni = 79.2% and Labeo forskalii = 75%) fell in the category of euconstant species occurrence range or their Fi was ≥75%. Many species lay in the constant range of occurrence (FOi = 50.1 to 75%), while very few species were regarded as accidental taxa whose Fi was less than 15% (Table 3). The 5 most abundant species S. schall (n = 283), Raiamas senegalensis (n = 245), S. serratus (n = 159) followed by Coptodon zillii (n = 155) and Clarias gariepinus (n = 152) accounted for approximately 36.6% of the overall numerical catch and about 40% of the total relative importance (IRI) (Table 3).
Summary of percentage by number (%N), weight (%W), frequency of occurrence (%FO) and relative importance index (%IRI) of fishes collected from Ayima, Gelegu and Shinfa Rivers of the ALNP.

Generally, based on numerical values (%N), about 79% of the overall itemized individuals were contributed by 16 species. These included S. schall (10.41%), Raiamas senegalensis (9.01%), S. serratus (5.85%), C. zillii (5.70), C. gariepinus (5.59%), O. niloticus (5.22%), Brycinus nurse (4.82%), L. bynni (4.82%), L. forskalii (4.82%), Schilbe mystus (4.38%), Labeo niloticus (3.94%), Alestes baremoze (3.46%), Auchenoglanis occidentalis (3.35%), Labeobarbus crassibarbis (2.65%), Heterotis niloticus (2.46%) and Labeobarbus intermedius (2.35%) (Table 3).
Analysis of the %IRI showed that 12 species had 77.51% of the overall collection. These included S. schall, C. gariepinus, S. serratus, L. bynni, L. forskalii, B. docmak, O. niloticus, Labeo niloticus, A. occidentalis, H. niloticus, C. zillii, and B. nurse which contributed 12.77, 12.32, 8.42, 6.93, 6.15, 5.48, 4.71, 4.60, 4.49, 4.16, 4.03 and 3.45%, respectively. Five species (Petrocephalus keatingii, Hyperopisus bebe, Marcusenius cyprinoides, Malapterurus minjiriya and Malapterurus electricus) with a small numerical contribution together accounted 0.20% of the total IRI (Table 3). The other remaining 26 species contributed an IRI of 22.29% altogether.
Highest number of individuals (n = 609) was counted for G1 throughout the whole sampling period, whereas lowest number of individuals (n = 277) was collected at S2. Seasonal (dry and wet) variation in the number of individuals was significant in A2, G1 and S1 (p<0.05) (Table 3).
Ayima River
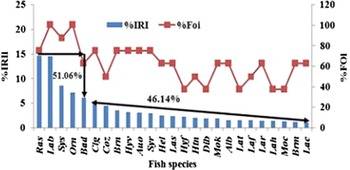
In Ayima River, 16 (45.71%) of the recorded fish species had the highest individual relative importance (2.05 to 14.69, %IRIi) comprising altogether 84.7% of the total IRI and were relatively frequently occurring species in both sampling sites and occasions (37.5 to 100, %Fi) (Figure 2). These included R. senegalensis, L. bynni, S. schall, O. niloticus, B. docmak, C. gariepinus, C. zillii, B. nurse, H. vittatus, A. occidentalis, S. serratus, H. longifilis, Lates niloticus, L. intermedius, H. forskahlii and H. niloticus in descending order of their relative importance. The first 5 species (14.29%) listed above made up over 51% of the total IRI (Table 3).
Illustrations showing indices of relative importance (%IRIi) versus frequency of occurrence (%FOi) for major contributing fish species with %IRIi>1.0 of the Ayima River.

Species acronyms: Ras (R. senegalensis), Lab (L. bynni), Sys (S. schall), Orn (O. niloticus), Bad (B. docmak), Clg (C. gariepinus), Coz (C. zillii), Brn (B. nurse), Hyv (H. vittatus), Auo (A. occidentalis), Syr (S. serratus), Hel (H. longifilis), Las (Lates niloticus), Hyf (H. forskahlii), Htn (H. niloticus), Dib (D. brevipinnis), Mok (M. kannume), Alb (A. baremoze), Lat (Labeo niloticus), Laf (L. forskalii), Lar (L. crassibarbis), Lah (L. horie), Moc (M. caschive), Brm (B. macrolepidotus) and Lac (L. cylindricus).
Gelegu River
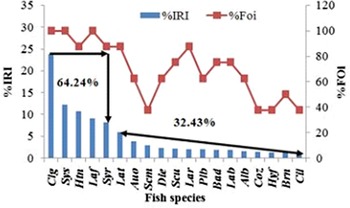
In the Gelegu River, 12 species (31.58%) contributed the largest relative importance (2.14 to 23.76, %IRIi) and comprised of altogether 85.87% of the total IRI and occurred in most sampling sites and occasions (62.5 to 100%) (Table 3; Figure 3). Species with the highest contribution in relative importance included C. gariepinus (100%, FOi), S. schall (100%, FOi), H. niloticus (87.5%, FOi), L. forskalii (100%, Fi), S. serratus (87.5%, Fi), Labeo niloticus (87.5%, FOi), A. occidentalis (62.5%, FOi), S. mystus (37.5%, FOi), D. engycephalus (62.5%, FOi), S. uranoscopus (75%, FOi), L. crassibarbis (87.5%, FOi) and P. bichir (62.5%, FOi) in descending order of their relative importance. Five species (13.16%) (C. gariepinus, S. schall, H. niloticus, L. forskalii, and S. serratus) made up 64.24% of the overall IRI (Figure 3).
The percentage of IRIi vs. %Foi for fish species with significant contribution in the fish assemblages of the Gelegu River (Species acronyms are similar as used in Figure 2 except for: Scm (S. mystus), Die (D. engycephalus), Scu (S. uranoscopus), Plb (P. bichir), Hyf (H. forskahlii) and Cil (C. latus)).

Shinfa River
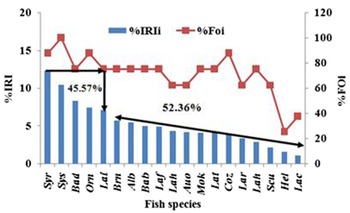
From the total of 25 identified species in the river, 17 species (68%) had the highest relative importance and accounted for 95.29% of the total IRI (Figure 4). The species with highest %IRIi from this river included S. serratus (87.5%, FOi), S. schall (100%, FOi), B. docmak (75%, FOi), O. niloticus (87.5%, FOi), L. intermedius (75%, FOi), B. nurse (75%, FOi), A. baremoze (75%, FOi), B. bajad (75%, FOi), L. forskalii (75%, FOi), L. bynni (62.5%, FOi), A. occidentalis (62.5%, FOi), M. kannume (75%, FOi), Labeo niloticus (75%, FOi), C. zillii (87.5%, FOi), L. crassibarbis (62.5%, FOi), L. horie (75%, FOi) and S. uranoscopus (62.5%, FOi) in descending order of their relative importance (Figure 4). Five species (20%) (S. serratus, S. schall, B. docmak, O. niloticus and L. intermedius) accounted for 45.57% of the total IRI from Shinfa River (Figure 4).

Fish community structure
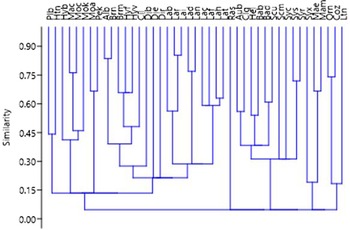
Figure 5 depicts the dendrogram illustration of species abundance based on the average paired group algorithm method (UPGMA) as a function of Bray-Curtis similarity index to expound the similarity matrix.
Unweightedpaired group method with arithmetic means dendrogram of fish species of the three rivers (6 sites) from the ALNP. Clustering was based on spatial fish assemblage as a function of Bray-Curtis similarity of fish community abundance data showing resemblance of fish assemblage structure among the sampling sites (at Coph. corr. = 0.8292).

Species acronyms: Plb- Polypterus bichir; Htn- Heterotis niloticus; Hyb- Hyperopisus bebe; Mac- Marcusenius cyprinoides; Moc- Mormyrus caschive; Mok - Mormyrus kannume; Moa- Mormyrops anguilloides; Pek- Petrocephalus keatingii; Alb- Alestes baremoze; Brn- Brycinus nurse; Brm- Brycinus macrolepidotus; Hyf- Hydrocynus forskahlii; Hyv- Hydrocynus vittatus; Cil- Citharinus latus; Dib- Distichodus brevipinnis; Die- Distichodus engycephalus; Dir- Distichodus rostratus; Lab- Labeobarbus bynni; Lar- Labeobarbus crassibarbis; Lai- Labeobarbus intermedius; Lad- Labeobarbus degeni; Lan- Labeobarbus nedgia; Lat- Labeo niloticus; Lac- Labeo cylindricus; Laf- Labeo forskalii; Lah- Labeo horie; Ras- Raiamas senegalensis; Auo- Auchenoglanis occidentalis; Clg- Clarias gariepinus; Bab- Bagrus bajad; Bad- Bagrus docmak; Syc- Synodontis clarias; Sys- Synodontis schall; Syr- Synodontis serratus; Syx- Synodontis sorex; Mae- Malapterurus electricus; Mam- Malapterurus minjiriya; Scm- Schilbe mystus; Scu- Schilbe uranoscopus; Orn- Oreochromis niloticus; Coz- Coptodon zillii; Las- Lates niloticus.
Agglomerative hierarchical cluster analysis (AHCA) of 43 fish species identified two distinct spatial clusters representing Shinfa and Ayima sampling sites on one hand and the Gelegu sites on the other. SIMPER produced an overall average Bray-Curtis dissimilarity of 60.83% between the three rivers’ fish communities. About 17 (39.5%) fish species accounted for 51.17% dissimilarity between the three rivers’ fish communities. These included C. gariepinus, S. mystus, R. senegalensis, D. rostratus, L. bynni, H. niloticus, S. schall, A. occidentalis, L. forskalii, D. engycephalus, Labeo niloticus, S. uranoscopus, O. niloticus, A. baremoze, B. nurse, L. cylindricus and L. horie. The vast remaining 26 (60.5%) fish species contributed to 48.83% dissimilarity between the rivers.
Between Ayima and Gelegu Rivers, the overall average dissimilarity was calculated and found to be 60.01%, of which 62.19% of the dissimilarity was contributed by 8 species (R. senegalensis, S. mystus, C. gariepinus, S. schall, L. bynni, S. serratus, O. niloticus and H. niloticus). Between Ayima and Shinfa Rivers, the overall average dissimilarity percentage was 48.09 and 51.24% of this dissimilarity was contributed by only 4 species (R. senegalensis, L. bynni, C. zillii and H. forskahlii). But, SIMPER produced 49.97% average dissimilarity between fish communities of the Gelegu and Shinfa Rivers and 51.22% of this dissimilarity was contributed by 5 fish species (C. gariepinus, S. mystus, S. schall, H. niloticus and O. niloticus).
Gradient lengths of all axes were shorter than 3 SD turnover units in DCA (Table 4), suggesting linear species response model and RDA was used for ordination. Only DO, total phosphorus (TP) and channel diameter (CD) over other environmental variables largely affected the ordination and species community structure in RDA based on the assessment of variance inflation factor (VIF<20). These environmental variables were retained as significant contributors to the RDA model while the vast remaining was redundant or did not increase the significance.
Summary of detrended correspondence analysis (DCA) for fish community structure.

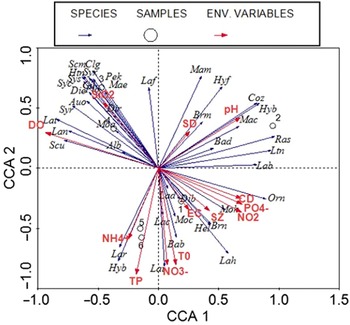
Figure 6 showed an RDA triplot of 43 fish species, 6 sampling sites and 14 environmental variables. Table 5 summarized output of the RDA analysis. The first two axes (Axis 1 & 2) represented 79.7% of the total variability in species composition with the four environmental variables accounting for 70.9% of the total variability in the structure of fish community. The results of the RDA analysis showed that eigenvalues of the first axis (λCC1) and second axis (λCC2) were 69 and 24%. CCA2 and CCA4 axes accounted for 79.7% and 96.5%, respectively, of the cumulative variation in the environmental data (Table 5). The final model accounted for 77.2% of the total variance in fish composition, and all canonical axes were significant (Monte Carlo test, p = 0.002) (Table 6).
The species-environment-site RDA triplot of fish community for the Rivers Ayima (1-A1 & 2-A2), Gelegu (3-G1 & 4-G2) and Shinfa (5-S1 & 6-S2). The length of the arrow is proportional to the importance of that variable in the assemblage ordination. For fish species abbreviations, see Figure 5.

Results of the RDA for the species-environmental data including eigenvalues, correlations and percentage of variance explained by the four canonical axes (CCA1, CCA2, CCA3 and CCA4); T. In. = total inertia; sp-env = species-environment.

Summary of Monte Carlo permutation test (p = 499) for the strength of variability in fish assemblages explained by each environmental variables in the constrained ordination listed after the automatic forward selection. The p values and F-statistics were obtained by Monte Carlo test (499 permutations). See Table 2 for explanation of abbreviations.

* environmental variable with significant effect on fish community structure, p < 0.05.
The ordination space of factors Axis1 (CCA1) and Axis2 (CCA2) were characterized by many of the environmental variables and fish species composition or relative abundance. The first factor load (CCA1) was correlated positively with most of the nutrients, T0, EC, CD and site depth. On the other hand, DO was positively correlated with CCA2 (Figure 6). Many species collected from G1 and G2 laid in the positive wing of CCA2 which is characterized by a higher DO. Major environmental gradients related to the structuring of fish communities involved site depth, CD, TP and DO, whereas EC, Secchi depth, silicate (SiO2) and ammonium ion (NH4 +) played a minor role for fish community structuring in the floodplain rivers (Table 6).
Discussion
The present study showed that variations in fish abundance and community structure were related to some environmental variables. Major environmental gradients related to the structuring of fish communities involved site depth, CD, TP and DO, whereas EC, Secchi depth, SiO2 and NH4 + played a minor role. Amount of DO was higher in both sampling sites of the Gelegu River. This might be due to the constantly flowing nature of the river, while other sampling sites in Ayima and Shinfa are somehow stagnant during the dry season and unable to bind atmospheric oxygen. The higher EC value was recorded for S1 at Shinfa River. This is because the site is largely used by the nearby residents as a waste discharging field. In addition, the river originates from highland areas and a large volume of floods during rainy months carried soluble ions from farm lands to Shinfa River that could be attributed to the higher EC of S1.
The pH values of the present study showed similarity in all sites of the studied rivers. Very similar pH values of different sites for Ayima and Shinfa were reported by Tewabe et al. (Reference Tewabe, Getahun and Dejen2010). High pH value at A2 might be due to port and extreme human interference in the river. Human activities as a trigger for high pH value in rivers are reported by Hossain et al. (Reference Hossain, Das, Sarker and Rahaman2012) for sections of Meghna River in Bangladesh.
The greater seasonal variation between dry and wet months is attributed to the higher temperature range in the sampling sites of Shinfa River. The lower altitudinal range and higher atmospheric temperature also attribute to high water temperature in floodplain rivers (Hossain et al. Reference Hossain, Das, Sarker and Rahaman2012). Different and similar temperature ranges were obtained for Shinfa and Ayima Rivers, respectively, by Tewabe et al. (Reference Tewabe, Getahun and Dejen2010) from different sections of the rivers. This difference in temperature ranges of the Shinfa River in the present and previous studies may be due to the increasing human impact operating on many segments of the river. The other possible reason for such difference might be associated with the frequent prone on physical and chemical characteristics of floodplain habitats due to global warming. However, water temperature variation showed less impact on species distribution as value of this parameter was more or less similar in all sampling stations (P = 0.108), while significant difference was found for transparency and DO concentration.
Water transparency taken as a function of rainfall pattern was maximum during the dry month (April) and smaller in the wet month (October). The highest rainfall is in July and August, while there is no rain from December to April and this may be the cause for the significant difference in water transparency. During rainy months of the year, large quantities of soluble organic matter enter into the main channel of the river and bring turbidity and hence reducing water clarity (Weilhoefer et al. Reference Weilhoefer, Pan and Eppard2008).
Generally, in CCA1, the rivers’ fish community structure associated positively with NO3 −, PO4 2− T0 and site depth while TP and NH4 + demonstrated negative correlation with fish and environmental associations (Figure 6). On the other hand, DO, pH and water transparency vary significantly between the sampling sites and they account for significant variance of fish community compositions.
Considerable variations were observed in fish species composition and abundance in the sampling stations of the studied rivers. Highest number of fish individuals was collected at G1, and this may be due to relatively low human interference that brought optimum range of environmental conditions suitable for fishes. The smallest CD and depth of this site appropriate for fish sampling might be the reason for catching many specimens as well. But, in both sampling sites of Shinfa River, lowest number of individuals was collected. This might be due to severe human interference and predation pressure posed by the high population of crocodiles in the river. Welcomme (Reference Welcomme1979) and Khalid et al. (Reference Khalid, Al-Badawi and Mohamed-Salih2016) observed such variations in relative abundance of fish population of similar ecosystems. In terms of their relative abundance, a few species dominated the ichthyofaunal compositions of floodplain rivers in the ALNP.
The family Mochokidae represented by a single genus and 4 species was the most abundant. Species of this family form ‘species flock’ in African inland water habitats (Le´veˆque et al. Reference Lévêque, Oberdorff, Paugy, Stiassny and Tedesco2008), and some species of this genus are also common in the Ethiopian lakes and rivers. In the family, the genus Synodontis is endemic to the Sub-Saharan Africa and the Nile River (Wright & Page Reference Wright and Page2008) and is the most abundant genus in fluvial habitats (Halim & Guma’a Reference Halim and Guma’a1989) and forms a small radiation in lakes (Day et al. Reference Day, Bills and Friel2009). In the genus, S. schall which is a common food fish in the Nile (Luff & Bailey Reference Luff and Bailey2000) was reportedly dominating the catch of many water bodies in Ethiopia (e.g., Vijverberg et al. Reference Vijverberg, Dejen, Getahun and Nagelkerke2012; Wakjira Reference Wakjira2016). Bony head plates and heavily serrated spines in Synodontis that serve as a locking function to deter gape-limited predators may attribute to the higher abundance of the species. Similarly in many rivers of the tropical Africa, for example in the Djiri River of Congo (Mikia et al. Reference Mikia, Mady-Goma, Tsoumou, Mabanza, Vouidibio and Diatewa2013) and Benue River in Nigeria (Akombo et al. Reference Akombo, Akange and Adeyemi2016) found that S. schall was more abundant and available year round in local markets.
The African catfish C. gariepinus was also abundant in the present collection. This agrees with the study of Khalid et al. (Reference Khalid, Al-Badawi and Mohamed-Salih2016) in which the catch of this species dominated the Dinder River in Sudan. This might be due to its well-suited adaptation to oxygen poor habitats by possessing accessory breathing organs to utilize atmospheric oxygen (Van Neer Reference Van Neer2004). The availability of different prey types and optimum foraging behaviour (i.e., opportunistic feeding) of C. gariepinus in floodplain rivers might have also been attributed to the high relative abundance. According to Bruton et al. (Reference Bruton, Skelton and Merron1984), fishes in larger and relatively stable water bodies showed feeding specialization, whereas those in the floodplain ecosystems are opportunistic feeders. C. gariepinus is a generalist feeder that can consume any prey (e.g., Dadebo et al. Reference Dadebo, Aemro and Tekle-Giorgis2014; Admassu et al. Reference Admassu, Abera and Tadesse2015; Eyayu Reference Eyayu2019), and therefore, food will not be a limiting factor for the distribution and abundance of this species in the floodplain rivers of the ALNP. The relative abundance of C. gariepinus was higher during the dry season in the present study. In accordance with the present finding, Welcomme (Reference Welcomme1979) found that the feeding behaviour of piscivorous fish is seasonal in river floodplains and their relative abundance increases during the dry season. The absence of competitive and top predators such as Lates niloticus in the Gelegu River might be also another possible reason for the higher abundance of C. gariepinus.
L. bynni and H. niloticus are swamp fishes, and they frequently appeared in floodplain rivers during the present catch. These two species are opportunistic feeders (Beetz Reference Beetz2004; Eyayu Reference Eyayu2019) but preferably consume aquatic plants and detritus. These food types are frequently infested in floodplain rivers and provide suitable conditions for them to feed and breed (Welcomme Reference Welcomee1985). On the other hand, cyprinids belonging to the ‘floodplain dwellers’ (Van Neer Reference Van Neer2004) have the haemoglobin for highest affinity for DO in oxygen poor river floodplains (Fish Reference Fish1956). Therefore, such intricate physiology for binding oxygen in water favoured them to adapt to the constantly changing floodplain habitats. H. niloticus, which is the primitive Osteoglomorpha, can adapt oxygen poor environments by making nests down to sediments (Odo et al. Reference Odo, Nwani and Eyo2009; Adite et al. Reference Adite, Winemiller and Fiogbè2006). In peculiarity, H. niloticus possesses externally projecting gill filaments with a respiration and a food absorption function (Hermens et al. Reference Hermens, Daffé and Vandewalle2007). Because of these features and behavioural responses, the species had a considerable abundance in the present catch. The other probable reason for higher abundance of H. niloticus might be due to its detritivore feeding habit which is always the available food in river floodplains (Eyayu Reference Eyayu2019).
Individuals of the Cichlidae and Mormyridae were less frequently observed in the catches of the present study and relatively less important in abundance. This may be due to the frequent predation posed by C. gariepinus, Hydrocynus spp. and Bagrus spp. in the rivers. Similar to the results of the present findings, in the work of Melak and Getahun (Reference Melak and Getahun2012) and Melaku et al. (Reference Melaku, Getahun and Wakjira2017), the relative importance of O. niloticus was insignificant in floodplain rivers of the White Nile Basin (Ethiopia). However, in contrast to the present study, O. niloticus was more abundant in Koka Reservoir (Ethiopia) (Assaminew Reference Assaminew2005), Lake Langeno (Ethiopia) (Temesgen Reference Temesgen2017) and in the Dinder River (Sudan) Khalid et al. (Reference Khalid, Al-Badawi and Mohamed-Salih2016). In fact, the gut content analysis of piscivorous species (C. gariepinus, B. docmak and H. forskhalii) in the present study confirmed more B. nurse, cichlids and Synodontis spp. as important fish prey than mormyrids. However, Merron (Reference Merron1993) found that C. gariepinus practise pack-hunting on mormyrids when the floods cease in rivers and this led to the smaller relative abundance of mormyrids. This might be important when preferred prey items go down to a critical level and certain fish species alter their diets which enables them to minimize intraspecific competition (Zahorcsak et al. Reference Zahorcsak, Silvano and Sazima2000; Rossi Reference Rossi2001).
The occurrence and relative abundance of members of the Alestidae family, among the largest groups of the Nile fishes, was small in the present catch. This is supported by the study of Khalid et al. (Reference Khalid, Al-Badawi and Mohamed-Salih2016) who reported small numbers of individual catches from representatives of this family in the Dinder River. Even though variability of floodplain habitats provides a wide range of possible food organisms and substrates from allochthonous and autochthonous sources (Welcomme Reference Welcomme1979), however, many fishes have been suffering from searching prey (Tiogué et al. Reference Tiogué, Tomedi, Nguenga, Tekou and Tchoumboué2014). Similar cases can be taken as a limiting factor for the distribution and abundance of the fast swimming carnivorous fishes of the Alestidae in the floodplain rivers of the ALNP. Their confinement to pool water sections may not support species of this family with sufficient food supplies and they migrate to riffle habitats to feed on other small fishes and insects (Khalid et al. Reference Khalid, Al-Badawi and Mohamed-Salih2016). Thus, sampling of such fishes in running waters usually needs special fishing equipments and our fishing gear might not be effective to sample these active swimmers in riffle habitats and thus small in numerical abundance. The relative abundance of A. occidentalis was considerable. A strong pectoral spine deters incidence of predation and attributed to the higher abundance of this species in the present catch. Members of the families Malapteruridae, Polypteridae, Citharinidae, Latidae, Distichodontidae, Cyprinidae (except L. bynni and R. senegalensis) and Schilbeidae (except S. mystus) were present relatively in small numbers and their numerical contribution in the present catch can be taken as insignificant. In contrast to the floodplain dwellers, ‘open water species’ usually do not adapt floodplain habitats and only small specimens of these species can be captured from such water bodies (Van Neer Reference Van Neer2004).
The difference in individual fish numbers between rivers of the same basin in the present study may be attributed to the size of the river and its tributaries Welcomme (Reference Welcomme1979). Variability in water level also contributed for the differences in species abundance in river floodplains. Because of seasonal changes following rainy and dry season sequence, the group of rivers in the ALNP is characterized by a greater hydrological variability, in which water levels rise but fall gradually just after the rains. At the landscape scale, these events in floodplain rivers drive numerous critical ecological processes that structure fish communities (Simasiku & Mafwila Reference Simasiku and Mafwila2017). Fish stock biomass in temporary rivers is dynamic showing irregular variations induced by fishing, natural mortality and habitat modifications during the extended dry season. Environmental cues that trigger seasonal fish reproduction might have also been attributed to the higher abundance of fishes during the dry months. Therefore, it is not unusual to obtain varied abundance estimates for fishes in floodplain habitats depending on the stage of the flood cycle during which the samples are collected.
Conclusion
In the present collection, C. gariepinus and some species of Synodontis were more abundant. However, the commonly dominant individuals of the cyprinids and cichlids in many Ethiopian water bodies were few in the studied rivers. The analysis of AHCA suggested possible differences between the Abbay Basin (Ayima and Gelegu Rivers) and the Tekeze Basin (Shinfa River) fish communities, with 17 dominant species causing the major variations among the rivers. In SIMPER, it was also found that the Gelegu River fish community was largely composed of the most dominant species in terms of their relative abundance, followed by the Ayima, while the Shinfa River community was composed of relatively few important species. The main factors that explained most and statistically significant variance between the fish communities in the rivers were DO, river channel length, site depth, water transparency and some nutrients. Although some other potential fish community structuring factors such as fishing pressure, predation and competition, and habitat suitability need to be explored further, the results of this study are important to catalogue information for biodiversity conservation and sustainable utilization of riverine fisheries in Ethiopia.
Acknowledgements
The authors would like to acknowledge Mr Ashagrie Fetene for his help during sampling. This work is a part of a PhD and has received limited financial support from the Addis Ababa and Debre Berhan Universities.