‘Americans should know where their Representatives stand on the issues before going into the voting booth. But Speaker Pelosi and Senator Reid have delayed dealing with a number of far-reaching and controversial issues until after Election Day precisely so Democrats do not have to reveal to the electorate their support for more trillion dollar deficits, tax hikes on families and small businesses, and a job-killing national energy tax.’
–Statement by Rep. Tom Price (R-GA) in support of a resolution he introduced to block the use of the lame-duck session to pass non-emergency legislation
Political parties have a conflicted existence in many democratic systems.Footnote 1 On the one hand, voters rely heavily on party labels at the voting boothFootnote 2 and reward parties for legislative successes.Footnote 3 Thus there are clear incentives for party coalescence. Yet on the other hand, voters punish individual legislators for partisan behavior,Footnote 4 which in turn discourages party co-operation. How, then, do legislators navigate these countervailing incentives? We theorize that legislators, both individually and collectively, balance these competing demands by adopting a dynamic approach to partisanship.
In this study, we investigate the effects of competing demands on elite partisanship in the context of the US House of Representatives. We find that legislators, at the individual and collective levels, balance competing demands by strategically adjusting their levels of partisanship depending on the time to the next election. Specifically, legislators place greater weight on partisan goals when elections are distant, and are increasingly attentive to constituency demands as elections approach. While our substantive focus is the US House, this should not detract from the broader theoretical argument: the presence of countervailing incentives encourages partisan behavior that is sensitive to the variable costs and benefits of co-operation over time. This basic framework provides leverage to help understand legislative behavior in numerous other contexts. Indeed, recent comparative studies have offered evidence that politicians across various political systems face analogous competing demands that place party and electoral goals at odds with one another.Footnote 5 The comparative research on party switching also supports the notion that legislators strategically adjust their policy positions for electoral gain.Footnote 6 Finally, there is strong reason to believe that even in electoral systems with a negligible personal vote component, parties must still balance competing demands from voters and other principals.Footnote 7
Our empirical findings point to two related forms of dynamic partisanship in the US House: (1) decreasing party loyalty among individual members and (2) corresponding conflict avoidance in the selection of roll-call votes by majority parties as elections approach.Footnote 8 As a result, parties in the US House start out with a high level of conflict at the beginning of the election cycle, which dissipates as elections approach and the costs of partisan behavior rise. These findings directly contribute to the important and growing literature on the linkages between elections and legislative behavior.Footnote 9 At the same time, we identify dynamics that have important implications for policy formation.
The article proceeds as follows. The next section places our study within the research on congressional parties. We believe that the literature has overlooked an important form of partisan variation – changes occurring between congressional elections. In particular, we make the theoretical case for time-dependent variation in partisanship and derive testable hypotheses. In the second section, we describe our data and methods for the member-level and agenda setting analyses. We then examine partisan behavior as a function of election proximity. The empirical evidence shows that members are less likely to exhibit partisan behavior, and parties are less likely to schedule votes that divide the parties, as elections approach. We offer some concluding remarks in the final section.
Dynamic Elite Partisanship
One of the central puzzles of legislative research is the varying role of parties in the US Congress. The influence and cohesion of congressional parties varies greatly over time,Footnote 10 across issues and vote types,Footnote 11 and between members.Footnote 12 In the United States, changes in the prominence of parties over time have been attributed to variation in the internal homogeneity of party members’ policy preferences and the level of disagreement between the parties.Footnote 13 According to the conditional party government thesis, these factors have important implications for party organization in general and the influence of party leaders in particular.Footnote 14 Another perspective, which emerged in response to criticism of the conditional party government framework,Footnote 15 highlights legislators’ electoral incentives to co-operate with their party and to empower party leaders.Footnote 16 By this account, parties do not seek to maximize policy returns per se, but rather attempt to advance the electoral fortunes of their members by cultivating a favorable party ‘brand’.
Regardless of whether one conceptualizes parties as primarily legislative or electoral coalitions, the prominent partisan accounts acknowledge the importance of both policy and electoral goals to members and parties alike.Footnote 17 Despite the well-documented tension between the individual and collective pursuit of these goals,Footnote 18 in which collective efforts (via parties) may prove detrimental to the realization of these goals at the individual level and vice versa, most studies do not examine the implications that these potentially conflicting forces have for partisan behavior.Footnote 19 In fact, Smith contends that partisan theories that fail to fully account for the existence of multiple goals “do not capture central activities of congressional parties.”Footnote 20 It is then quite possible that, in addition to other catalysts of partisan change (for example, preference homogeneity), partisan behavior reflects the strategic balancing of these goals over time. According to this logic, parties shift emphasis from collective to individual goals and vice versa as a function of the comparative costs of pursuing these goals at any given point in time (by which, crucially, we mean not just across Congresses, but also within congressional terms). Below, we make the case for studying changes in partisanship in a more explicitly dynamic fashion than previously explored in the literature.
In particular, we argue that variation in elite partisanship between elections is the product of both individual and collective considerations. Member-level party support is likely to wane on partisan measures as elections approach, due to individual electoral motivations. Moreover, we also expect parties to reinforce this behavior by strategically setting the agenda to accommodate their members’ concerns about casting difficult votes when the electoral costs of doing so are highest.
As a step toward understanding the time dependency of elite partisanship, we begin by considering the various constraints present in member-level decision making. In particular, members encounter multiple – potentially competing – demands in the pursuit of their goals.Footnote 21 Foremost among these are demands by voters, to whom individual members must appeal in order to gain reelection. Political parties also play a central role in members’ decision-making calculus by serving as the collective units that (1) facilitate policy goals via repeated co-ordinationFootnote 22 and (2) forge reputations that offer members collective electoral benefits.Footnote 23 Party loyalty is also a key determinant of institutional advancement,Footnote 24 which further bolsters members’ legislative and electoral successes. Despite these advantages of party support, there is compelling evidence that party loyalty has damaging effects on electoral prospects at the individual-member level.Footnote 25 Thus members are forced to strategically balance their levels of partisanship over time so as to capitalize on the returns to partisan behavior without incurring the associated electoral sanctions.
Moreover, the costs and benefits of partisan behavior are perhaps most pronounced on votes that generate interparty disagreement. On the one hand, members stand to reap the greatest legislative (that is, policy) and electoral (that is, reputational) returns from party successes on contested votes.Footnote 26 Yet on the other hand, members’ decisions on votes that divide the parties weigh heavily in constituent assessments of their party loyalty.Footnote 27 Therefore the tension created by incentives that both promote and discourage party coalescence is palpable on divisive votes. Of course, members whose districts have clear partisan tendencies that align with their party are somewhat less susceptible to these countervailing forces. However, even under such harmonious conditions, we would still expect cross-cleaving issues to arise as parties struggle to pass (or block) major initiatives (for example, health care reform in 2009–10), enact legislation that is necessary but not popular (for example, the stimulus package in 2009 or the ‘fiscal cliff’ deal in 2012–13), satisfy major interest groups aligned with the party or follow through on intraparty log rolls. Furthermore, even constituents with strong party affiliations remain punitive when presented with a representative who exhibits what they perceive to be excessive partisan behavior.Footnote 28
How members balance these competing forces is logically related to the proposition that electoral penalties for partisan behavior are dynamic. Specifically, a legislator's cost for partisan behavior is likely to be higher when voters more closely monitor her legislative activities.Footnote 29 Generally speaking, monitoring by voters is imperfect due to collective action problems, information costs and memory decay.Footnote 30 However, elections increase the visibility of legislative behavior, which in turn facilitates monitoring by reducing the associated costs.Footnote 31 This is a variation on the ‘What have you done for me lately?’ principle identified by Shepsle et al.Footnote 32 Just as voters pay more attention (and give more credit) to legislators for pork barrel projects unveiled when elections are near, they pay more attention to legislative votes as elections draw near.Footnote 33 Previous research has also shown that voters assign greater weight to more recent votes when assessing a member's performance.Footnote 34 Accordingly, voters may not only recall recent legislative activity more easily; they might also consider recent votes a more reliable measure of a member's future behavior than earlier actions. Thus, we arrive at the assumption that monitoring of legislative voting by voters increases as the time until the next election decreases.Footnote 35
Therefore, since voters respond negatively to party loyalty and are more attentive to (and aware of) their representatives’ legislative behavior as elections approach,Footnote 36 we conclude that individual electoral considerations will increasingly supplant the collective benefits of partisanship in members’ decision-making calculus over the course of the election cycle. The following Party Support Proposition summarizes this time-dependent dynamic at the individual level.
Party Support Proposition: As the time to election decreases, legislators will be less likely to side with their party on votes that divide the parties.
By extension, we also conclude that member behavior on votes that do not divide the parties should be less affected by election proximity. Quite simply, interparty consensus mitigates the tension between the individual and collective goals we theorize about, in part because non-divisive votes convey little information about a member's partisanship. Consequently, there is less incentive for members to strategically moderate their party support on non-divisive votes as elections approach. In its strongest version, the corollary to the Party Support Proposition suggests that the likelihood that members will support their party on non-divisive votes should be constant throughout the election cycle. A slightly weaker prediction is that any decline in members’ party support on non-divisive votes should be significantly less pronounced than that observed for votes that generate interparty division. We summarize our prediction about non-party votes in the following corollary.
Party Support Corollary: Compared to votes that divide the parties, the likelihood that legislators will side with their party on non-divisive votes will be relatively constant throughout the election cycle.
Collectively, votes that generate interparty disagreement confer benefits to political parties, and the majority party in particular. Not only are these votes the outgrowth of parties pursuing the legislative goals of a majority of their members, but they are also central to the parties’ collective reputations.Footnote 37 Notwithstanding these goals, party leaders must be sensitive to member-level constraints.Footnote 38 In particular, party leaders, as agents of the rank-and-file membership, must be judicious in demanding legislative behavior that is contrary to members’ electoral interests.Footnote 39 The majority party is likely to incur electoral and/or legislative losses if its party leaders make excessive and indiscriminate requests for party support from rank-and-file members, not to mention the possibility that party leaders will lose their coveted leadership posts. Thus party leaders, like individual members, have to balance competing forces by adopting a strategy that maximizes the collective gains from party support while minimizing the member-level repercussions.Footnote 40
In 2010, for instance, the Democratic leadership quite openly postponed consideration of an inevitably contentious vote on extending the Bush tax cuts until after the election, in an effort to protect party members from having to make a potentially unpopular decision with elections right around the corner.Footnote 41 Instead, the issue was voted on soon after the elections. Rep. Tom Price's (R-GA) call to abandon the lame-duck session (quoted at the beginning of this article) was made in response to the Democratic leadership's strategic agenda setting decisions with respect to the Bush tax cuts and other legislative initiatives. Price's comments reflect an awareness of the time sensitivity of legislative decisions relative to elections. We summarize the time-dependent dynamic at the party level in the following Agenda Setting Proposition.
Agenda Setting Proposition: As elections approach, majority party leaders will be less likely to schedule proposals that divide the parties.
In the next section, we discuss the empirical models we use to test the Party Support Proposition, the Party Support Corollary and the Agenda Setting Proposition. Our empirical approach is based on studying roll-call votes to show that partisan behavior, both individually and collectively, is highly dynamic.
Data and Methods
We examine temporal variation in House members’ support for their party, and search for evidence of corresponding agenda setting adjustments made by House majorities between the 84th and 108th Congresses (1955–2004). We proceed with separate member- and party-level analyses so as to evaluate whether there are independent (yet reenforcing) individual and collective dynamics at work, as suggested by the above theoretical propositions. This approach not only uncovers the existence of dynamic elite partisanship, but also identifies the sources of partisan variation. We address member-level effects in the following subsection before turning our attention to the agenda setting effects.
Member-level Analysis
As a first step, we explore whether members modify their party support according to election proximity. In particular, we test for variation in party support that reflects an awareness of the collective benefits and electoral costs of party loyalty. While our empirical analysis includes all available roll-call votes during the period of analysis, we distiguish between divisive and non-divisive votes to account for the difference in predictions made by the Party Support Proposition and its corollary. Therefore we identify roll-call votes in which a majority of one party votes in opposition to a majority of the other party (that is, party votes). Based on our theoretical predictions, we expect that a member's support for her party on party votes will decline with election proximity, while her party support on non-party votes will be largely unaffected by electoral dynamics.
Party votes are widely used as the basis of various measures of congressional partisanship (for example, party unity scores). Unlike other votes, they establish discernible and conflicting party positions. Since party votes generate party divisions, which signify core party differences (that is, issues motivating party coalescence),Footnote 42 the outcomes of these votes have meaningful implications for the parties’ collective reputations. For both policy and electoral reasons, party leaders have an incentive to exert greater pressure on rank-and-file members on these votes than on less divisive ones. Yet we also know that party votes significantly influence voters’ appraisals of members’ partisanship, and increasing aggregate party support on these votes has been shown to negatively affect members’ electoral prospects.Footnote 43 Therefore members’ voting behavior on party votes offers valuable insight into the balance that members strike between competing collective (party) and individual (constituent) demands over the course of an election cycle.
To explore temporal variation in party support, we construct our dependent variable by identifying whether members voted with or against the majority of their party for all recorded roll-call votes in the US House during the period of analysis (n = 20,450), coding party support as 1 and defection as 0.Footnote 44 The key independent variable(s) throughout this and later stages of the analysis are polynomial terms for the duration of time (measured in days) between the vote and the next election.Footnote 45 We also include a dummy variable for party votes, defined as votes in which a majority of one party votes in opposition to a majority of the other party, and interact this Party Votes dummy variable with the polynomial terms of time. Jointly, these variables provide information regarding the extent to which party support varies with election proximity across party and non-party votes (testing the Party Support Proposition and its corollary). To identify the appropriate functional relationship between party support and the timing of votes, we use the Akaike Information Criterion (AIC) to determine the order of the polynomial for days until the next election that best fits the data.Footnote 46 We note that, despite using the same evaluation process across all models, the optimal order of the time polynomial is permitted to vary across models due to differences in the underlying data structure. We further note that using splines instead of polynomials yields functional forms on the predicted probabilities of party support that are substantively similar to the results shown below (results from alternative specifications are available in the online appendix).
We also include a number of control variables that account for differences in members’ levels of electoral insulation/vulnerability. The variable Retirement identifies members who decided to retire during the Congress of observation. When members decide to retire, they sever both electoral and partisan connections that may have previously compelled them to behave differently than they would in the absence of such constraints.Footnote 47
In addition, we include a variable that taps members’ ideological extremism (Ideological Extremism), operationalized as the absolute value of their first-dimension DW-NOMINATE score.Footnote 48 The variable accounts for the different policy costs that members incur when voting with their party on divisive votes. Since the first dimension is most closely associated with interparty conflict, it effectively captures how (in)consistent a member's (potentially induced) preferences are with the center of her party. Members situated near the center of the policy continuum have preferences that are at odds with the majority of their fellow partisans. Conversely, we would expect ideological extremists to have fewer electoral constraints associated with party voting, given the natural congruence between their policy preferences and their party's policy positions.
The variable Seniority measures a member's chamber seniority and accounts for the possibility that members enjoy greater electoral insulation with more years of service. We also include a number of variables that capture the competitiveness of a member's previous election. Lagged Vote Share measures the incumbent's percentage share of the two-party vote in the previous election. Lagged Quality Challenger is a dichotomous measure indicating whether the incumbent faced a quality challenger – defined as a candidate who has held previous elective officeFootnote 49 – in the previous election. Lagged Spending Gap is measured as the natural logarithm of challenger expenditures less the natural logarithm of incumbent expenditures.Footnote 50
Lagged District Partisanship is measured as the share of the two-party vote that the presidential candidate belonging to the member's party received in her congressional district in the previous presidential election. This is an often-used measure of district partisanship.Footnote 51 While voters broadly oppose intemperate forms of party loyalty,Footnote 52 we account for district partisanship, since some legislators are surely more susceptible to reprisal than others. We also include an indicator variable, In-party Midterm, which accounts for membership in the president's party in midterm election cycles. This captures any adjustments in partisan behavior that in-party members make in anticipation of the well-documented midterm loss.Footnote 53 Each of these member-level variables can be considered a signal to members regarding their relative electoral security.
In one of the member-level models reported below, we use a composite factor score of the control measures, Member-level Characteristics (Factor Score), instead of including each of the individual variables. Increasing values of this measure indicate increasing electoral insulation.Footnote 54 To explore whether electoral vulnerability enhances the effect of time on the probability that a member will support her party (on party and non-party votes), we interact the composite factor score with the constitutive (un-interacted) polynomial terms of time, the Party Votes variable and the polynomial terms interacted with Party Votes. This approach makes the results easier to interpret, since it significantly reduces the number of interaction terms needed (that is, we avoid having to interact every member-level measure with the aforementioned variables).Footnote 55
Since one might suspect that party adjustments of the agenda that are consistent with our expectations could affect our measurement of member-level behavior, we include additional controls to account for variation in the agenda. In other words, if parties, as hypothesized, schedule more consensual votes as elections approach, then it is conceivable that we might observe declining party support on party votes as a result of the types of votes being considered. However, using observed voting divisions to control for variation in the divisiveness of the agenda would, by definition, obscure the effect we seek to examine.
We account for the possible effects of agenda change by exploiting the fact that some types of votes are more likely than others to generate interparty disagreement. Suspension of the rules, for instance, requires two-thirds support for passage, which is why these votes tend to be held on measures that are relatively non-controversial. We include dummy variables (Vote-type Fixed Effects) for the six vote type categories (minus a reference category) introduced by Crespin, Rohde and Vander Wielen:Footnote 56 regular passage of bills, passage under suspension of the rules, miscellaneous passage (final passage of measures that do not require the president's signature), amendments, partisan procedural votes (for example, special rules and motions to recommit) and miscellaneous procedural votes.Footnote 57 Crespin, Rohde and Vander Wielen show that these categories are substantially related to levels of observed interparty conflict. By controlling for vote type, as opposed to controlling for observed voting behavior, we employ a measure of interparty conflict that is exogenous to the behavior of interest. Moreover, it has also been shown that variation in party cohesion is related to changes in the issue content of the agenda,Footnote 58 and so we likewise include dummy variables (Issue-type Fixed Effects) for the nineteen major topic categories identified by the Policy Agendas Project.Footnote 59
Finally, we include dummy variables for Congresses (Congress Fixed Effects) in order to capture any systematic differences in partisan behavior that might be due to circumstances specific to particular Congresses.Footnote 60 Including Congress fixed effects also allows us to explore whether legislative behavior systematically changed over the period of analysis.
We estimate the probit model of member i's party support on vote v, shown in Equation 1, both with and without control variables, where α is the intercept term, x
i
denotes the vector of control variables for member i (with corresponding vector of coefficients, β) and z
v
the vector of control variables for vote v (with corresponding vector of coefficients,
 $$\[--><$>\bigamma<$><!--$$
).Footnote
61
The model corrects the standard errors for clustering, which is necessary due to the presence of repeated measurements (that is, individual members occur multiple times in the dataset).Footnote
62
The benefit of the staged inclusion of the control variables is that we can observe any changes in the marginal effects of the polynomial terms that occur when accounting for additional factors. Note that for this model, the cubic function of time (DaysToElection in Equation 1) best fits the data. The second- and third-degree polynomial terms of DaysToElection allow for non-linear effects of time (with corresponding coefficients ζ
2 and ζ
3, respectively, for the constitutive polynomial terms and δ
2 and δ
3, respectively, for the interacted polynomial terms), and are again included because model selection criteria dictate this specification. In line with our theoretical proposition, we expect the constitutive polynomial terms, which represent the effect of election proximity on non-party votes, to collectively yield (relatively) constant probabilities of party support over the election cycle. Conversely, we expect that the interacted polynomial terms, which account for election proximity on party votes, will – in conjunction with the constitutive terms – jointly produce increasing probabilities of party support with distance from election. While the latter can occur in a number of ways, should the interacted polynomial terms exhibit alternating signs, the result most consistent with this supposition is when the first- and third-degree interacted terms are positive (δ
1 and δ
3, respectively) and the second-degree interacted term is negative (δ
2). The scalar coefficient for Party Votes is denoted θ, and the vector of coefficients for the Congress Fixed Effects is denoted
 $$\[--><$>\bixi$$$
in Equation 1.
 $$no {\quad\quad\quad{\rm Pr}\,{{(\rm PartySupport}_{i,v}} = \,1)\, = &#x0026; \,\rPhi (\alpha \, + \,\mathop{\sum}\limits_{k\, = \,1}^3 {{\zeta }_k}\,{\rm{DaysToElection}}\,_{v}^{k} \, + \,\theta \,{\rm{PartyVotes}}{{\:}_v} \cr &#x0026; \, + \,\mathop{\sum}\limits_{k\, = \,1}^3 {{\delta }_k}\,{\rm{DaysToElection}}\:_{v}^{k} \times \,{\rm{PartyVotes}}{{\:}_v} + \:\;{\bibeta} {{{\bf {{x}}}}^{\prime}_i} \cr &#x0026; \, + \,\bigamma {{{\bf {{z}}}}^{\prime}_v}\, + \,\bixi \,{\bf{Congress}^{\prime}}_v) $$
Since we find evidence of systematic changes in party support related to election proximity (the results are discussed below), the next step in the empirical analysis is to investigate whether majority parties structure the agenda by scheduling divisive (consensual) votes when members are most (least) insulated from the negative electoral effects of partisan behavior.
Agenda Setting Analysis
Next, we explore the proposition that the occurrence of divisive votes and time to the next election are positively related. To study this question, we examine all House votes during the period of analysis (n = 20,450).Footnote 63 We begin by exploring the timing of both divisive and consensual votes. The dependent variable for one model is a dichotomous measure of whether a vote resulted in party voting. This is a natural extension of our member-level analysis, since the above analysis examines voting behavior but not the timing of votes (by design). In a separate model, we construct a dichotomous dependent variable that measures whether a vote resulted in at least 90 percent of the membership voting in the same fashion (hereafter referred to as ‘ultra-consensual’ votes). We would expect to see a decreasing probability of party votes and an increasing probability of ultra-consensual votes as elections approach. As an additional gauge of changes in interparty division relative to the time to the next election, we also examine trends in the differences across parties’ vote distributions (hereafter referred to as the ‘disagreement score’). We measure the disagreement score as the absolute difference in the proportion of participating Democrats and Republicans voting ‘yea’; values approaching 1 on the continuous scale indicate increasing interparty disagreement. If majority parties schedule divisive votes according to election proximity, then the disagreement score should decrease as elections approach.
The key independent variables for each of these models are the polynomial terms for the duration of time (again measured in days) between the vote and the next election. The order of polynomial is determined using the model selection process described above. We find that each of these models is best fit using a quadratic function of time. Since we cannot expect every vote to generate equivalent interparty divisions, we again include control variables for the vote-type categories introduced by Crespin, Rohde and Vander Wielen.Footnote 64 In a separate model, we also include issue-type fixed effects, which further account for differences across votes in terms of their propensity to produce interparty disagreement.
We might also anticipate some variation in the occurrence of divisive/consensual votes on the basis of the preference composition of the membership. For one, we would expect partisan disagreement to rise naturally with increasing party polarization. In addition, it has been argued elsewhere that rank-and-file members grant central party leaders broader license to pursue partisan outcomes as the two legislative parties become increasingly polarized (that is, as intraparty homogeneity and interparty distance increase).Footnote 65 Therefore it is important that we account for the preference distribution of partisans as we examine variation in the scheduling of divisive/consensual votes. We estimate a separate model that includes the measure of polarization introduced by Vander Wielen and Smith,Footnote 66 which is shown in Equation 2. This measure accounts for the polarization conditions articulated by Rohde,Footnote 67 while avoiding collinearity between the separate components during the period of analysis. This measure of polarization increases with distance between party medians and as standard deviations for the parties get smaller, all else equal. Stated differently, the greater the interparty disagreement and intraparty cohesion, the greater the value of the polarization measure. We measure the input variables (party medians and standard deviations) using first-dimension DW-NOMINATE scores.Footnote 68
 $$\frac{{{\rm{|Party}}\;{\rm{Median}}{{\,}_{{\rm{Majority}}}}\, - \,{\rm{Party}}\,{\rm{Median}}{{\,}_{{\rm{Minority}}}}{\rm{|}}}}{{\sqrt {\left( {\sigma _{{{\rm{Majority}}}}^{{\rm{2}}} \, + \,\sigma _{{{\rm{Minority}}}}^{{\rm{2}}} } \right)/{\rm{2}}} }}$$
Equations 3 and 4 show the models for this step of the analysis, where z
v
denotes the vector of control variables for vote v (with corresponding vector of coefficients γ). The scalar coefficient for Polarization is denoted
 $$\[--><$>\beta<$><!--$$
. Since the party and ultra-consensual vote models have the same (non-linear) specifications, we present them in the same equation (Equation 3), where y denotes the occurrence of the operative votes. Following from our theoretical proposition, as the time until the next election decreases, we expect the likelihood of party votes to decrease, the likelihood of ultra-consensual votes to increase and the disagreement score to decline.
Given the hierarchical nature of the data, with votes nested within Congresses, we estimate hierarchical logit models for the analysis of party and ultra-consensual votes, and a hierarchical linear model for the analysis of disagreement scores. In particular, we group by Congresses in the hierarchical models to account for changes in the agenda that result from variation in the composition of the membership over time.Footnote 69 In each case, we include a random intercept to permit different baseline effects across Congresses (αj [ v ] in Equations 3 and 4). We also account for differences across Congresses in the effect of election proximity on the dependent variable of interest by including random slope coefficients for the polynomial terms of time (ζj [ v ] k in Equations 3 and 4). This allows for the possibility that the effect of time on, for example, the probability of a party vote is not the same in each Congress. The standard deviations corresponding to the random intercept and random slope coefficient(s) provide information regarding the variation in effects across Congresses, with higher standard deviations signifying greater cross-Congress differences. We include only those random slope terms that improve the fit of the model, using the aforementioned model-specification approach.Footnote 70
 $$no{\quad\quad\quad\quad\quad\quad\quad\quad{\rm Pr}\,({{y}_v}\, = \,{\rm{1}})\, = &#x0026; \,logi{{t}^{{\rm{ - 1}}}} \big ({{\alpha }_{j[v]}}\, + \,\mathop{\sum}\limits_{k\, = \,{\rm{1}}}^{\rm{2}} {{\zeta }_{j[v]k}}\:{\rm{DaysToElection}}_{v}^{k} \cr &#x0026; + \beta \,{\rm{Polarization}}{{\:}_j}\, + \,\bigamma {{{\bf {{z}}}}^{\prime}_v}) $$
 $$\left( {\matrix{ {{{\alpha }_j}} \cr{{{\zeta }_j}} \\\end{}} }\right)\, \sim \,N\left( {\left( {\matrix{ {{{\mu }_\alpha }} \cr{{{\mu }_\zeta }} \\\end{}}} \right),\left\bigg( {\matrix{ {\sigma _{\alpha }^{{\rm{2}}} } &#x0026; {\rho {{\sigma }_\alpha }{{\sigma }_\zeta }} \cr\ {\rho {{\sigma }_\alpha }{{\sigma }_\zeta }} &#x0026; {\sigma _{\zeta }^{{\rm{2}}} } \\\end{}}} \right\bigg)} \right),\,{\rm{for}}\,j\, = \,{\rm{1}}, \ldots, {\rm{25}}$$
 $$ no{\quad\quad\quad\quad\quad\quad\quad{\rm{DisagreementScore}}_v\, = &#x0026; \,{{\alpha }_{j[v]}}\, + \,\mathop{\sum}\limits_{k\, = \,{\rm{1}}}^{\rm{2}} {{\zeta }_{j[v]k}}\,{\rm{DaysToElection}}\,_{v}^{k} \cr &#x0026; + \beta \,{\rm{Polarization}}{{\,}_j}\, + \,\bigamma {{{\bf {{z}}}}&#x0027;_v} $$
 $$ \left( {\matrix { {{{\alpha }_j}} \cr{{{\zeta }_j}} \\\end{}}} \right) \sim N\left( {\left\bigg( {\matrix {{{\mu }_\alpha } \cr{{{\mu }_\zeta }} \\\end{}}} \right),\left\bigg( {\matrix { {\sigma _{\alpha }^{{\rm{2}}} } &#x0026; {\rho {{\sigma }_\alpha }{{\sigma }_\zeta }} \cr\ {\rho {{\sigma }_\alpha }{{\sigma }_\zeta }} &#x0026; {\sigma _{\zeta }^{{\rm{2}}} } \\\end{}}} \right\bigg)} \right),\,{\rm{for}}\,j\, = \,{\rm{1}}, \ldots, {\rm{25}} $$
Since Equations 3 and 4 examine observed voting divisions, temporal variation in member-level party support surely influences the timing of interparty disagreement. For instance, a sufficient decrease (increase) in members’ party support that is consistent with expectations could produce a corresponding decrease (increase) in the occurrence of party votes under conditions of a static agenda. Therefore we take the additional step of examining the timing of votes that we have a priori reason to believe are systematically divisive/consensual. This extension avoids reliance on vote outcomes, which are affected by members’ party support, for uncovering strategic manipulation of the agenda. We know that certain votes are predisposed to high/low levels of interparty disagreement. That is, some votes systematically occur on matters of high/low interparty conflict. For instance, amendments are more likely to expose partisan conflict over the content of the bill than final passage votes that offer a choice between the bill and the status quo.Footnote 71 Furthermore, evidence suggests that party leaders strategically consider the implications of vote types on interparty disagreement.Footnote 72
We study the occurrence of four vote types that have clearly identifiable associations with interparty conflict: regular passage votes, suspensions, amendments and partisan procedural votes.Footnote 73 Both regular passage and suspension votes customarily occur on measures that are relatively non-controversial, whereas amendment and partisan procedural votes occur on more divisive measures.Footnote 74 We examine whether the occurrence of these votes systematically varies over the course of election cycles. For that purpose, we estimate a hierarchical logit model for each of the vote categories, in which the dependent variable is a dichotomous measure of whether the vote is in the vote category of interest. As with earlier models, the key independent variables are the polynomial terms of the number of days until the next election. We also estimate separate models that include the polarization measure and issue-type fixed effects. We again include random intercepts and random slope coefficients for the polynomial terms of time. The order of the polynomial of time and the random components are determined using the model fit specifications discussed above.
 $$ no{\quad\quad\quad\quad\quad\quad\quad\quad{\rm{Pr}}({{y}_v}\, = \,{\rm{1}})\, = &#x0026; \,logi{{t}^{{\rm{ - 1}}}} \big({{\alpha }_{j[v]}}\, + \,\mathop{\sum}\limits_{k\, = \,{\rm{1}}}^K {{\zeta }_{j[v]k}}\,{\rm{DaysToElection}}\,_{v}^{k} \cr &#x0026;+ \beta \,\:{\rm{Polarization}}{{\:}_j} + \:\;\bigamma \:\:{{\bf IssueType}}&#x0027;{{\:}_{\!\!v}})$$
 $$ \left( {\matrix {{{{\alpha }_j}} \cr{{{\zeta }_j}} \\\end{}}} \right) \sim N\left( {\left( {\matrix {{{{\mu }_\alpha }} \cr{{{\mu }_\zeta }} \\\end{}}} \right),\left\bigg( {\matrix { {\sigma _{\alpha }^{{\rm{2}}} } &#x0026; {\rho {{\sigma }_\alpha }{{\sigma }_\zeta }} \cr\ {\rho {{\sigma }_\alpha }{{\sigma }_\zeta }} &#x0026; {\sigma _{\zeta }^{{\rm{2}}} } \\\end{}}} \right\bigg)} \right),\,{\rm{for}}\,j\, = \,{\rm{1}}, \ldots, {\rm{25}} $$
The notation for the models is shown in Equation 5, where K = 1 for the regular passage and partisan procedural models and K = 2 for the other vote types. If majority parties strategically adjust the agenda, as suggested by our theoretical proposition, then we should see more regular passage votes and suspensions and fewer amendments and partisan procedural votes as elections approach. Such a finding would constitute additional evidence that majorities schedule more consensual votes in response to members’ electoral constraints.
Results
We begin our discussion of the results by interpreting the member-level effects. We then use these results to make a case for why member-level effects are only part of the dynamic elite partisanship story. Finally, the agenda setting effects are discussed.
Evidence for Dynamic Member-level Partisanship
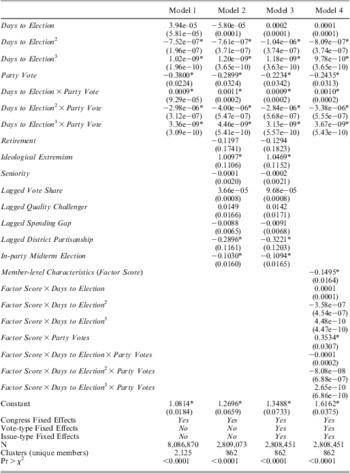
Table 1 presents the results for the model shown in Equation 1, both with and without member and vote-specific control variables included.Footnote 75 Notably, in these estimations we find that all of the coefficients for the polynomial terms interacted with the Party Votes dummy variable are statistically significant, with the first and third degrees exhibiting positive signs and the second degree a negative sign.Footnote 76 This finding points to a decreasing probability of party support on votes that divide the parties as elections approach (relative to the baseline of non-party votes). Moreover, the magnitudes of the coefficients are quite consistent across the estimations, implying that the effects are robust to the inclusion of myriad controls. Of course, since this is a non-linear model with multiple interactions, a more detailed interpretation of the effects demands the calculation of predicted probabilities, which we provide below.
Likelihood of Casting a Vote Supporting Party

Note: The dependent variable is a dichotomous measure of whether members voted with the majority of their party. Each model applies the polynomial order of time that offers the optimal fit. The models cluster on unique members, adjusting the variance-covariance matrix to account for repeated measurements. Standard errors in parentheses. *p ≤ 0.05.
As expected, we also find a strong, positive effect of Ideological Extremism (Models 2 and 3). Namely, members whose preferences are more aligned with their party's position (that is, members who are located away from the center of the ideological continuum) exhibit a higher probability of party support, as predicted. We also find that Lagged District Partisanship is statistically significant and negative (Models 2 and 3), which at first glance seems somewhat counterintuitive. However, we note that Lagged District Partisanship is highly collinear with Ideological Extremism, and when we remove Ideological Extremism from the models, Lagged District Partisanship becomes positive and statistically significant, as expected. The negative and statistically significant effect of In-party Midterm Election (Models 2 and 3) has a straightforward interpretation: members of the president's party are less likely to support their party in a midterm election cycle. This is an intuitive result, which suggests that members attempt to escape the midterm decline by exhibiting greater independence from their party. The effects on both Ideological Extremism and In-party Midterm Election are highly robust.
The other member-specific control variables are not statistically significant when correcting the standard errors for clustering.Footnote 77 Model 4 in Table 1 builds on Model 3 and replaces the various member-level variables with a single composite factor score. In addition, we include two-way interaction terms between the factor score and the polynomial terms of time to investigate the possibility that the slope for non-party votes is dependent on electoral insulation, and three-way interaction terms between the factor score, polynomial terms and Party Votes to gauge possible slope effects for party votes. Stated differently, it is conceivable that the effect of time on party support is functionally dependent on a member's electoral circumstances. As indicated by the failure of the interacted polynomial terms to achieve statistical significance, there is no such variation in the effect of time across levels of electoral insulation. However, the composite factor score on its own is negative and statistically significant for non-party votes, and positive and statistically significant for party votes. Since higher values indicate greater electoral insulation, it is not surprising that more secure members are afforded greater liberty to support their party on party votes. This finding confirms our supposition that a member's predisposition toward party support is contingent on her electoral circumstances.
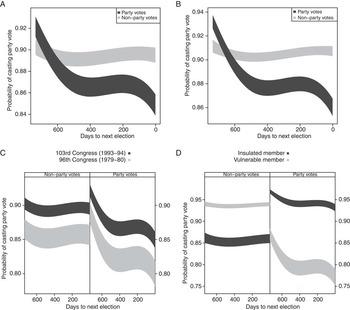
To facilitate interpretation of the central findings, we simulate the 83.5 percent confidence intervals for the probability of party support on party and non-party votes across the two-year election cycle for selected models in Table 1 (see Figure 1).Footnote 78 Since we wish to make statistical inferences regarding the differences in predicted probabilities across vote categories (party and non-party votes) at a given time during the election cycle as well as within vote categories over time, 83.5 percent confidence intervals have been shown to be appropriate for attaining conventional type I error rates of 5 percent (that is, 95 percent confidence).Footnote 79 Panel A in Figure 1 shows a member's predicted probability of supporting her party on a party and non-party vote by the number of days to the next election for Model 3, holding all other variables at their mean. Panel B shows the analogous predicted probabilities for Model 4, holding all other variables at their mean. Panel C shows the predicted probabilities for Model 3 for the Congresses with the highest (103rd Congress) and lowest (96th Congress) predicted baseline party support, holding all other variables at their mean. Panel D shows the predicted probabilities for Model 4 for the 99th percentile of the factor score (insulated member) and the 1st percentile of the factor score (vulnerable member), holding all other variables at their mean. Although Models 1 and 2 yield similar predicted probabilities, we pay particular attention to Models 3 and 4 since they offer superior fits to the data.
Predicted probability of party support on party and non-party votes by distance from election Note: Panel A shows a member's predicted probabilities of supporting her party on a party and non-party vote by the number of days to the next election for Model 3; Panel B shows the analogous predicted probabilities for Model 4; Panel C shows the predicted probabilities for Model 3 for the Congresses with the highest (103rd Congress) and lowest (96th Congress) predicted baseline party support; and Panel D shows the predicted probabilities for Model 4 for the 99th percentile of the factor score (‘insulated member’) and the 1st percentile of the factor score (‘vulnerable member’). All other variables are held at their mean, and 83.5 percent confidence intervals are used throughout (see Maghsoodloo and Huang Reference Maghsoodloo and Huang2010).

We find an appreciable drop in members’ probability of supporting their party on party votes with proximity to election across each of the models. For Models 3 and 4 in Table 1 (Panels A and B in Figure 1, respectively), the average member is expected to decrease her party support on party votes by almost 8 percentage points during the course of the election cycle. Moreover, the figures demonstrate that this decline in predicted probability is statistically significant. Conversely, we find compelling evidence that members’ likelihood of supporting their party on non-party votes is nearly constant over the course of the election cycle. Specifically, there are no two distinct points in time during the election cycle at which the confidence intervals of predicted probabilities for non-party votes are mutually exclusive in Model 3, thus indicating statistical stability. In Model 4, there is only a small number of paired days in which the confidence intervals are non-overlapping, and even then by minuscule margins. In fact, the largest difference in the mean predicted probabilities of party support on non-party votes between any two points in time during the entire electoral cycle is only about 1 percentage point in these models.
As a secondary finding, we also identify discernible variation in baseline party support across Congresses and levels of electoral insulation for both party and non-party votes (see Panels C and D in Figure 1, respectively). Given that the predicted probabilities generated by the models are non-linear (that is, logistic), variation in the baseline party support also affects the rate of change in party support over time. For instance, the predicted probabilities of party support on party votes for an average member in the Congress with the highest baseline party support (103rd Congress) vary from approximately 0.922 (when elections are most distant) to 0.849 (when they are most proximate). We compare this to the Congress with the lowest baseline party support (96th Congress), in which the analogous predicted probabilities are 0.89 and 0.8, respectively (see Panel C).Footnote 80 For both Congresses, the general relationships regarding member behavior on party and non-party votes discussed above hold. That is, members exhibit a noteworthy decline in their party support on party votes during the election cycle, but remain statistically constant in their party support on non-party votes. For an insulated member (99th percentile of the factor score), the mean predicted probabilities of party support for party votes range from 0.97 to 0.931 during the course of the election cycle, whereas the mean predicted probabilities for a vulnerable member (1st percentile of the factor score) range from 0.871 to 0.769 (see Panel D). Here again, we find remarkable stability in party support on non-party votes over time and across levels of electoral security.
In each of the models, the functional form of the relationship between party support and proximity to election on party votes suggests that party support is characterized by an equilibrium level that is interrupted by low levels when elections are proximate, and by high levels when elections are distant.Footnote 81 This is a rather plausible functional form that is broadly consistent with the conjecture that partisan behavior is inversely related to voter monitoring. Specifically, the most rapid reduction in party support occurs during the first year of the election cycle, with additional reductions occurring shortly before the next election. Arguably, this trend follows the attentiveness of the most politically astute in the earliest stages of the election cycle and the less politically engaged in the latter stages. In fact, it has been shown elsewhere that House incumbents invite challenges from experienced politicians when they lend excessive party support in the first session of a term.Footnote 82 Given that the entry of well-supported challengers is a crucial determinant of electoral competitiveness in House races,Footnote 83 it is not entirely surprising that members temper legislative behavior in the first year of the election cycle that creates voter discontent and generates demand for strong challengers. Moreover, the decline in members’ party support when elections are proximate surely reflects the disproportionate level of voter attentiveness that occurs immediately before an election.Footnote 84
These findings offer robust evidence in favor of both the Party Support Proposition and its corollary. We observe a considerable decline in members’ support for their party on party votes as elections approach. Therefore members exhibit behavior that reflects the strategic balancing of collective- and individual-level considerations – they seek collective returns when individual electoral demands are minimal and curtail their partisan support as elections approach. Conversely, when the tensions between collective- and individual-level motivations are suppressed (that is, on non-party votes), members exhibit stability in their partisan loyalty.
To further explore the member-level effects identified in the above analysis, and to more directly account for alternative explanations, we examine only votes that occur during the period extending from two months preceding an election to the end of a Congress. We select this period because it provides a limited and approximately equal amount of time before and after an election within a given Congress.Footnote 85 Because this approach examines only votes that are held at the end of a Congress, we can better account for the possibility that the model results are an artifact of end-of-Congress effects. It could be argued, for instance, that the diminishing party support on party votes as elections approach is a result of legislators making concessions in an effort to advance legislation before the end of the Congress. If this explanation were indeed driving our results, then we would expect the likelihood of party support on post-election party votes to be either statistically indiscernible from (or perhaps even lower than) pre-election party votes.
We note that the above analysis attempts to account for this alternative explanation by measuring days to the next election rather than to the end of the Congress. Nonetheless, we believe that this extension is a valuable validity check of our central findings. We replicate the above models using a dummy variable that measures whether the given vote occurred prior to the election. We use this measure in lieu of the polynomial terms of time, since the period of analysis does not provide sufficient variation in the number of days to the next election. We also include a dummy variable to account for party votes as well as an interaction term between these variables. For each of the models, we find that members exhibit a statistically significant increase in party support on party votes following election (results are available in the online appendix). This finding suggests that we are not observing an end-of-Congress effect, but rather a strategic adjustment of legislative behavior relative to elections.
The Duality of Dynamic Elite Partisanship
Our finding that the likelihood of party support on party votes, both in terms of baseline levels and marginal change across time, varies predictably across members according to their electoral vulnerability [see Figure 1(d)], provides support for the claim that observed variation in party unity over time is, at least in part, a function of individual-level behavior and not simply agenda manipulation. However, it remains of interest to assess whether variation in party unity is solely a product of systematic changes in member-level party support on party votes.Footnote 86 To better understand the contribution of member-level effects to the observed change in party unity over time, we conduct a simulation based on the above analysis.
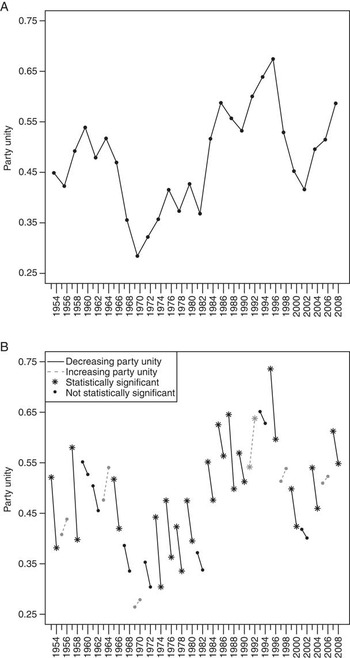
To begin, we consider the nature of variation in party unity over time. Figure 2(a) graphically presents the conventional measure of party unity – measured as the percentage of roll-call votes that are party votes over two-year congressional terms.Footnote 87 We then look at the differences in party unity scores between the first year following a House election and the year preceding the next election [see Figure 2(b)]. Based on Figure 2(b), we conclude that there is substantial and systematic change in party unity scores across years in election cycles. Scores in the first year tend to be considerably higher than in the second year, and the differences often achieve statistical significance. In fact, the changes in party unity across years in election cycles identified in Figure 2(b) are often larger than the changes across Congresses identified in Figure 2(a). Here, we are interested in assessing the amount of reduction in party unity across the first two years of the election cycle in Figure 2(b) that could plausibly be attributed to variation in member-level support.
Change in party unity over time Note: Panel A shows the percent of party votes over two-year congressional terms, and Panel B shows changes in the percent of party votes over time within election cycles. The election cycle is divided such that the first year extends from November of the even-numbered year to October of the odd-numbered year, and the second year extends from November of the odd-numbered year to October of the even-numbered year. Changes that achieve two-tailed statistical significance at the 0.1 level are denoted in Panel B.

To do so, we first generate, for each Congress separately, the predicted probabilities of party support on party votes for every member at the mean number of days to the next election in year one (time t) and year two (time t + 1) of the election cycle using Model 3 from Table 1, since it offers the best fit of all the member-level models.Footnote 88 We use the members’ observed characteristics (for example, ideological extremism, seniority, lagged vote share, etc.) to calculate their predicted probabilities. We then simulate 500,000 roll-call votes at time t, in which each member's likelihood of casting a party vote is equal to her predicted probability of party support at time t. We conduct the same simulation at time t + 1. Thus we arrive at distributions of party support at time t and t + 1 that we can difference to arrive at a single distribution of predicted vote loss across the years of the election cycle.
We can interpret this difference distribution as giving us information about the likely decline in party support on an individual divisive vote that occurs across years in the election cycle solely because of the member-level effects identified in Table 1. Next we assume that all of the votes in the second year of the election cycle that missed classification as party votes by a margin equal to or smaller than the 95th percentile of the vote loss distribution would have been party votes if not for the decline in member-level support over time. Therefore we control for member-level effects by determining the percentage of party votes that would have occurred in the second year of the election cycle if these (near-miss) votes were instead classified as party votes. This gives us a rather generous estimate of the member-level contribution to vote losses over time. Stated differently, by using such a generous estimate (the 95th percentile of the vote loss distribution), we are biasing the analysis against finding any residual causes of declining party unity after having accounted for member-level effects. If the decline in party unity can be entirely attributed to member-level effects, then majority party leaders bear no responsibility for reducing party votes by means of manipulating the agenda. On the contrary, if the member-level effects fail to fully explain the reduction in party unity over time – especially when we are intentionally overstating the member-level effects – then there is compelling reason to believe that agenda setting plays an independent role.
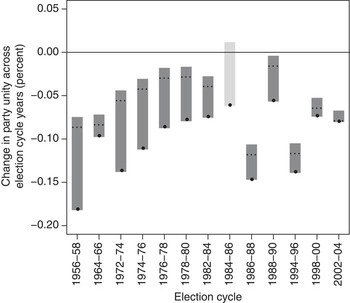
Figure 3 presents the simulated effect that member-level variation in party support has on party unity across years in election cycles that exhibit a statistically significant decrease in party unity [see Figure 2(b)]. The dots at the base of the bars indicate the observed decrease in percent of party votes across years. The tops of the bars correspond to the change in party unity across years after accounting for the 95th percentile of vote loss predicted by the empirical model. If a bar does not cross zero on the y-axis, then member-level effects fail to account for all of the observed decrease in the percent of party votes.
Contribution of member-level effects on change in party unity Note: Figure shows the simulated effect that member-level variation in party support has on the decrease in party unity over time in election cycles that exhibit a statistically significant decrease [see Fig. 2(b)]. Dots at the base of the bars indicate the observed decrease in percent of party votes over time. The tops of the bars correspond to the change in percent of party unity after accounting for the 95th percentile of vote loss predicted by the empirical model. If a bar does not cross zero on the y-axis, then member-level effects do not account for all of the observed decrease in percent of party unity. All but one election cycle (1984–86) is bounded away from zero. Dotted lines in the bars indicate the level of vote loss overestimation in the election cycle 1984–86.

We find that all but one election cycle (1984–86) is bounded away from zero, and many of the election cycles still exhibit substantial decline in party unity across years. In fact, we find that, on average, nearly half of the decline in party votes across election cycle years cannot be explained by (a generous assessment of) member-level effects. This simulation, at the very least, suggests that the role of majority party agenda manipulation is not a trivial part of this story. We now turn our attention to the Agenda Setting Proposition.
Evidence for Dynamic Agenda Setting
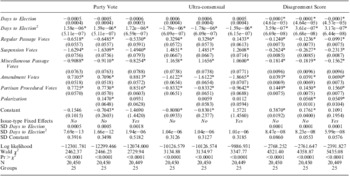
The results of the models in Equations 3–4 are shown in Table 2 and comport with our expectations.Footnote 89 Specifically, we find that there is a marked decrease in both the probability of a party vote and the disagreement score as elections approach. Conversely, we observe a rise in the probability of ultra-consensual votes as the next election draws nearer. We also find that the vote type variables have the predicted effects: regular passage and suspension votes depress interparty voting conflict, and amendments and partisan procedural votes have the opposite effect. This finding supports the notion that certain vote types are predisposed to particular levels of conflict, which motivates the analysis that follows.
Timing of Divisive/Consensual Votes

Note: Included in this analysis are all roll-call votes that occurred between the 84th and 108th Congresses (1955–2004). The dependent variable in the ‘Party Vote’ model is a dichotomous measure of whether the vote resulted in a majority of Democrats opposing a majority of Republicans. The dependent variable in the ‘Ultra-Consensual’ model is a dichotomous measure of whether the vote had at least 90 percent of the membership vote in the same way. The dependent variable in the ‘Disagreement Score’ model measures the absolute difference in the percent of Democrats and Republicans voting yea. The baseline vote type category is Miscellaneous Procedural Votes. Each model applies the polynomial order of time that offers the optimal fit. Standard errors in parentheses. *p ≤ 0.05.
We also note that the results are robust to the inclusion of the Polarization variable and the issue-type fixed effects. Polarization has the expected (positive) effect for both the party vote and disagreement score models, but is not statistically significant for the ultra-consensual model. In other words, cross-Congress levels of interparty disagreement are positively related to polarization.
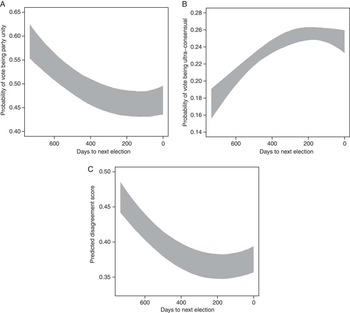
Figure 4 shows the predictions for each of the complete models (with issue-type fixed effects) in Table 2 on an average vote throughout the election cycle.Footnote 90 The predicted changes in these votes with respect to election proximity are noteworthy. The probability of a party vote falls by over 12 percentage points as time to the next election decreases, while the probability of an ultra-consensual vote rises by roughly 8 percentage points. Moreover, the disagreement score falls by approximately 9 percentage points over the course of the election cycle. Each of these findings suggests a substantial decrease in the consideration of divisive measures as elections approach. Therefore we find initial support for the Agenda Setting Proposition.Footnote 91
Predictions for the timing of divisive/consensual votes Note: Panel A shows the predicted probability of a party vote by the number of days to the next election (results from the complete ‘Party Vote’ model in Table 2); Panel B shows the predicted probability of an ultra-consensual vote by days to the next election (results from ‘Ultra-Consensual’ model in Table 2); and Panel C shows the predicted absolute difference in the percent of Democrats and Republicans voting yea by days to the next election (results from ‘Disagreement Score’ model in Table 2). All other variables are held at their mean, and 83.5 percent confidence intervals are used throughout (see Maghsoodloo and Huang Reference Maghsoodloo and Huang2010).

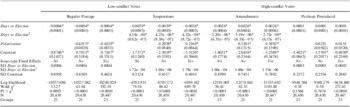
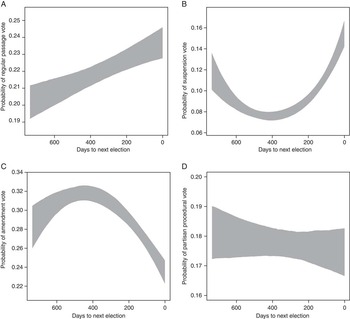
Finally, we examine the occurrence of vote types that are associated with particularly high/low levels of interparty disagreement. Again, the advantage of this analysis is that we have a priori expectations for divisiveness levels on these votes that do not depend on observed levels of voting conflict. Table 3 shows the results for the models in Equation 5. The coefficients of the polynomial terms in these models are consistent with our expectations that votes that are predisposed to generate conflict decrease with election proximity and traditionally consensual votes increase as elections approach. All of the polynomial terms achieve statistical significance except in the partisan procedural model. Inclusion of the Polarization variable does not substantively alter the results, and Polarization is statistically significant and in the expected direction for both the regular passage and amendments models.Footnote 92 The results are also robust to the inclusion of the issue-type fixed effects. Figure 5 illustrates the predicted probabilities for the occurrence of the vote categories over the course of the election cycle using the complete models (with issue-type fixed effects).Footnote 93
Timing of Vote Types

Note: Included in this analysis are all roll-call votes that occurred between the 84th and 108th Congresses (1955–2004). The dependent variables indicate whether the vote was a Regular Passage, Suspension, Amendment or Partisan Procedural vote. Each model applies the polynomial order of time that offers the optimal fit. Standard errors in parentheses. *p ≤ 0.05.
Predictions of timing of vote types Note: Panel A shows the predicted probability of regular passage votes by the number of days to the next election (results from the complete ‘Regular Passage’ model in Table 3); Panel B shows the predicted probability of suspension votes by days to the next election (results from ‘Suspensions’ model in Table 3); Panel C shows the predicted probability of amendment votes by days to the next election (results from ‘Amendments’ model in Table 3); and Panel D shows the predicted probability of partisan procedural votes by days to the next election (results from ‘Partisan Procedural’ model in Table 3). All other variables are held at their mean, and 83.5 percent confidence intervals are used throughout (see Maghsoodloo and Huang Reference Maghsoodloo and Huang2010).

These findings constitute additional evidence in support of the Agenda Setting Proposition. That is, we find that majority parties are decreasingly likely to schedule divisive votes as elections approach, which suggests that House majority party leaders respond to their members’ electoral pressures by adjusting the agenda accordingly. These findings point to an agenda setting strategy in which majorities seek to maximize collective gains when member-level electoral constraints are low (when elections are distant) and promote members’ electoral fortunes when constraints are comparatively high (when elections are near).Footnote 94
Discussion and Conclusions
There is abundant evidence that voters across democratic systems have conflicted views of parties. While they rely on party labels to cast their votes and reward parties for policy successes, voters loathe excessive partisanship by elites. Voter ambiguity regarding partisanship, therefore, presents parties with countervailing incentives. Strong partisanship will bring desired policy successes and present voters with a clear party brand, but voters will punish legislators at election time if they are overly partisan. The question is then: how do parties solve this dilemma?
We argue that elite partisan behavior is time dependent. A key factor in this story is that voter monitoring of legislative activity varies systematically over time. Parties and elected politicians exhibit behavior that reflects an awareness of the time sensitivity of partisanship, as they opportunistically pursue party goals when the costs of partisan behavior are relatively low (when voter attentiveness is low). As such, this study suggests that elite partisanship is best characterized as a highly dynamic process, even over the short term, as opposed to the conventional perspective, which holds that partisanship changes incrementally over long periods of time.
We believe these findings have important implications for multiple related literatures. Our work suggests that a complete picture of variation in elite partisanship may require analysis over more refined measures of time. In fact, partisan variation appears to be significantly more dynamic than previously considered. Therefore, studies that measure the cohesiveness and/or polarization of congressional parties over extensive periods (for example, two-year congressional terms) may obscure meaningful information. Moreover, a finding that members adopt systematically variable voting positions relative to the timing of the next election adds to recent evidence that members’ policy positions are strategically adjusted,Footnote 95 but contradicts observations of voting stability over time.Footnote 96
Our findings also contribute to the expansive literature that addresses the legislative conditions related to policy change.Footnote 97 Our work suggests that the timing and nature of legislative output may not only be a function of structural features of Congress or the types of issues that arise, but also of when in the election cycle these issues surface. We believe these results point to two possible policy implications. First, inevitably divisive measures may well be postponed until after elections. The story of the Bush tax cuts briefly detailed above provides some anecdotal evidence to this effect. Secondly, the majority party may be less inclined to pursue partisan manipulation of legislation when elections are near. The decline in consideration of divisive measures as elections approach offers some circumstantial evidence of this possibility. A thorough examination of the policy implications of these findings is, however, beyond the scope of this article, so we leave this question for future study.
Our finding that House members and congressional parties recognize the electoral consequences of party support and strategically adjust their behavior relative to election proximity has important application beyond the study of Congress. It certainly has direct import for any electoral system that has a personal vote component. Yet we believe that these partisan dynamics can likewise be triggered by the presence of other countervailing incentives, such as conflicting demands between government coalition partners and partisan voters. Therefore the existence of a personal vote is not, in our view, a necessary condition for these dynamics. Furthermore, the strategic between-elections behavior we uncover among US House members is also generally consistent with findings from comparative studies on party switching.Footnote 98