1. Introduction
Over the past two decades, the Taylor rule has become a useful benchmark for the conduct of monetary policy at the US Federal Reserve (the Fed) and other central banks (see, e.g. Czudaj, Reference Czudaj2021; Jeske and Liu, Reference Jeske and Liu2013; Kahn, Reference Kahn and Kahn2012). However, central banks may sometimes deviate from this policy rule, for which there are several reasons, including the important role of politics in monetary policy decision-making. Although conventional wisdom holds that central bank independence insulates monetary policy decision-making from political pressure, deepens policy credibility, improves economic outcomes, raises private investment, limits inflation and expectations of inflation, and resolves intraparty conflicts (see, e.g. Keefer and Stasavage, Reference Keefer and Stasavage2003; Bodea and Hicks, Reference Bodea and Hicks2015),Footnote 1 Franzese (Reference Franzese1999) has shown that independence from political authority is never complete, that is, central banks always control, and current governments partly control, monetary policy.
In this regard, the existing literature identifies political change, including the party of the presidency or the chair of the central bank, as a major factor affecting monetary policy. See, for example, Caporale and Grier (Reference Caporale and Grier2005b) and Chen and Wang (Reference Chen and Wang2014). Elsewhere, Belke and Potrafke (Reference Belke and Potrafke2012) use panel data from OECD member countries to show that government ideology influences monetary policy, while Clark and Arel-Bundock (Reference Clark and Arel-Bundock2013) provide evidence of a partisan bias in monetary policy at the Fed. Numerous studies likewise suggest the increasing politicization of central banks, particularly following the recent global financial and economic crisis. See, for example, James (Reference James2010) and Fernandez-Albertos (Reference Fernandez-Albertos2015).
It is thus of interest to know whether politics causes central banks to deviate from purely economic monetary policy. We believe this question is particularly germane to the political study of monetary policy, and quite timely considering the current US economic crisis, the decision by the Trump presidency not to renominate Janet Yellen as Federal Reserve chair when her term expired in February 2018, and, at the time of writing, the upcoming 2020 US presidential election. It is also worth noting that President Donald Trump, during his term of office, publicly criticized the current Federal Reserve Chairman Jerome Powell more than once over monetary policy. These facts provide evidence that political intervention in monetary policy remains a continuing phenomenon.
However, while the effects of Taylor rule deviations on economic activity have been widely investigated, analysis of the causes of these deviations remains uncommon. Beckmann et al. (Reference Beckmann, Belke and Dreger2017) examine the causes of deviations from the Taylor rule in the primary industrial countries. Using ex-post data from the OECD, they suggest that inclusion of international spillovers (using the US rate as a control for the euro area, the UK, and Japan) and nonlinearities can improve the empirical fit of the Taylor reaction function. Elsewhere, Hudson and Vespignani (Reference Hudson and Vespignani2018) examine Australian data and find that international factors can account for 41.9% of the total variation in deviations from the Taylor rule as against only 22.5% for domestic factors. Potential explanations for these deviations include exchange rate movements, stock and oil prices, fixed adjustment costs, and ongoing uncertainty (see Lei and Tseng, Reference Lei and Tseng2019). In addition to these, as the US Fed may influence the monetary policy of other central banks (the monetary superpower hypothesis), US Taylor rule deviation is also a potential explanation for deviations in countries other than the US.
In this paper, we additionally focus on factors influencing these deviations from a politico-economic perspective in the form of changes in the US political regime, including the presidential administration and the chair of the central bank. It is worth noting that any empirical evidence crucially depends on how we measure the Taylor rule deviations. In the extant literature, different methods are used to construct the Taylor rule deviations. One approach is simply to treat the original rule proposed by Taylor (Reference Taylor1993) as the optimal rule, and hence construct the Taylor rule deviation as the difference between actual interest rates and the rates implied by the original Taylor rule (see, e.g. Nikolsko-Rzhevskyy et al. Reference Nikolsko-Rzhevskyy, Papell and Prodan2019). A second approach is to estimate Taylor rule-type reaction functions and specify the regression residuals as Taylor rule deviations (see, e.g. Hudson and Vespignani, Reference Hudson and Vespignani2018). However, one problem with both these approaches is that while Taylor (Reference Taylor2015) asserts that the Taylor rule is indeed optimal policy after nearly two decades of research, whether the Taylor rule proposed by Taylor (Reference Taylor1993) is indeed an optimal policy remains the subject of debate (see, e.g. Clarida, Reference Clarida2012; Bernanke, Reference Bernanke2015).
As indicated in Svensson (Reference Svensson2003), maximizing the welfare of citizens should be a noncontroversial goal of monetary policy. Therefore, we first rely on the theory-based approach to identify the optimal interest rate and use that to maximize social welfare. We search for the optimal Taylor rule using a dynamic stochastic general equilibrium (DSGE) model with financial frictions based on Iacoviello and Neri (Reference Iacoviello and Neri2010), and the welfare analysis proposed by Schmitt-Grohé and Uribe (Reference Schmitt-Grohé and Uribe2007) with a second-order accurate solution to the model. Since Fisher (Reference Fisher1933) proposed the debt deflation mechanism, deteriorating credit conditions are considered not just a phenomenon resulting from a declining economy but also a major factor dampening economic activities themselves (see Bernanke et al. Reference Bernanke, Gertler and Gilchrist1999). In addition, the Great Recession of 2008–2009 has shed light on the importance of the housing market, and how credit frictions have played an important role for the whole economy. Hence, it motivates us to include financial frictions in our model.
We then construct the Taylor rule deviations and examine whether the changes in political regime are able to account for any deviations from the optimal Taylor rule. Using US quarterly data from 1976:Q1 to 2016:Q4, we find that political changes, as measured by either a change in the presidency or in the Federal Reserve chair, strongly and significantly explain the Taylor deviations.Footnote 2
The contributions of this paper are twofold. First, to our knowledge, it is the first known analysis to construct Taylor rule deviations for the US economy by maximizing the welfare of a representative agent in a DSGE model with financial frictions, which have long been viewed as the major factor influencing economic activity (see, e.g. Fisher, Reference Fisher1933), especially during the Great Recession. While many studies incorporate financial frictions into their models in analyzing monetary policy, this strand of research simply focuses on discussing the optimal rule or the impact of credit frictions (see, for instance, Andrés et al. Reference Andrés, Arce and Tomas2013; Rubio, Reference Rubio2020). In this paper, we follow Chang et al. (Reference Chang, Chen and Wang2020) to further examine the deviations from the optimal policy and address the causes of the deviations in the optimal rule. Second, we provide strong evidence that politics plays an important role in causing any deviations from purely economic optimal policy, which is based on social welfare maximization. That is, compared with previous studies using regression residuals to measure the deviations, this paper employs a more theoretically sound framework, rather than pursuing a simple econometric data exercise.
2. Constructing Taylor rule deviations
In this section, we demonstrate how to construct our measure of Taylor rule deviations. Following Lambertini et al. (Reference Lambertini, Mendicino and Punzi2013), the welfare analysis is based on the DSGE model proposed by Iacoviello and Neri (Reference Iacoviello and Neri2010). We show how to determine the optimal Taylor rule via welfare maximization and then construct the Taylor rule deviation accordingly. A brief description of the DSGE model follows, and further details are given in the Appendix D.
2.1 The model
There is a continuum of measure one for the two types of infinitely lived agents in the economy: patient and impatient households. Both types of households work and consume goods and housing. The difference between patient and impatient households is that given the difference in their discount factors, the former save and the latter borrow. Patient households own the productive capital of the economy and supply funds to firms and impatient households. The model economy is composed of heterogeneous sectors: the nonhousing sector produces consumption and business investment using capital and labor, while the housing sector produces new homes using capital, labor, and land.
In addition, in a competitive market with flexible prices, wholesale firms use labor, capital, land, and intermediate goods to produce wholesale consumption goods and new houses by maximizing their profits. We assume monopolistic competition at the retail level and price stickiness in the fashion of Calvo. There is a continuum of mass unity of final goods firms (retailers) that purchase intermediate goods from wholesale firms in a competitive market, differentiate the goods at no cost, and then sell them at a markup over marginal cost. Retailers use one unit of intermediate good to produce one unit of retail output, and each chooses a sale price, taking the wholesale prices and the demand curve as given. In particular, a retailer can freely adjust its price with a fixed probability in every period.
In the labor market, both patient and impatient households supply homogeneous labor services to unions. Following Smets and Wouters (Reference Smets and Wouters2007), the unions differentiate labor services, set wages subject to a Calvo scheme, and offer labor services to wholesale labor packers. Wholesale firms hire homogeneous labor composite services, which are then reassembled by the wholesale labor packers.
Following Lambertini et al. (Reference Lambertini, Mendicino and Punzi2013), monetary policy in the baseline model is set according to a Taylor-type rule given by
 \begin{align} R_t = R^{r_R}_{t-1} \left (\frac{\pi _t}{\pi }\right )^{(1 - r_R) r_\pi } \left ( \frac{GDP_t}{GDP_{t-1}} \right )^{(1 - r_R) r_Y} R^{1 - r_R} \frac{\exp (u_{R,t})}{A_{s,t}}, \end{align}
where
 $R=\pi/ \beta$
denotes the steady-state value of
 $R_t$
,
 $r_R$
captures the smoothing of the interest rate,
 $r_{\pi }$
and
 $r_Y$
, respectively, measure the responses to inflation and GDP growth, and a monetary policy shock is denoted by
 $u_{R,t}\sim ^{i.i.d.}(0,\sigma ^2_R)$
.Footnote
3
Further, the central bank’s inflation target is assumed to be time-varying and subject to a persistent shock
 $A_{s,t}$
:
 \begin{align*} \log A_{s,t} &= \rho _{As} \log A_{s,t-1} + u_{s,t}, \end{align*}
where
 $u_{s,t} \sim ^{i.i.d.} (0,\sigma _{As}^2)$
.
We adopt the Bayesian technique to estimate the model parameters. Details about how we calibrate and estimate the model, and the associated estimation results, are provided in the Appendix E and F.
2.2 Optimal monetary policy and Taylor rule deviations
The optimal monetary policy is based on social welfare criteria. However, we do not rely on an ad hoc loss function, which aims to minimize the volatility of the variables that concern policymakers, such as output and inflation. Instead, we assume that the policy authority maximizes social welfare subject to the competitive equilibrium conditions and a specific policy rule. The household’s welfare function is the following conditional expectation of lifetime utility:
 \begin{equation} V^i_t \equiv \max E_t \left [ \sum ^\infty _{j=0} (\beta ^i)^j{U} \left(c^i_{t+j}, h^i_{t+j}, n^i_{c,t+j}, n^i_{h,t+j}\right) \right ], \end{equation}
where
 $V^i = \{V, V'\}$
represents the welfare of the patient and impatient households, respectively. In the same vein,
 $(\beta ^i, c^i,h^i,n_c^i,n_h^i)=(\{\beta,\beta '\}, \{c,c'\}, \{h,h'\},\{n_c,n_c^{\prime}\},\{n_h,n_h^{\prime}\})$
denote the discount factor, consumption, house holding, labor supply in the consumption sector, and labor supply in the housing sector for patient and impatient households, respectively.
In recursive form, equation (2) can be rewritten as
 \begin{equation} V^i_t ={U} (c^i_{t+j}, h^i_{t+j}, n^i_{c,t+j}, n^i_{h,t+j}) + \beta ^i E_t V^i_{t+1}. \end{equation}
Following Rubio (Reference Rubio2011) and Lambertini et al. (Reference Lambertini, Mendicino and Punzi2013), we aggregate individual welfare into a social welfare function as the weighted average of the welfare of patient and impatient households:
 \begin{equation} \widetilde{V}_t \equiv (1 - \beta ) V_t + (1 - \beta ') V^{\prime}_t. \end{equation}
The weights
 $1 - \beta$
and
 $1 - \beta '$
ensure that the social planner equalizes utility across the different agent types given a constant utility level. The computation of welfare follows the standard approach commonly adopted in the DSGE literature (see, e.g. Schmitt-Grohé and Uribe, Reference Schmitt-Grohé and Uribe2007). Thus, welfare performance is evaluated conditional on the initial state,
 $t=0$
, being the deterministic steady state. Following Rubio and Carrasco-Gallego (Reference Rubio and Carrasco-Gallego2015), we measure welfare gains as a consumption equivalent (CE) based on the reference policy, where the Taylor rule parameters are based on Bayesian estimation.
We explore the maximum social welfare over varying parameters (
 $r_R$
,
 $r_\pi$
,
 $r_Y$
) of the Taylor policy rule under consideration. That is, we search over multidimensional grids to compute the optimized policy rules that generate the greatest social welfare. The ranges to use in the grid search are chosen to be
 $r_R\in [0,1]$
,
 $r_\pi \in [1,3]$
, and
 $r_y\in [0,3]$
, based on several considerations. First, the unit interval for the smoothing parameter
 $r_R$
and the boundaries for
 $r_y$
are based on existing estimates in the empirical literature. The lower bound for
 $r_\pi$
is to ensure model determinacy, while the upper bound is arbitrary. As the larger monetary policy coefficients are difficult to communicate to policymakers or the public, as in Schmitt-Grohé and Uribe (Reference Schmitt-Grohé and Uribe2007), the search range of
 $r_\pi$
is set to [1,3].
After obtaining the optimal Taylor rule coefficients
 $\tilde{r}_R$
,
 $\tilde{r}_\pi$
, and
 $\tilde{r}_Y$
, we construct the model-based interest rate
 $\tilde{i}_t = \log \widetilde{R}_t$
implied by the optimal Taylor rule as:Footnote
4
 \begin{align} \tilde{i}_t &= \max \left [0, \tilde{r}_R \tilde{i}_{t-1} +(1 - \tilde{r}_R)\left ( \tilde{r}_\pi \log \left (\frac{\pi _t}{\pi }\right ) + \tilde{r}_Y \log \left (\frac{GDP_t}{GDP_{t-1}}\right ) + \overline{rr}\right )\right ], \end{align}
where
 $GDP_t$
represents aggregate output,Footnote
5
and
 $\overline{rr} = \log (\pi/\beta )$
. Hence, the Taylor rule deviation from the optimal Taylor rule is defined as
 \begin{align*} Dev_t &= i_t - \tilde{i}_t, \end{align*}
where
 $i_t$
is the actual nominal interest rate.
3. Causes of Taylor rule deviations
3.1 Political and bureaucratic regimes
A series of studies by Caporale and Grier (Reference Caporale and Grier2000) and Caporale and Grier (Reference Caporale and Grier2005a) use political dummy variables to undertake a thorough investigation and obtain evidence that structural breaks in US real interest rates are consistent with changes in political regimes, including the party of the US presidency and the chair of the US Federal Reserve. They argue that this suggests the significant influence of politics on monetary policy. However, Rapach and Wohar (Reference Rapach and Wohar2005) propose an alternative explanation that we may attribute the regime shifts in real interest rates to breaks in inflation. They find that the dates when inflation and the real interest rate regime change occur are remarkably close. To reconcile these competing hypotheses, Caporale and Grier (Reference Caporale and Grier2005b) control for the timing of changes in the inflation regime and show that even when controlling for inflation regime shifts, the political dummy variables are still strongly significant in explaining real interest rate fluctuations. Finally, a recent study by Chen and Wang (Reference Chen and Wang2014) shows that changes in political regimes can account for deviations from the original Taylor rule for the US economy.
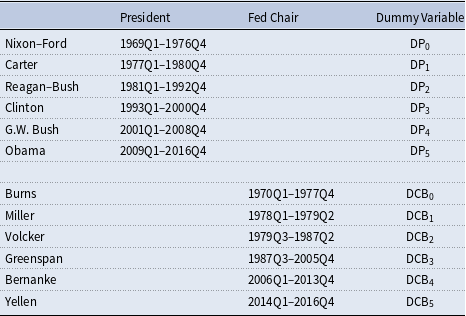
Following Caporale and Grier (Reference Caporale and Grier2005b), we consider the relevant political and bureaucratic changes for the US as follows. The parties controlling the US presidency during our sample period are Nixon–Ford (1969Q1–1976Q4), Carter (1977Q1–1980Q4), Reagan–Bush (1981Q1–1992Q4), Clinton (1993Q1–1999Q4), G.W. Bush (2000Q1–2008Q4), and Obama (2009Q1–2016Q4). Burns (1970Q1–1977Q4), Miller (1978Q1–1979Q2), Volcker (1979Q3–1987Q2), Greenspan (1987Q3–2005Q4), Bernanke (2006Q1 –2013Q4), and Yellen (2014Q1–2016Q4) held the chair of the Fed during the same sample period. Table 1 lists the relevant political regimes and the associated dummy variables.
US Presidential and Fed Chairmanship Regimes: 1976Q1–2016Q4

3.2 Empirical model
Let
 $\{DP_0$
,
 $DP_1$
,
 $\ldots$
,
 $DP_k\}$
be the presidential dummy variables, and
 $\{DCB_0$
,
 $DCB_1$
,
 $\ldots$
,
 $DCB_m\}$
be those for central bank chairmanship. We examine whether different factors cause the central bank to deviate systematically from the optimal Taylor rule policy by estimating
 \begin{equation} Dev_t = \sum _{j=1}^p\boldsymbol{\beta _j^{'} X_{t-j}} + \sum _{j=0}^k\gamma _{j}\text{DP}_j + \sum _{j=0}^m\delta _{j}\text{DCB}_j + \varepsilon _{t}. \end{equation}
When
 $\delta _j=0$
, equation (6) reduces to the presidential administration model:
 \begin{equation} Dev_t = \sum _{j=1}^p\boldsymbol{\beta _j^{'} X_{t-j}} + \sum _{j=0}^k\gamma _{j}\text{DP}_j + \varepsilon _{t}, \end{equation}
and when
 $\gamma _j=0$
, we can derive the Fed chair turnover model from equation (6):
 \begin{equation} Dev_t = \sum _{j=1}^p\boldsymbol{\beta _j^{'} X_{t-j}} + \sum _{j=0}^m\delta _{j}\text{DCB}_j + \varepsilon _{t}. \end{equation}
The coefficients of particular interest are
 $\gamma _j$
and
 $\delta _j$
because these determine whether politics (read political and bureaucratic regimes) matter in deciding the Taylor rule deviations. It is worth noting that, as argued by Caporale and Grier (Reference Caporale and Grier2000), it is inappropriate to label changes in presidential administrations as fiscal regime shifts and switches in Fed chairs as monetary regime shifts because both political changes and fiscal decisions affect monetary policy. Hence, we view the presidential and Fed chair regime models as alternative models of political regime shifts.
To control for other factors that may also drive the Taylor rule deviations, we consider a vector of economic variables denoted by
 $\boldsymbol{X_t}$
, including real stock returns, real oil price changes, unemployment rates, real exchange rate changes, and variables capturing distress in financial markets. We use the following variables to measure financial instability: changes in financial conditions (
 $\Delta \text{FCI}_t$
) and changes in the interest rate spread (
 $\Delta \text{Ispread}_t$
). We proxy the financial condition using the Chicago Fed National Financial Conditions Index, a composite index providing a comprehensive measure of US financial conditions in money, debt, and equity markets, and traditional and shadow banking systems. An increase in the index (
 $\Delta \text{FCI}_t\gt 0$
) suggests financial conditions becoming tighter. The interest rate spread is the gap between the interest rates on credit and the interest rates on deposits, which suggests higher credit risk when the spread widens (
 $\Delta \text{ISpread}_t\gt 0$
).
We obtain data for spot oil prices (West Texas Intermediate crude), the civilian unemployment rate, the Chicago Fed National Financial Conditions Index, lending rates (the bank prime loan rate), and deposit rates (3-month or 90-day rates and yields on certificates of deposit) from the FRED Data provided by the St. Louis Fed. Data for stock prices (financial market prices, equities, indexes) are from the International Monetary Fund’s International Financial Statistics, and data for real exchange rates are from the Bank for International Settlements.Footnote 6
4. Empirical results
4.1 Optimal interest rate rule
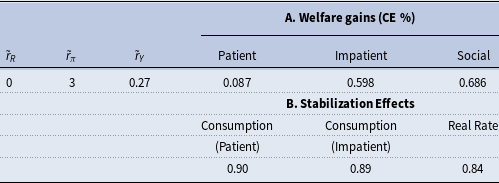
We estimate the DSGE model using the Bayesian technique and observables, including real personal consumption, real residential investment, real business investment, real house prices, nominal interest rates, inflation, hours and wage inflation in the consumption sector, and hours and wage inflation in the housing sector. Following Knotek et al. (Reference Knotek, Randal, Christian, Caitlin and Saeed2016), we specify the PCE price index excluding food and energy (or core PCE price index) as the measure of inflation. Panel A of Table 2 reports the optimal Taylor rule coefficients
 $\tilde{r}_R$
,
 $\tilde{r}_\pi$
, and
 $\tilde{r}_Y$
, as well as the welfare gains relative to the reference policy, that is, the estimated Taylor-type rule. Comparing with the Bayesian estimation results (see Appendix E for the details), we can see that the optimal rule does not require interest rate smoothing (
 $\tilde{r}_R=0$
), while the estimated coefficient on interest rate smoothing is
 $\hat{r}_R=0.53$
. This result suggests that the monetary authority need not consider policy inertia when maximizing social welfare. Besides, the optimal rule is characterized by a strong response to inflation
 $\tilde{r}_\pi =3$
, consistent with the finding of Mendicino and Pescatori (Reference Mendicino and Pescatori2008), which is larger than the estimated Taylor rule coefficient
 $\hat{r}_\pi =1.82$
.Footnote
7
Moreover, the output coefficient of the optimal Taylor rule is
 $\tilde{r}_y=0.27$
, which is around the estimated Taylor rule coefficient
 $\hat{r}_y=0.24$
.
Optimized interest rate rules
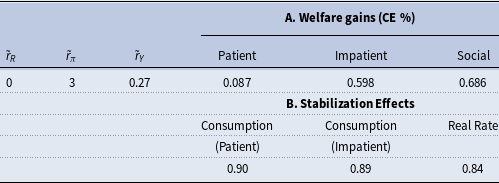
Note: Stabilization effects in Panel B represent the standard deviations of the second-order approximation relative to the reference policy.
By implementing the optimal rule, impatient households derive more welfare gains than patient households (see Panel A of Table 2). As impatient households are restricted by a credit constraint, they cannot enjoy smooth consumption. Mendicino and Pescatori (Reference Mendicino and Pescatori2008) indicate that by conducting real interest rate stabilizing policy, the central bank also mitigates the debt repayment in the presence of nominal debt in the heterogeneous agents model. Therefore, impatient households become less vulnerable to shocks to the interest rate and inflation. Consequently, the volatility of consumption of impatient households can be relieved. Panel B of Table 2 shows that the optimal interest rate rule alleviates the volatility of real rate and consumption.
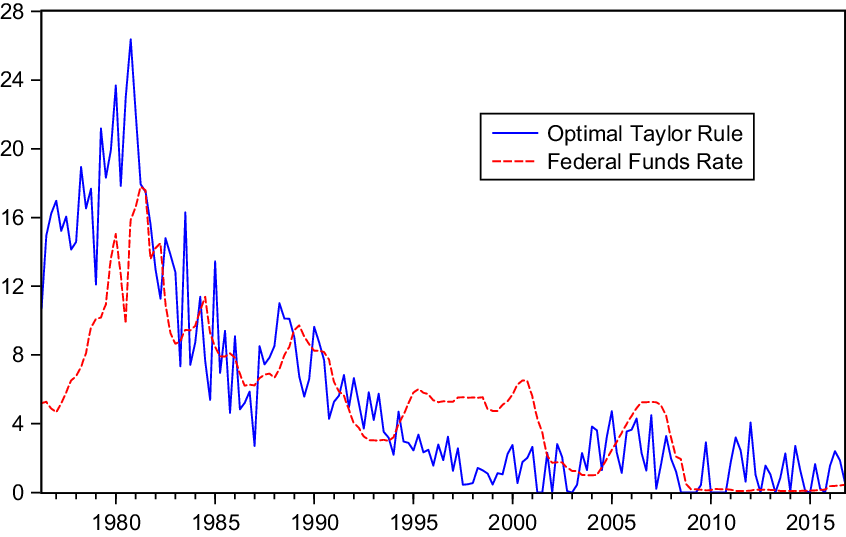
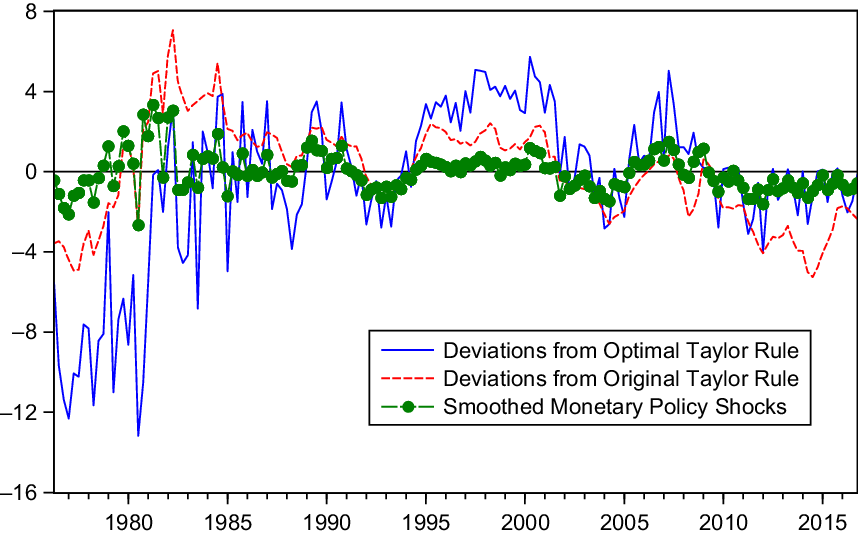
Figure 1 plots actual interest rates and the interest rates implied by the optimal Taylor rule, while Figure 2 depicts the Taylor rule deviations. We can see that actual interest rates lie below the optimal rates during some periods, including 1976Q2–1981Q2, 1991Q3–1993Q4, and 2003Q3–2004Q2 (see the solid line). Moreover, following the 2009 US subprime crisis, the gap between the actual and optimal interest rates is notable. For the sake of maximizing social welfare, we suggest that the policy rates should be appropriately raised in response to the economic situation.Footnote 8 The prolonged Taylor rule deviation after 2010 suggests that monetary policy was too loose, even when the economy began to recover, and especially given that the recession had already ended by the second quarter of 2009 according to the NBER Recession Indicator.Footnote 9
Interest rates implied by the optimal rule (solid line) and actual interest rates (dashed line).

Deviations from the optimal Taylor rule.
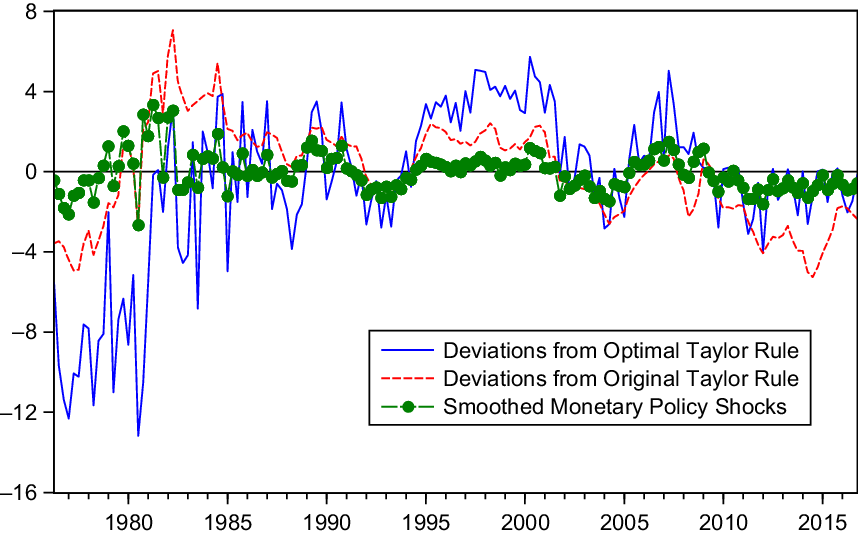
We also illustrate the deviations from the original Taylor rule (dashed line) and the smoothed monetary policy shocks extracting from the Bayesian estimation of the DSGE model (dotted line) in Figure 2.Footnote 10 The federal fund rate is below the original Taylor rule during 1976Q2–1979Q3, 1992Q1–1994Q1, 2001Q4–2006Q1, and 2009Q4–2016Q4, which is consistent with the findings of Nikolsko-Rzhevskyy et al. (Reference Nikolsko-Rzhevskyy, Papell and Prodan2014) and Nikolsko-Rzhevskyy et al. (Reference Nikolsko-Rzhevskyy, Papell and Prodan2019).Footnote 11 We can see that the eras of the negative deviations from the original Taylor rule and from the optimal interest rate rule are similar. This suggests that interest rates are lower during these eras from the perspective of both the original Taylor rule and welfare maximization.
Moreover, the smoothed monetary policy shocks are negative during 1976Q4–1978Q3, 1991Q3–1994Q2, 2001Q4–2005Q2, and 2010Q4–2016Q4. The periods of easing monetary policy are also analogous with the periods of negative Taylor rule deviations, which shows that expansionary monetary policies are implemented in the same direction as these deviations.
4.2 Politics and Taylor rule deviations
4.2.1 Presidential administration models
We have shown the existence of substantial Taylor rule deviations. We now move to our main question of whether politics causes these deviations from the optimal interest rate rule. We first focus on the presidential regime change models (7) and examine the hypothesis that presidential regime changes affect Taylor rule deviations (see, e.g. Caporale and Grier, Reference Caporale and Grier2005a; Caporale and Grier, Reference Caporale and Grier2005b).
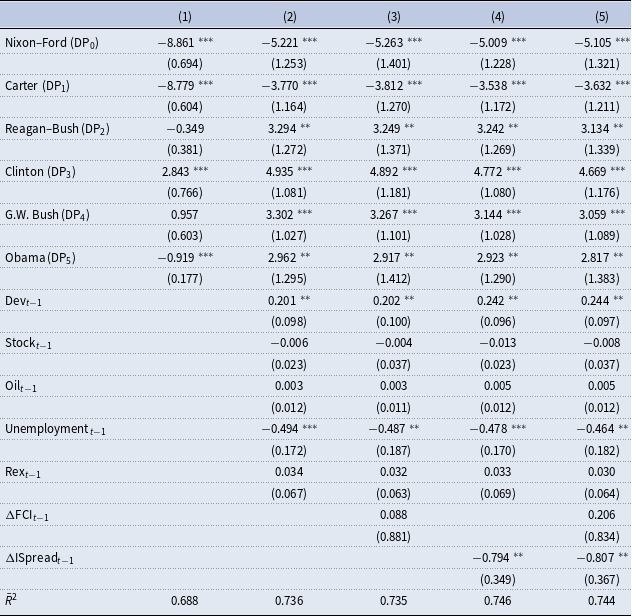
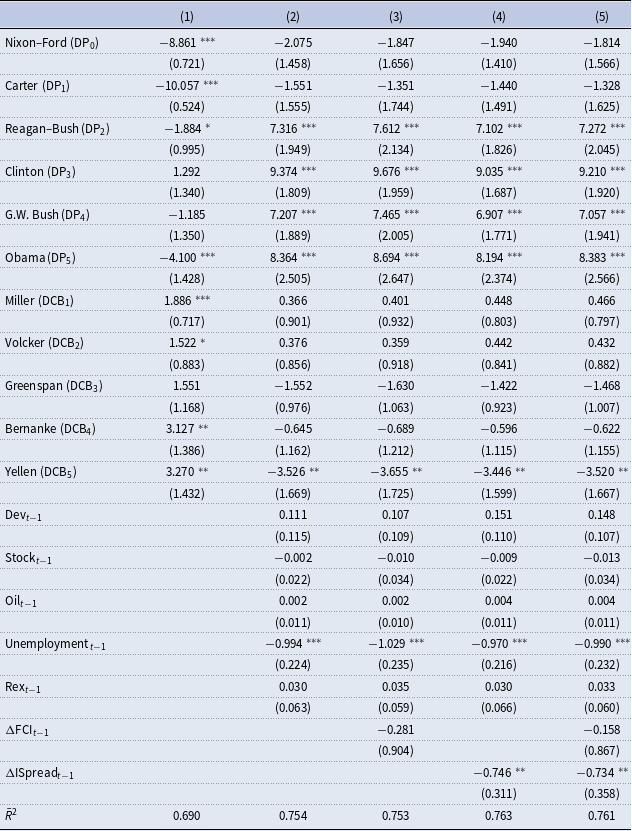
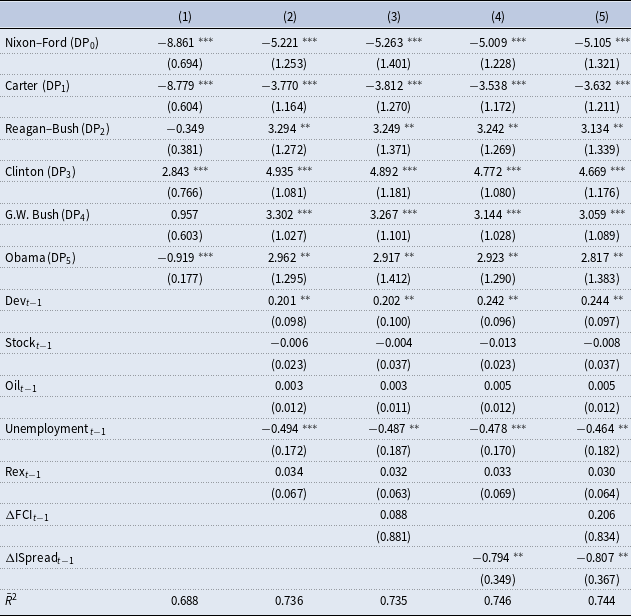
Table 3 reports the empirical results using the regression models in equation (7) with Newey–West heteroscedasticity and autocorrelation corrected (HAC) standard errors in parentheses.Footnote 12 To start, column (1) of Table 3 indicates that all of the regime-shift coefficients, except that for the Reagan–Bush and G.W. Bush regimes, are statistically significant at the 1% level. That is, deviations from the optimal Taylor rule are significantly linked to political factors, with such simple political regime change models accounting for about 69% of the quarterly deviations from the optimal Taylor rule.
Presidential regimes and deviations from optimal Taylor rule (1976Q2–2016Q4)
Note: The regression model is
 $Dev_t = \sum _{j=1}^p\boldsymbol{\beta _j^{'} X_{t-j}} + \sum _{j=0}^k\gamma _{j}\text{DP}_j + \varepsilon _{t}$
, where
 $Dev_t$
is the Taylor Rule deviation. The entries in brackets are the Newey–West HAC standard errors. Asterisks
 $^{*}$
,
 $^{**}$
, and
 $^{***}$
denote rejection at the 10%, 5%, and 1% level, respectively. Terms
 $\text{Stock}_{t}$
,
 $\text{Oil}_{t}$
,
 $\text{Unemployment}_{t}$
,
 $\text{Rex}_{t}$
,
 $\Delta \text{FCI}_{t}$
, and
 $\Delta \text{ISpread}_{t}$
are real stock returns, real oil price changes, unemployment rates, real exchange rate changes, changes in financial condition index, and changes in interest rate spreads.
Because there is compelling evidence that political regime changes exert a systematic and predictable influence on monetary policy, it is of interest to investigate other factors that may also affect the Taylor deviations. The additional control variables are lagged Taylor rule deviations, real stock returns, real oil price changes, unemployment rates, real exchange rate changes, changes in the financial condition index, and changes in interest rate spreads.Footnote
13
After adding additional covariates, as shown in columns (2)–(5), it raises the adjusted
 $R^2$
of the models by about 6%. Moreover, controlling for additional macroeconomic variables does not alter our main conclusion that politics plays an important role in explaining the US Taylor rule deviations. Apart from this, we can observe that the unemployment rate and the interest rate spread continue to have a statistically significant impact on the deviations.
While it is not easy to obtain explicit and clear evidence that the political pressures from presidents have affected monetary policy, some indirect evidence during the sample period may show historically that these political pressures were playing a role. For example, the coefficient on the Nixon–Ford era is statistically negative and of sizable magnitude, which suggests that the monetary policy pursued at the time was too expansionary compared with the optimal Taylor rule. According to Hetzel (Reference Hetzel2008, page 80), “Nixon’s disappointment with the outcome of the fall 1970 congressional elections made more acute the administration’s desire to bring Burns on board with an expansionary monetary policy
 $\ldots$
.” and “[w]ith the appearance of recession in 1970, his administration changed its priorities to reducing unemployment rather than inflation, and it looked to the Fed for help.” Moreover, using the relevant conversations from the Nixon tapes available at the National Archives and Records Administration, Abrams (Reference Abrams2006) shows that President Nixon pressured the chairman of the Federal Reserve, Arthur Burns, both directly and indirectly through Office of Management and Budget Director George Shultz, to engage in expansionary monetary policies in the run-up to the 1972 election.
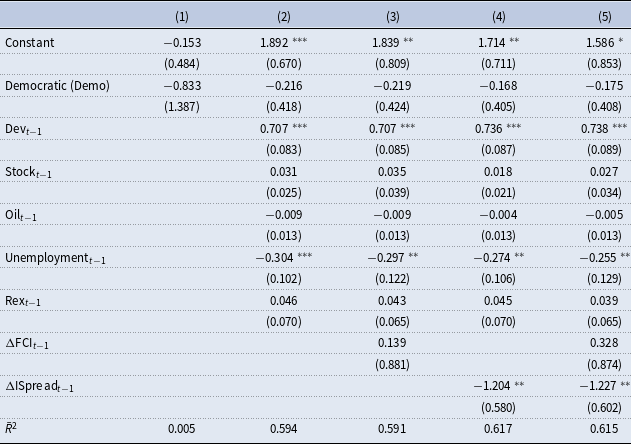
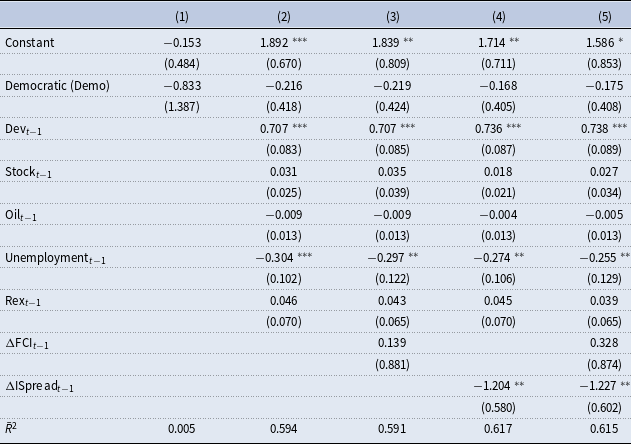
It is of interest to ask further if we can identify significant differences based on the party of the presidential administration. Because Democratic presidents are considered more liberal than Republican presidents, the argument is that Democratic presidents are more concerned with unemployment (or growth) and less with inflation and hence associated with more expansionary monetary policy (see, e.g. Hibbs, Reference Hibbs1977). We examine this presidential partisan model with a constant term by using a Democratic dummy variable where
 $\text{Demo}=1$
for Democratic administrations.
Table 4 details the results. As shown, the average deviations are lower under Democratic presidents, but the differences are not statistically significant. This finding coincides with Blinder and Watson (Reference Blinder and Watson2016) that while the average levels of interest rates are lower under Democratic presidents, these are not significant. However, after controlling for additional variables, we observe that unemployment rates and credit risk still exhibit a significant effect on the deviations. As well, the sharp decline in the adjusted
 $R^2$
relative to Table 3 suggests that a model using dummy variables for individual presidents fits the data significantly better than one with only a presidential party dummy, suggesting that not all Democrats/Republicans are alike.Footnote
14
Presidential partisan regimes and deviations from optimal Taylor rule (1976Q2–2016Q4)
Note: The regression model is
 $Dev_t = \sum _{j=1}^p\boldsymbol{\beta _j^{'} X_{t-j}} + \sum _{j=0}^k\gamma _{j}\text{DP}_j + \varepsilon _{t}$
, where
 $Dev_t$
is the Taylor Rule deviation. The entries in brackets are the Newey–West HAC standard errors. Asterisks
 $^{*}$
,
 $^{**}$
, and
 $^{***}$
denote rejection at the 10%, 5%, and 1% level, respectively. See notes to Table 3 for additional details about the macroeconomic variables.
4.2.2 Fed chair turnover models
We now turn our attention to whether the power of the Fed chair is a key factor in explaining the deviations from the optimal Taylor rule. The hypothesis is that the preferences of the Fed chair play a significant role in determining subsequent monetary policy (see, e.g. Chappell et al. Reference Chappell, McGregor and Vermilyea2004).
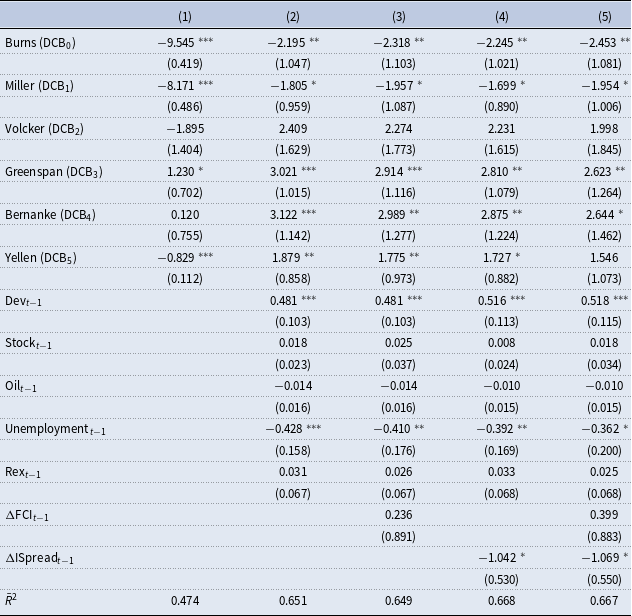
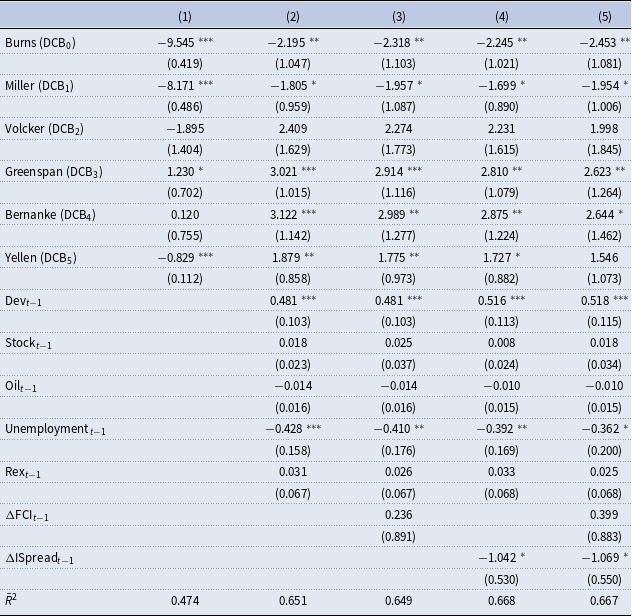
Table 5 presents the results for the Fed chair models. As shown in column (1), simple Fed chair regime changes can account for about 47% of the quarterly variations in the Taylor rule deviations. Moreover, all the Fed chair dummy variables, except Volcker and Bernanke, are statistically significant, suggesting that how interest rates deviate from the optimal Taylor rule could differ under different Fed chairs. As argued in Blinder (Reference Blinder2007), the chairman more or less dictates the group consensus in a autocratically collegial committee; for example, the Federal Open Market Committee (FOMC). Here, the chairman may declare his or her decision to the meeting and simply inform the other members of that decision.Footnote 15 Chappell et al., (Reference Chappell, McGregor and Vermilyea2004) assert that in the policy process, the Fed chair carries greater policymaking influence, accounting for 40% to 50% of the voting weight in committee decisions. However, these results are not as robust after including additional macroeconomic and financial variables as controls (as per columns (2) to (5) in Table 5). Furthermore, the unemployment rate and the interest rate spread remain significant independent variables.
Fed chair regimes and deviations from the optimal Taylor rule (1976Q2–2016Q4)
Note: The regression model is
 $Dev_t = \theta + \sum _{j=1}^p\boldsymbol{\beta _j^{'} X_{t-j}} + \gamma \text{Demo} + \varepsilon _{t}$
, where
 $Dev_t$
is the Taylor Rule deviation, and
 $\text{Democratic}$
is the Democratic presidential dummy. The entries in brackets are the Newey–West HAC standard errors. Asterisks
 $^{*}$
,
 $^{**}$
, and
 $^{***}$
denote rejection at the 10%, 5%, and 1% level, respectively. See notes to Table 3 for additional details about the macroeconomic variables.
4.3 An evaluation of political dummy variables
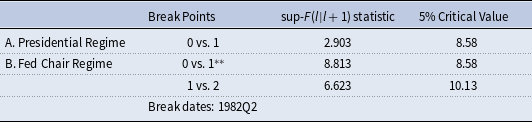
As discussed, we treat the presidential administration and the Fed chair turnover models as alternative models of political regime change. To examine whether these political regime models capture the mean shifts in the Taylor rule deviations well, we apply the Bai–Perron test (see Bai and Perron, Reference Bai and Perron2003) of multiple unknown breakpoints to check whether these remain in the residuals obtained from two simple regime-shift models without controls.Footnote 16
The results are shown in Table 6 and indicate that the presidential administration model captures the mean shifts in the Taylor deviations, whereas the Fed chairman model may not. According to Panel A of Table 6, for the residuals obtained from the presidential administration model, the sequential sup-
 $F(0|1)$
statistic is 2.90, such that we cannot reject the null hypothesis of no structural break. However, the Bai–Perron test for the residuals derived from the Fed chairman model suggests that there is a single structural break in 1982Q2 (see Panel B of Table 6). That is, the Fed chairman model may not fully capture the mean shifts in the Taylor deviations.
Bai–Perron test of multiple unknown breakpoints (1976Q2–2016Q4)

Note: Asterisks
 $^{**}$
indicates rejection at 5% levels.
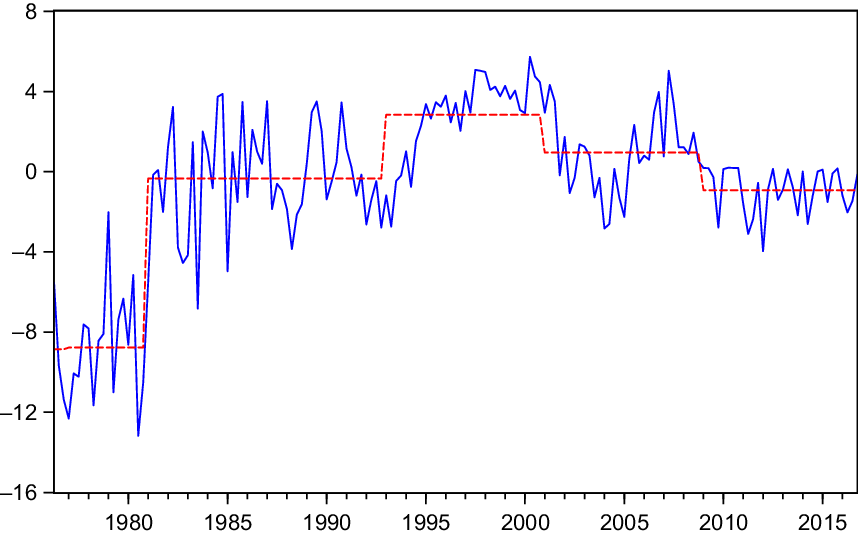
Figures 3 illustrates the estimated relationships between political changes (presidential administration) and the optimal Taylor rule deviations. The dashed (red) line indicates the fitted values of the simple presidential regime model (column (1) of Table 3).Footnote 17
Presidential regime and the optimal Taylor rule deviations.

4.4 Nested regression models
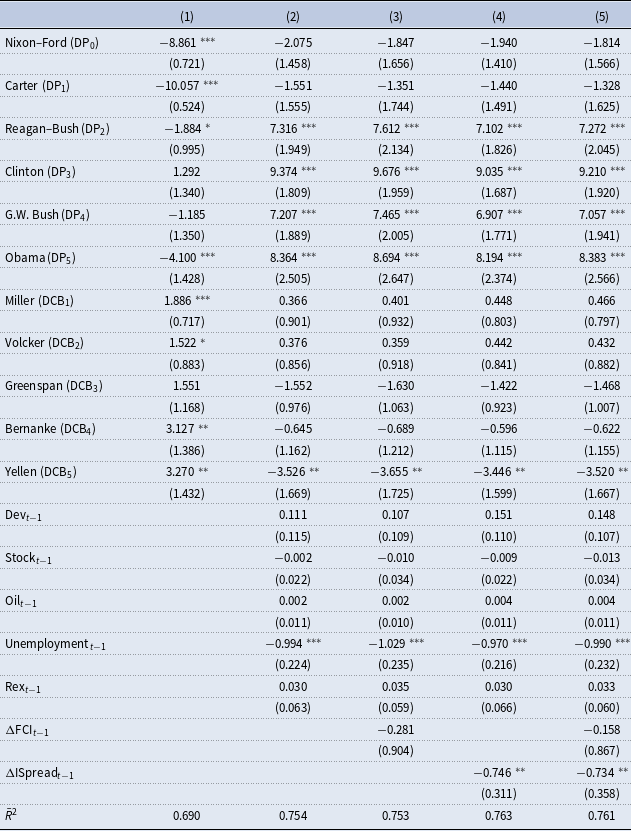
As discussed in Hakes (Reference Hakes1990), if the president only influences monetary policy through the Fed chair, the findings that presidential administrations make a difference to monetary policy may have simply picked up evidence of some chairpersons giving in to presidential desires more than others. Alternatively, if the president exerts an independent influence on monetary policy, it would be worthwhile exploring further whether an additional influence of presidential administrations remains after controlling for the Fed chair turnovers. Hence, we can examine the additional presidential effect by considering the full model, and show the empirical results in Table 7.
Nested regression models (1976Q2–2016Q4)
Note: The regression models are
 $Dev_t = \sum _{j=1}^p\boldsymbol{\beta _j^{'} X_{t-j}} + \sum _{j=0}^k\gamma _{j}\text{DP}_j + \sum _{j=1}^m\delta _{j}\text{DCB}_j + \varepsilon _{t}$
, where
 $Dev_t$
is the Taylor Rule deviation. The entries in brackets are the Newey–West HAC standard errors. Asterisks
 $^{*}$
,
 $^{**}$
, and
 $^{***}$
denote rejection at the 10%, 5%, and 1% level, respectively. See notes to Table 3 for additional details about the macroeconomic variables.
Note that the
 $\gamma _0$
measures the combined coefficients for Nixon–Ford and Burns in a simple regime-shift model without other covariates.Footnote
18
According to column (1) in Table 7, in terms of Fed chairmanship regime, all the dummies except Greenspan are statistically significant, thereby allowing for their independent influence on monetary policy for different presidential administrations. In terms of presidential regime, excepting Clinton and G.W. Bush, the coefficients for the presidential regime are significant, which suggests that the additional policy shifts also result from the presidential regime. In addition, this nested regression model explains about 69% of the quarterly deviations from the optimal Taylor rule.
Moreover, as shown in columns (2)–(5), including additional covariates raises the adjusted
 $R^2$
of the models by about 7%. However, after controlling for the additional covariates, only the Fed chairmanship regime of Yellen is significant in columns (2)–(5) of Table 7. The presidential dummies of Reagan–Bush, Clinton, G.W. Bush, and Obama are also statistically significant when considering the additional control variables. This implies that the president indeed has an independent influence on monetary policy, which is consistent with the argument that politicians influence the Fed’s monetary policy (see, e.g. Friedman, Reference Friedman1982; Weintraub, Reference Weintraub1978).
Additionally, when facing higher credit risk (the interest rate spread widens), the interest rate tends to be lower, resulting in negative deviations from the optimal Taylor rule. Moreover, the unemployment rate has a statistically significant impact on the deviations. This is because a higher unemployment rate causes monetary policy to be more expansionary, and the deviations are then allowed to become more negative. This result is no surprise, especially as one of the US Federal Reserve’s monetary policy objectives is to foster full employment, particularly after the 2009 crisis and the Great Recession.
It is worth noting that while some studies show that the president may exert independent influence on monetary policy through appointments to the Fed’s Board of Governors, Morris (Reference Morris2002) proposes a multi-institutional model to argue that this power is limited. Moreover, there are yet other channels through which politicians can influence the Fed’s monetary policy. As proposed in Potrafke (Reference Potrafke2018), politicians may signal to the Fed the desired monetary policy or may threaten to reorganize the Fed. Boettke and Smith (Reference Boettke and Smith2013) argue that fiscal deficits tend to be partially accommodated by monetary expansion in the US, and Hellerstein (Reference Hellerstein2007) suggests an election-induced deficit may place pressure on the monetary authority.
5. Robustness analysis
Several exercises are implemented for the robustness checks (see Appendix C for details). We first add extra controls including inflation, changes in inflation, real house prices, changes in unemployment rate, and unemployment gap. In the presidential regime models, the results suggest that the deviations are influenced by the level of unemployment rather than the changes in unemployment or the unemployment gap. Moreover, adding inflation, changes in inflation, or real house price changes do not alter our results that presidential regime matters. The nested regression models reveal similar results. However, the Fed chairman effect is not as robust in the Fed chair regime models.
We then widen the grid-search interval to
 $[1,6]$
because the coefficient for the inflation of the optimal rule is 3 which reaches the upper bound for
 $r_{\pi } \in [1,3]$
. The resulting parameters of the optimal rule are
 $\tilde{r}_R=0$
,
 $r_{\pi }=4.05$
, and
 $\tilde{r}_y=0.56$
. The empirical results show that our main findings on the relationship between political regime changes and Taylor rule deviations are robust.
Next, the optimal interest rate rule is evaluated by different rules including being based on maximizing unconditional welfare and based on conditional welfare with fixed interest rate inertia. The results show that our main findings are not altered.
In addition, we add the loss function-oriented objective to the central bank to search for the optimal interest rate. The presidential regime and Fed chair regime models exhibit that politics matter in explaining deviations from the optimal interest rate rule. However, the results of the nested model provide weak evidence that the president would not have an independent influence on monetary policy.
Moreover, we directly adopt the original Taylor rule as the optimal interest rate rule. The empirical results of the Fed chairman regime models suggest that the deviations from the original Taylor rule are influenced by the Fed chairs. However, the results of the presidential administration models, as well as the nested models, do not provide strong evidence that the deviations differ for different presidents. Furthermore, unemployment and interest rate spread still significantly account for regime shifts in deviations from the original Taylor rule.
Additionally, we perform subsample analyses for the period before the zero lower bound and the period after 1979Q3 when the central bank started to conduct the Taylor rule. We find that the main conclusions are unchanged.
Apart from these, we evaluate several different interest rate rules, including adopting backward- and forward-looking rules and using the PCE index and implicit price deflator for the nonfarm business sector as the measure of inflation. In these experiments, our main findings are again robust to the relationship between political regime changes and Taylor deviations.
We also incorporate the fiscal policy in the DSGE model and investigate the politics impact for the Taylor rule deviations. The results show that our main conclusions hold.
Finally, we turn off the credit channel and remove the housing sector in the DSGE model and compare the empirical findings. The results for the presidential and nested model show that the presidential regime does matter, and the unemployment rate and interest rate spread are other key factors in the Taylor deviations.
6. Concluding remarks
Since the seminal work by Taylor (Reference Taylor1993), the use of an interest rate rule (aka the Taylor rule) as a monetary policy benchmark has invoked strident and ongoing debate among academic researchers and policymakers alike. In particular, numerous studies argue that the Fed has systematically deviated from the Taylor rule, and as a result, US monetary policy has recently become more interventionist and less rules-based and predictable. Of course, there may be several reasons why the Fed chooses to deviate from a rules-based policy, and among these, politics has been shown to play a significant role in monetary policy decision-making, both in this paper and elsewhere.
In this paper, we first used a DSGE model to identify the optimal Taylor rule and then investigated whether political changes are related to mean shifts in the deviation from the optimal monetary policy rule. We argue that Taylor rule deviations are harmful to social welfare from the perspective of welfare maximization. We found that political changes, including changes in the presidential administration and Fed chairpersonship, have a systematic and predictable influence on Taylor rule deviations. That is, monetary policy changes reflect revolving presidential administrations and different Fed chairs.
From the perspective of central bank independence, central bank independence is primarily an effort to mitigate inflation bias, and therefore deviates from welfare maximization. We provided direct evidence that political influences would cause monetary policy to not accomplish welfare maximization. Although the literature has shown that the independence of central banks increases over time, we suggest that there is still room for improvement. In addition to politics, we also found that unemployment rates and the interest rate spread exert significant impacts on the observed deviations. Future work will further clarify the channels, for example, the role of US presidents (and the Senate) in choosing the members of the Board of Governors, that can explain the Taylor rule deviations for each chair.
It is worth noting the caveat that our measure of deviations from the optimal Taylor rule is model-dependent, and in the current paper, we did not consider concerns regarding financial (in)stability in the policy rule. Although financial stability is rarely seen as an explicit policy goal within central bank statutes, it is argued that in light of the 2009 financial crisis, central banks should actively use the interest rate to lean against the wind of financial instability (see, e.g. Woodford, Reference Woodford2012). Moreover, in practice, it is more than likely that the Fed’s behavior after the global financial crisis has been driven not only by its response to the output gap and the inflation gap but also by financial stress. Hence, alternative specifications of the optimal policy rule that include financial conditions would offer a plausible avenue for future study. In addition, there exists debate on the natural output gap or natural rate of unemployment (see, e.g. Laubach and Williams, Reference Laubach and Williams2003; Kozicki and Tinsley, Reference Kozicki and Tinsley2006). Likewise, some studies show that real-time expectations data would minimize endogeneity concerns and capture more adequately the forward-looking aspects of the monetary policy decision-making process (see, e.g. Orphanides, Reference Orphanides2003; Coibion and Gorodnichenko, Reference Coibion and Gorodnichenko2012). Additionally, it would be interesting to perform some counterfactual experiments by plugging the empirical interest rate deviations back in the DSGE model as monetary policy shocks and then compare the results with the unconstrained model. Finally, our model fails to characterize the interactions between monetary and fiscal policy, and as such, it is worth exploring the possibility that the optimal monetary policy rule could depend on the fiscal regime. Addressing these issues would be promising directions for future research.