INTRODUCTION
Lentil (Lens culinaris Medikus subsp. culinaris) is a self-pollinated, annual diploid species with a haploid genome size of 4063 Mbp (Arumuganathan & Earle Reference Arumuganathan and Earle1991). Lentil is highly valued as food for both humans and animals. Lentil grains are a rich source of quality proteins in the human diet and lentil straw is used for animal feed in the Mediterranean region (Erskine et al. Reference Erskine, Rihawi and Capper1990). Lentil is a rich source of protein, fat, mineral, fibre, carbohydrate, phosphorus and carotene (Bhatty Reference Bhatty1988; Savage Reference Savage1988). The split/de-hulled red lentil seeds are used as dal, cooked with rice or wheat, lentil soup or deep fried and eaten as a snack (South Asia), mujaddarah (Mediterranean region) and salad (Europe). The crop is grown globally on 4·24 million ha, producing 4·55 million tonnes (FAO 2014). Lentil is grown in 55 countries and the major lentil-producing regions are South and West Asia, North Africa, North America and Australia. In India, traditionally grown lentil is ‘microsperma’ and ‘pilosae’, with a narrow genetic base (Ferguson et al. Reference Ferguson, Robertson, Ford-Lloyd, Newbury and Maxted1998b ; Kumar et al. Reference Kumar, Gupta, Chandra, Singh, Ali, Singh, Kumar and Dhar2004) exhibiting low seedling vigour, slow leaf area development, high rate of flower drop, low pod setting, poor dry matter accumulation, low harvest index, lack of lodging resistance and lack of resistance to biotic and abiotic stresses. Pod dehiscence, lodging and sub-optimal crop management are the agronomic problems associated with the crop. In India, lentil is grown on 1·89 million ha, producing 1·13 million tonnes (2013–14). Compared with 1961, the area has increased from 0·79 to 1·89 million ha and the productivity from 0·35 to 1·13 million tonnes. However, the productivity in India remains lower than in Canada and Turkey. During 2013–14, India imported 0·70 million tonnes of lentil to meet domestic demand. The broadening of the genetic base of pilosae using Mediterranean germplasm, including its wild species, has been recommended (Ladizinski et al. Reference Ladizinski, Braun, Goshen and Muehlbauer1984; Erskine Reference Erskine1997; Rahman et al. Reference Rahman, Sarker, Kumar, Ali, Yadav, Rahman, Erskine, Muehlbauer, Sarker and Sharma2009) for enhancing and stabilizing lentil production in the Indian sub-continent.
Barulina (Reference Barulina1930) was the first to record a detailed morphological description of lentil land races and species from Asia. Morphological variations in lentil germplasm and harsh environmental conditions have been evaluated to determine a considerable range of variation in lentils (Erskine & Witcombe Reference Erskine, Witcombe and Erskine1984; Ali et al. Reference Ali, Keatinge, Khan and Ahmad1991; Bakhsh et al. Reference Bakhsh, Zubair and Ghafoor1991). Germplasm evaluation and characterization facilitates breeders in identifying germplasm desirable for breeding programmes. However, the major limitations are a low availability of morphological markers, poorly established inheritance and environmental influences at different growth stages. In lentils, like other pulses, selecting for yield and its components is not very effective because of the major effects of environmental factors and their interaction with genotypes. The precise characterization of genotypes and measurement of genetic relationships is facilitated by DNA markers (Soller & Beckmann Reference Soller and Beckmann1983): those linked to agronomic traits could increase the breeding efficiency by considerably reducing the number of backcross generations required and by avoiding expensive, tedious and subjective phenotypic selection (Qureshi et al. Reference Qureshi, Saha, Kantety and Jenkins2004). However, the success of a molecular breeding programme depends on the selection and use of suitable markers. The DNA markers must be simple, efficient, polymorphic and uniformly distributed across the genome. Microsatellites or simple sequence repeats (SSRs) are short DNA fragments consisting of small motifs of 1–6 tandem repeat base pairs flanked by conserved sequences. Simple sequence repeats are polymerase chain reaction (PCR)-based, co-dominant, multi-allelic and are randomly dispersed throughout the genome.
Previous studies on molecular characterization by randomly amplified polymorphic DNA, restricted fragment length polymorphism, amplified fragment length polymorphism, inter-SSRs and sequence-tagged microsatellites have been conducted to assess genetic diversity and phylogenetic analysis within and between Lens species (Havey & Muehlbauer Reference Havey and Muehlbauer1989; Abo-elwafa et al. Reference Abo-elwafa, Murai and Shimada1995; Sharma et al. Reference Sharma, Dawson and Waugh1995, Reference Sharma, Knox and Ellis1996; Ford et al. Reference Ford, Pang and Taylor1997; Eujayl et al. Reference Eujayl, Erskine, Bayaa, Baum and Pehu1998b ; Ferguson et al. Reference Ferguson, Newbury, Maxted, Ford-Lloyd and Robertson1998a ; Duran & de la Vega Reference Duran and de la Vega2004; Fikiru et al. Reference Fikiru, Tesfaye and Bekele2007; Agrawal & Katiyar Reference Agrawal and Katiyar2008; Tewari et al. Reference Tewari, Dikshit, Jain, Kumari and Singh2012). Limited reports are available on gene mapping and gene pyramiding (Eujayl et al. Reference Eujayl, Baum, Powel, Erskine and Pehu1998a ; Tar'an et al. Reference Tar'an, Buchwaldt, Tullu, Banniza, Warkentin and Vandenberg2003; Tullu et al. Reference Tullu, Buchwaldt, Warkentin, Taran and Vandenberg2003; Duran et al. Reference Duran, Fratini, Garcia and de la Vega2004; Kahraman et al. Reference Kahraman, Kusmenoglu, Aydin, Aydogan, Erskine and Muehlbauer2004; Saha et al. Reference Saha, Sarker, Chen, Vandemark and Muehlbauer2010) in lentil. Different levels of genome conservation and synteny in grain legumes have been established by comparative genome mapping (Simon & Muehlbauer Reference Simon and Muehlbauer1997; Kalo et al. Reference Kalo, Seres, Taylor, Jakab, Kevei, Kereszt, Endre, Ellis and Kiss2004; Phan et al. Reference Phan, Ellwood, Hane, Ford, Materne and Oliver2007; Hougaard et al. Reference Hougaard, Madsen, Sandal, de Carvalho Moretzsohn, Fredslund, Schauser, Nielsen, Rohde, Sato, Tabata, Bertioli and Stougaard2008; Sharpe et al. Reference Sharpe, Ramsay, Sanderson, Fedoruk, Clarke, Rong, Kagale, Vijayan, Vandenberg and Bett2013). To study the genetic diversity in Lens species, Reddy et al. (Reference Reddy, Rathour, Kumar, Katoch and Sharma2009) used cross-genera legume SSRs from Trifolium pretense, Medicago truncatula and Pisum sativum.
Simple sequence repeats can be developed from DNA libraries and expressed sequence tags (EST): EST-SSRs have been developed rapidly and cheaply through EST database mining (Gupta et al. Reference Gupta, Rustgi, Sharma, Singh, Kumar and Balyan2003; Bhat et al. Reference Bhat, Krishna, Hendre, Rajendrakumar, Varshney and Aggrawal2005; Choudhary et al. Reference Choudhary, Sethy, Shokeen and Bhatia2009; Mishra et al. Reference Mishra, Gangadhar, Nookaraju, Kumar and Park2012; Fan et al. Reference Fan, Zhang, Liu, Li, Song, Wang, Zhang and Wu2013). The ESTs are located in the transcribed region of the genome (Liang et al. Reference Liang, Chen, Hong, Liu, Zhou, Li and Guo2009) and these regions may be associated with the genes for important agronomic traits. Since the development of EST-SSRs is cheap and easy, they are preferred over genomic microsatellites: they can also serve as anchor markers for comparative and evolutionary studies (Varshney et al. Reference Varshney, Sigmund, Borner, Korzun, Stein, Sorrells, Langridge and Graner2005) and have been widely transferable across taxonomic boundaries (Yamamoto et al. Reference Yamamoto, Kimura, Sawamura, Kotobuki, Ban, Hayashi and Matsuta2001; Decroocq et al. Reference Decroocq, Fave, Hagen, Bordenave and Decroocq2003; Chagne et al. Reference Chagne, Chaumeil, Ramboer, Collada, Guevara, Cervera, Vendramin, Garcia, Frigerio, Echt, Richardson and Plomion2004; Liewlaksaneeyanawin et al. Reference Liewlaksaneeyanawin, Ritland, El-Kassaby and Ritland2004; Gutierrez et al. Reference Gutierrez, VazPatto, Huguet, Cubero, Moreno and Torres2005; Pashley et al. Reference Pashley, Ellis, McCauley and Burke2006; Gasic et al. Reference Gasic, Han, Kertbundit, Shulaev, Iezzoni, Stover, Bell, Wisniewski and Korban2009; Choudhary et al. Reference Choudhary, Sethy, Shokeen and Bhatia2009; Mnejja et al. Reference Mnejja, Garcia-Mas, Audergon and Arus2010). Several studies have reported the transferability of microsatellites from one species/genera of grain legumes to another (Choumane et al. Reference Choumane, Winter, Baum and Kahl2004; Eujayl et al. Reference Eujayl, Sledge, Wang, May, Chekhovskiy, Zwonitzer and Mian2004; Pandian et al. Reference Pandian, Ford and Taylor2004; Datta et al. Reference Datta, Kaashyap and Kumar2010a , Reference Datta, Mahfooz, Singh, Choudhary, Singh and Kumar b , Reference Datta, Kaashyap, Singh, Gupta, Anjum, Mahfooz and Gupta2012, Reference Datta, Mahfooz, Singh, Choudhary, Chaturvedi and Nadarajan2013; Sathya & Jayamani Reference Sathya and Jayamani2013; Almeida et al. Reference Almeida, Leitao, Caminero, Torres, Rubiales and VazPatto2014). The present study was conducted to analyse the potential use of EST-SSRs in characterizing the genetic variability in different accessions of cultivated and wild Lens species. It is the first study evaluating genetic diversity among cultivated and wild Lens by using EST-SSRs.
MATERIALS AND METHODS
Plant materials
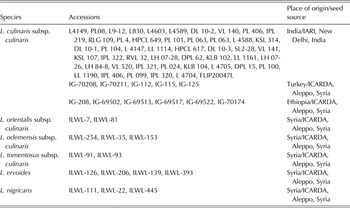
Seventy-three diverse genotypes of three Lens species were used in the present study. The voucher specimen/accession was sourced from the International Centre for Agricultural Research in the Dry Area (ICARDA), Aleppo, Syria; and Indian Agricultural Research Institute, New Delhi and Indian Institute of Pulses Research, Kanpur, India (Table 1). The cultivated lentils originated from the wild progenitor L. culinaris subsp. orientalis. Lens species are widely distributed in the Mediterranean region and accessions have been collected by ICARDA. The cultivated lentils from India comprised microsperma and macrosperma lines and their derivatives.
Sources of 73 accessions of different Lens species used in the present study

Detection of simple sequence repeat-containing sequences through expressed sequence tag database mining
In total, 9513 L. culinaris EST sequences were retrieved from the dbEST/GenBank database (http://www.ncbi.nlm.nih.gov), with accession numbers gi|268547094| to gi|268537582 on 15 January 2012. The ESTs were trimmed for Poly A tails and vector sequence contamination was removed using the SeqClean program (Masoudi-Nejad et al. Reference Masoudi-Nejad, Tonomura, Kawashima, Moriya, Suzuki, Itoh, Kanehisa, Endo and Goto2006). Using the CAP3 program (Huang & Madan Reference Huang and Madan1999), the trimmed EST sequences were assembled into unigenes to reduce redundancy in the criteria of at least 40 base analogues and 75% identity between one end of a read and one end of other reads. The unigenes were investigated for the presence of putative SSRs by using Troll (Martins et al. Reference Martins, Lukas, Neves and Bertioli2009). Each sequence was searched for the possible combinations of dinucleotide, trinucleotide, tetranucleotide, pentanucleotide and hexanucleotide repeats, with the criteria of minimum number of repeats of nine for dinucleotide, four for trinucleotide and three each for tetra-, penta- and hexa-nucleotides.
Expressed sequence tag-simple sequence repeat primer design
One hundred and six SSR primers were designed using Primer3 (Rozen & Skaletsky Reference Rozen, Skaletsky, Misener and Krawetz2000) and following standard parameters: (1) optimal annealing temperature of 55–65 °C, with 60 °C as the optimal temperature; (2) percentage guanine–cytosine (GC) content of 40–60%; (3) target amplicon size of 100–400 bp; (4) primer length of 18–27 bp, with 20 bp as the optimal length. The output files generated the descriptive title of an EST sequence, SSR motif in each sequence, length and composition of SSR, number of repeats and SSR start and end positions (Supplementary Table S1, available from http://journals.cambridge.org/AGS). The putative functions of SSR loci were assigned through comparison with the non-redundant sequence database at National Center for Biotechnology Information by using the basic local alignment search tool (BLAST) BLASTX program (http:blast.ncbi.nlm.nih.gov/Blast.cgi). The threshold for a significant BLAST hit was set at an e value of <1e−10. The functional categories were assigned on the basis of results of BLAST searches performed using a specially formatted gene ontology database (http://amigo.geneontology.org/).
Polymerase chain reaction amplification and gel electrophoresis
The genomic DNA from a plant of each accession was isolated using the cetyl trimethyl ammonium bromide method, as described by Murray & Thompson (Reference Murray and Thompson1980). Polymerase chain reaction mixtures of 20 µl comprised 10 × buffer (100 mM Tris-HCl, 500 mM KCl, 15 mM MgCl2 and 0·01% gelatin), 200 µM dNTP, 0·5 µM of forward and reverse primers, 1 U Taq DNA polymerase (PCR reagents and primers from Sigma–Aldrich, Spruce Street, St. Louis, USA) and c. 40 ng DNA. Polymerase chain reaction was performed using the VeritiTM (Applied Biosystems, Life Technologies, Singapore) thermal cycler. The PCR protocol involved one denaturation cycle at 94 °C for 4 min followed by 30 cycles at 94 °C for 1 min, annealing at 59–62 °C (depending upon the primer) for 30 s and extension at 72 °C for 1 min with a final extension at 72 °C for 10 min. The amplified fragments were separated on 3% metaphor™ agarose gels (Lonza, Rockland, ME, USA) and visualized using ethidium bromide staining. The band size was obtained by comparing the fragments to a 100 bp DNA ladder (MBI, Fermentas, Vilnius, Lithuania).
Statistical analysis
The fragments amplified by EST-SSR primers were scored manually in terms of position of the bands relative to the ladder. The diffused bands or bands revealing ambiguity in scoring were considered as missing data and designated as 9, compared with 1 for the presence of a band and 0 for the absence of a band in the data matrix. A binary matrix was then transformed to a genetic similarity matrix by using Jaccard's coefficient (Jaccard Reference Jaccard1908). A dendrogram based on similarity coefficients was prepared using the unweighted pair group method with arithmetic mean employing the statistical software NTSYS-PC 2·02 (Rohlf Reference Rohlf2000). The robustness of the clusters was evaluated by bootstrap analysis using WIN BOOT software (Yap & Nelson Reference Yap and Nelson1996). Powell et al. (Reference Powell, Morgante, Andre, Hanafey, Vogel, Tingey and Rafalski1996) reported the utility of a marker for detecting genetic variation. It includes (a) expected heterozygosity (Hn) by calculating the sum of the squares of allele frequencies, Hn = 1 − Σpi2, where pi is the allele frequency for the ith allele (Nei Reference Nei1973), (b) arithmetic mean heterozygosity (Hav) was calculated as, Hav = ΣHn/n, where n is the number of markers (loci) analysed, (c) effective multiplex ratio (EMR = npβ), which is the product of several polymorphic loci (np) in the germplasm analysed and a fraction of polymorphic markers (β) and (d) marker index (MI), which is the product of the expected heterozygosity (Hav) and the effective multiplex ratio. To measure how informative EST-SSR was, polymorphism information content (PIC) was calculated using the formula PIC = 1−ΣPi − ΣΣPiPj, where ‘i’ is the total number of alleles detected for SSRs, ‘Pi’ is the frequency of the ith allele in the set of 100 genotypes investigated and j = i + 1 (Botstein et al. Reference Botstein, White, Skolnick and Davis1980). The resolving power (Rp) of each primer was calculated as Rp = ΣIb, where band informativeness (Ib) is 1 − [2 × (0·5 − p)] and p is the proportion of genotypes of different Lens species containing that band (Prevost & Wilkinson Reference Prevost and Wilkinson1999). The MI was determined using the following equation: EMR × diversity index (DI), where the EMR was the number of polymorphic markers generated per assay and the DI was the average PIC value (Powell et al. Reference Powell, Morgante, Andre, Hanafey, Vogel, Tingey and Rafalski1996).
RESULTS
Expressed sequence tag-simple sequence repeats in lentil
In total, 9513 EST sequences were downloaded from the Genbank database. Cluster analysis produced 4043 unigenes including 951 contigs and 3092 singletons. Contig length ranged from 366 to 3335 bp. The 40 assembled contigs that were <500 bp were not considered for SSR analysis. Microsatellite primers were developed from flanking sequences in the repeats containing unigenes. The unigene analysis identified 251 SSRs, of which six unigenes identified more than one SSR. Different SSR motifs revealed dinucleotides (16·3%), trinucleotides (42·4%), tetranucleotides (6·4%), pentanucleotides (13·7%) and hexanucleotides (16·7%).
Expressed sequence tag-simple sequence repeat assays and their informativeness
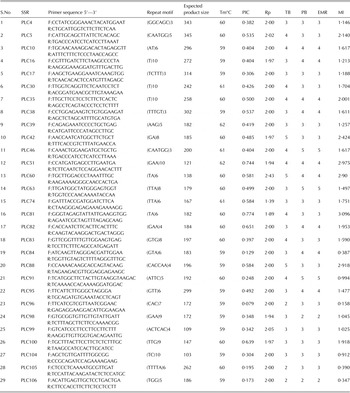
Of 251 SSR-containing unigenes, 106 were used for primer development at the Indian Agricultural Research Institute (Pusa Institute). Among them, 80 amplified successfully in Lens genotypes and 26 did not produce any amplified product. Fifty-one displayed monomorphic bands in the studied Lens species. Twenty-nine EST-SSRs produced clear scorable polymorphic bands and were tested in three Lens species. The 29 EST-SSRs studied produced an amplification fragment of expected length. In total, 99 alleles were scored, ranging from two to five alleles per locus. The total number of bands and polymorphic bands, PIC, Rp and MI calculated for each primer is presented in Table 2. The genetic diversity was calculated at each locus based on allelic frequencies among all the 73 studied genotypes. The PIC value of the studied primers ranged from 0·129 to 0·744, with a mean of 0·436. The marker was regarded as informative when PIC was ⩾0·5. On the basis of the PIC values, the informative primers identified were Pusa L. culinaris (PLC) 5, 35, 38, 51, 60, 74, 81, 82, 88 and 100. The MI values ranged from 0·994 to 3·096. High MI values were recorded for PLC 5, 35, 42, 51, 81 and 88.
Characterization of expressed sequence tags-simple sequence repeats (EST-SSRs) and their polymorphism in studied Lens species

EMR, effective marker ratio; MI, marker index; PB, polymorphic bands; PIC, polymorphism information content; PLC, Pusa L. culinaris; Rp, resolving power; SSR, simple sequence repeats; TB, total number of bands; Tm, annealing temperature.
Tm°C, PIC, Rp, TB, PB, EMR, MI values were computed for 29 EST-SSRs.
Functional analysis of expressed sequence tag-simple sequence repeats
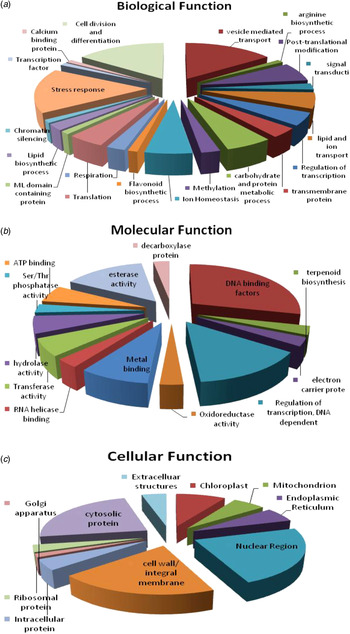
Simple sequence repeat-containing unigenes were categorized using gene ontology annotation for biological processes, cellular components and molecular function (Fig. 1). Functions similar to those of other species were exhibited by 94·2% of the total SSR (251)-containing ESTs, whereas no significant similarity was exhibited by the remaining ESTs, with the previously characterized functions. Most SSR sequences were linked to the positive regulation of cellular and biological processes. Among the SSR-containing unigenes, 45·2% were involved in biological processes, 36·3% in cell components and 18·4% in important molecular functions. Several SSR-containing unigenes were involved in transport-related biological functions of lipids, trans-membrane proteins and metal ions (Fig. 1(a)). Proteins responsible for the stress response and for biotic stresses were also encoded by the EST-SSRs. Biological processes also identified some proteins (5·1%) involved in cell division and differentiation. A major portion of the proteins (42·7%) involved in molecular functions (Fig. 1(b)) were represented by DNA-binding transcription factors and proteins regulating transcription. The high proportion of SSRs mapped to cellular components was related to the cell wall/integral membrane and nuclear region (Fig. 1(c)). A major category of proteins representing cellular components includes proteins localized in nuclear regions and various intracellular compartments such as the endoplasmic reticulum, plastids, mitochondrion, ribosome and golgi apparatus.
Functional characterization of 251 expressed sequence tags (ESTs) containing simple sequence repeats (SSR) into (a) biological function, (b) molecular function and (c) cellular function by gene ontology (GO) annotation. Colour online

Transferability of expressed sequence tag-simple sequence repeat among Lens species
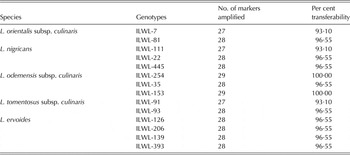
Transferability of EST-SSRs representing the coding regions of the genome was studied in three Lens species. The studied accessions included ILWL 7 and 81 (L. culinaris subsp. orientalis), ILWL 22, 111 and 445 (Lens nigricans), ILWL 35, 153 and 254 (L. culinaris subsp. odemensis), ILWL 91 and 93 (L. culinaris subsp. tomentosus), and ILWL 126, 206, 139 and 393 (L. ervoides). High transferability of EST-SSRs from L. culinaris subsp. culinaris to related Lens species (0·93–1·00) was observed (Table 3).
Cross-species amplification of Lens expressed sequence tags-simple sequence repeats (EST-SSRs)

Diversity and genetic relationship analysis
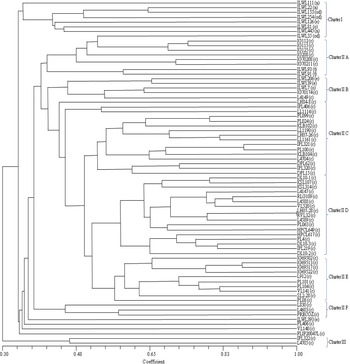
The genotypic data of all 99 alleles were used to calculate pair-wise similarity among the 73 Lens accessions. The similarity coefficient values ranged from 0·30 to 1·00. The dendrogram grouped 73 Lens accessions into three clusters; four genotypes (ILWL 393, PL 406, VL 140 and FLIP 2004 4L) were not grouped in any cluster (Fig. 2). Three accessions of L. nigricans (ILWL 111, 22 and 445), two accessions of L. culinaris subsp. odemensis (ILWL 254 and 153) and one accession of Lens ervoides (ILWL 126) and L. culinaris subsp. orientalis (ILWL 81) were grouped in Cluster I. All these accessions originated in the Mediterranean region and exhibited 34% similarity. Cluster II comprised six sub-clusters. Sub-cluster II A comprised two accessions of L. culinaris subsp. tomentosus (ILWL 91 and 93), one accession of L. culinaris subsp. odemensis (ILWL 35) and six Mediterranean land races (IG 112, 115, 125, 208, 70208 and 702011). Accession ILWL 35 exhibited 53% similarity with IG 112, 115 and 125, whereas ILWL 91 and 93 exhibited 8% similarity with other genotypes of this cluster. Sub-cluster II B comprised two accessions of L. ervoides (ILWL 206 and 139) and one accession of L. culinaris subsp. orientalis (ILWL 7), one accession of Mediterranean land race (IG 70174) and cultivated Indian accession (L 4149). Accessions ILWL 206 and 139 exhibited 65% similarity with each other. Sub-cluster II C comprised 16 accessions of cultivated lentil developed in India. These included microsperma and macrosperma types (developed using the Mediterranean germplasm). Sub-cluster II D included 17 accessions of advanced breeding lines of microsperma and macrosperma, indicating the narrow genetic base of cultivated lentils and the repeated use of few parents in the hybridization programme. Sub-cluster II E included four microsperma accessions of the Mediterranean land races (IG 69502, 69513, 69517 and 69522) and six Indian accessions (L 912, PL 101, PL 104, VL 141, SL 2–28 and PL 08). Sub-cluster II F included three early maturing lentil accessions L 830, L 4603 and Precoz, which is the main source of early maturity, rust and bold seed size in the Indian programme. Accession L 830 is the first early maturing variety developed in India, while L 4603 is a known donor for early maturity and multiple disease resistance and is used in lentil breeding programmes. Two genotypes included in Cluster III (PL 322 and L 4705) exhibited 46% similarity.
An unweighted pair group method with arithmetic mean (UPGMA) tree of the 73 Lens accessions using 29 expressed sequence tags-simple sequence repeats (EST-SSRs) based on Jaccard similarity matrix. The symbols c o, od, t, n and e represent L. culinaris subsp. culinaris, L. culinaris subsp. orientalis, L. culinaris subsp. odemensis, L. culinaris subsp. tomentosus, L. nigricans and L. ervoides, respectively.

DISCUSSION
Microsatellites are an important tool in genetic diversity analysis, evolutionary applications and comparative genome mapping. Simple sequence repeats are genomic SSRs or EST-SSRs. The standard method for developing genomic SSRs involves creation of a small-insert genomic library, subsequent hybridization with tandemly repeated oligonucleotides and sequencing of candidate clones. The process is labour-and time-intensive; however, EST-SSRs developed through EST database mining are cheap, easy to develop and are preferred because of their higher cross-species transferability. Expressed sequence tag-SSRs are known for higher transferability, so they can be used in related genus/species (Varshney et al. Reference Varshney, Sigmund, Borner, Korzun, Stein, Sorrells, Langridge and Graner2005; Pashley et al. Reference Pashley, Ellis, McCauley and Burke2006). Therefore, the L. culinaris database was screened for the presence of microsatellite sequences. In total, 4043 unique EST contigs and singletons were obtained from 9513 EST sequences.
The EST-SSRs developed from cultivated species could successfully amplify three species of Lens. This considerable degree of transferability was consistent with that reported in different species (Sim et al. Reference Sim, Yu, Jo, Sorrells and Jung2009; Yao et al. Reference Yao, Zheng, Cai, Gao, Wang, Cao and Teng2010; Dikshit et al. Reference Dikshit, Singh, Singh, Jain, Kumari and Sharma2012; Datta et al. Reference Datta, Mahfooz, Singh, Choudhary, Chaturvedi and Nadarajan2013; Zhai et al. Reference Zhai, Liu, Zhu, Xu, Jiang and Gong2013). The high levels of transferability of EST-SSRs indicated the conserved nature of coding sequences that are significantly more transferable owing to the trinucleotide repeats in coding regions than their untranslated counterparts. Greater frequency of trinucleotides has been reported in other plant species, including common bean (Blair et al. Reference Blair, Hurtado, Chavarro, Muñoz-Torres, Giraldo, Pedraza, Tomkins and Wing2011), peanut (Yuan et al. Reference Yuan, Gong, Meng, Li, Dang, Guo and He2010) and legumes (Jayashree et al. Reference Jayashree, Punna, Prasad, Bantte, Hash, Chandra, Hoisington and Varshney2006). Abundant trinucleotide motifs may be obtained due to the possibility of 64 different combinations of nucleotides present in the genetic code, as suggested by Metzgar et al. (Reference Metzgar, Bytof and Wills2000). The most frequent trinucleotide motif in the Lens cultivars was GAA/TTC, followed by TAT/ATA, CAA/TTG and TTA/TAA. Gong et al. (Reference Gong, Xu, Mao, Hu, Zhang, Ding and Li2010) also observed GAA as the most abundant trinucleotide motif in the EST-SSRs of P. sativum.
The PIC values indicate the discriminating nature of molecular markers. Markers with PIC values of >0·5 are regarded as efficient in discriminating genotypes and are extremely useful in detecting the polymorphism rate at a particular locus (DeWoody et al. Reference DeWoody, Honeycutt and Skow1995). Ten EST-SSRs recorded PIC values of >0·5, indicating the discriminating nature of these markers. High PIC values indicated the efficiency of these markers in differentiating closely related Lens species. The Rp values of primers also estimated the ability of informative primers to differentiate between genotypes. The primer exhibiting low Rp values are least useful for discriminating between the genotypes. In the present study, the mean Rp was 1·98 and the value ranged from 1·397 to 2·438. High Rp values were recorded for PLC 5, 60 and 99.
Microsatellite-containing unigenes were screened for gene ontology terms to identify their role in various cellular, molecular and biological processes. More than 0·90 of the SSR-containing unigenes had a sequence similarity with expressed genes. Expressed sequence tags in the present study were identified from a seed tissue specific library and therefore, DNA-binding transcription factors and proteins involved in regulating transcription comprised a majority of the EST microsatellites. The markers could have added to the information regarding genes in molecular pathways. Because they have been devised from expressed regions of the genome, many proteins are a component of metabolic pathways, such as the arginine biosynthetic pathway and lipid biosynthetic pathway, observed in previous comparative analysis in other crops.
In the present study, 29 EST-SSRs were used to explore genetic diversity in three Lens species. Species-specific clustering was not observed because of bias from clustering due to insufficient number of microsatellites, poor resolution for product of amplification and recording of only easily recognizable bands. Cluster I comprised wild Lens species adapted to the Mediterranean region: cultivated lentil evolved from wild types in this region. Cluster II A included mainly Mediterranean landraces and two accessions of crossable species L. culinaris subsp. tomentosus. Cluster II B included mainly wild and cultivated forms from Mediterranean region with varying similarity coefficients among the genotypes within the cluster. Species/origin specific clustering was not recorded for this cluster. In the present study limited number of EST-SSRs was utilized to characterize 73 accessions of different Lens species. EST-SSRs are located in coding regions and are expected to be less polymorphic in comparison with SSRs due to their conserved nature (Varshney et al. Reference Varshney, Sigmund, Borner, Korzun, Stein, Sorrells, Langridge and Graner2005). The clustering of several Indian lentil accessions in Cluster II C and D indicates the narrow genetic base of these pilosae type cultivars. The narrow genetic base of pilosae types has been reported previously by Erskine et al. (Reference Erskine, Chandra, Chaudhary, Malik, Sarker, Sharma, Tufail and Tyagi1998). However, Cluster II E comprised both Indian and Mediterranean germplasm lines indicating the utilization of Mediterranean germplasm lines in Indian lentil hybridization programmes. Based on clustering pattern in Cluster II B,C and D it is evident that Indian cultivated lentil requires broadening of the genetic base using genotypes from Cluster I, IIA and IIB.
Erskine et al. (Reference Erskine, Adham and Holly1989) recorded regional grouping of 1370 lentil collections based on evaluation of quantitative traits, whereas Roy et al. (Reference Roy, Islam, Sarker, Malek, Rafii and Ismail2013) could not find any relationship between geographic origin and genetic diversity. Lombardi et al. (Reference Lombardi, Materne, Cogan, Rodda, Daetwyler, Slater, Forster and Kaur2014) investigated levels of genetic diversity within lentil germplasm using single nucleotide polymorphisms markers. It was suggested that selection of divergent parental genotypes for breeding should be made actively on the basis of systematic assessment of genetic distance between genotypes, rather than passively based on geographical distance. Similar findings were reported by Kushwaha et al. (Reference Kushwaha, Ghimire, Yadav, Ojha and Niroula2015). Hence, it is recommended that parental selection should be based on diversity assessment. The diversity in parental lines ensures successful breeding programmes, as pointed out in previous studies (Ferguson et al. Reference Ferguson, Newbury, Maxted, Ford-Lloyd and Robertson1998a ; Kumar et al. Reference Kumar, Gupta, Chandra, Singh, Ali, Singh, Kumar and Dhar2004).The knowledge of genetic diversity is also critical for designing strategies for germplasm collection and conservation.
The genetic base could be broadened in South Asia by using wild and cultivated lines from the Mediterranean region (Ladizinski et al. Reference Ladizinski, Braun, Goshen and Muehlbauer1984; Erskine Reference Erskine1997; Erskine et al. Reference Erskine, Chandra, Chaudhary, Malik, Sarker, Sharma, Tufail and Tyagi1998; Gupta & Sharma Reference Gupta and Sharma2006; Rahman et al. Reference Rahman, Sarker, Kumar, Ali, Yadav, Rahman, Erskine, Muehlbauer, Sarker and Sharma2009; Tewari et al. Reference Tewari, Dikshit, Jain, Kumari and Singh2012). Singh et al. (Reference Singh, Singh, Kumar, Dutta, Bansal, Karale, Sarker, Amri, Kumar and Datta2014) reported that L. nigricans can be used to improve yield traits and L. ervoides for biotic stresses. However, the Mediterranean lines have longer maturity duration than South Asian lines. Lentil breeders used Precoz for transferring early maturity and bold seed size in lentils. In order to use them in a hybridization programme, maturity duration of these lines have to be synchronized under artificial conditions of 18 h light and a temperature of 18–20 °C in a glasshouse (Erskine et al. Reference Erskine, Chandra, Chaudhary, Malik, Sarker, Sharma, Tufail and Tyagi1998). Marker-assisted backcrossing and marker-assisted selection enhances the precision, efficiency and flexibility for transferring quantitative trait loci (QTL) and agriculturally important gene(s) from wild species and un-adapted germplasm (Varshney et al. Reference Varshney, Terauchi and McCouch2014). Without molecular marker technology, selecting offspring in an inter-specific population with desired alleles from wild species is difficult and at times inefficient because many unfavourable alleles from wild parents are also inherited. Linked unfavourable alleles are more problematic when several loci are selected and the donor is related to the wild species. Marker-assisted selection minimizes linkage drag flanking the gene of interest. In different crops, DNA marker-facilitated QTL mapping studies in segregating populations indicate that genomic regions from wild species can potentially enhance the yield, for example, chickpea (Singh & Ocampo Reference Singh and Ocampo1997; Thudi et al. Reference Thudi, Upadhyaya, Rathore, Gaur, Krishnamurthy, Roorkiwal, Nayak, Chaturvedi, Basu, Gangarao, Fikre, Kimurto, Sharma, Sheshashayee, Tobita, Kashiwagi, Ito, Killian and Varshney2014), pigeon pea (http://goo.gl/zrdICo), rice (Septiningsih et al. Reference Septiningsih, Prasetiyono, Lubis, Tai, Tjubaryat, Moeljopawiro and McCouch2003, Reference Septiningsih, Pamplona, Sanchez, Neeraja, Vergara, Heuer, Ismail and Mackill2009; Huang et al. Reference Huang, Wei, Sang, Zhao, Feng, Zhao, Li, Zhu, Lu, Zhang, Li, Fan, Guo, Wang, Wang, Deng, Li, Lu, Weng, Liu, Huang, Zhou, Jing, Li, Lin, Buckler, Qian, Zhang, Li and Han2010; Gamuyao et al. Reference Gamuyao, Chin, Pariasca-Tanaka, Pesaresi, Catausan, Dalid, Slamet-Loedin, Tecson- Mendoza, Wissuwa and Heuer2012; Imai et al. Reference Imai, Kimball, Conway, Yeater, McCouch and McClung2013; Uga et al. Reference Uga, Sugimoto, Ogawa, Rane, Ishitani, Hara, Kitomi, Inukai, Ono, Kanno, Inoue, Takehisa, Motoyama, Nagamura, Wu, Matsumoto, Takai, Okuno and Yano2013), wheat (Huang et al. Reference Huang, Wang, Xu and Röder2003; Fu et al. Reference Fu, Uauy, Distelfeld, Blechl, Epstein, Chen, Sela, Fahima and Dubcovsky2009; Periyannan et al. Reference Periyannan, Moore, Ayliffe, Bansal, Wang, Huang, Deal, Luo, Kong, Bariana, Mago, McIntosh, Dodds, Dvorak and Lagudah2013; Saintenac et al. Reference Saintenac, Zhang, Salcedo, Rouse, Trick, Akhunov and Dubcovsky2013), maize (Harjes et al. Reference Harjes, Rocheford, Bai, Brutnell, Kandianis, Sowinski, Stapleton, Vallabhaneni, Williams, Wurtzel, Yan and Buckler2008; Hufford et al. Reference Hufford, Xu, Van Heerwaarden, Pyhäjärvi, Chia, Cartwright, Elshire, Glaubitz, Guill, Kaeppler, Lai, Morrell, Shannon, Song, Springer, Swanson-Wagner, Tiffin, Wang, Zhang, Doebley, McMullen, Ware, Buckler, Yang and Ross-Ibarra2012), barley (Pillen et al. Reference Pillen, Zacharias and Léon2003; Miedaner & Korzun Reference Miedaner and Korzun2012) and tomato (Krieger et al. Reference Krieger, Lippman and Zamir2010). Inter-specific hybridization between early maturing Mediterranean lines and indigenous genotypes will lead to the foundation of successful lentil improvement programmes. Substantial productivity gains can also be achieved by using wild species and Mediterranean germplasm lines.
CONCLUSION
The present study was conducted to assess the use of EST-SSRs for exploring genetic diversity in Lens species. Twenty-nine EST-SSRs were developed and used to characterize the 73 accessions of Lens species, including 59 accessions of L. culinaris subsp. culinaris, 2 accessions of L. culinaris subsp. orientalis, four accessions of L. ervoides, three accessions of L. nigricans, three accessions of L. culinaris subsp. odemensis and two accessions of L. culinaris subsp. tomentosus. The EST-SSRs grouped these 73 genotypes into three main clusters. Cluster II was further divided into six sub-clusters. The transferability of EST-SSRs was studied using L. culinaris subsp. orientalis, L. ervoides, L. nigricans, L. culinaris subsp. odemensis and L. culinaris subsp. tomentosus. High transferability was recorded indicating their suitability for a wide range of applications in breeding from diversity studies and genetic mapping to QTL identification and genome analysis.
SUPPLEMENTARY MATERIAL
The supplementary material for this paper can be found at http://journals.cambridge.org/AGS
Authors are thankful to Head, Division of Genetics, Joint Director Research and Director, Indian Agriculture Research Institute, New Delhi for providing the necessary facilities and guidance. The help extended by Director, National Bureau of Plant Genetic Resources, New Delhi, in import of wild species from ICARDA, Aleppo, Syria is also duly acknowledged.