INTRODUCTION
Accurate, in-situ, diagnosis of the energy distribution in the tight focal spot regime (i.e., sub-10 µm) of existing terawatt (TW, 1012 W) and petawatt (PW, 1015 W) lasers incident on solid density targets is technically very difficult to achieve. With proposed projects such as the extreme light infrastructure (ELI) and High Power Laser Energy Research Facility (HiPER) expected to increase the power delivered from state-of-the-art laser facilities to above tens of PW, it is pertinent to develop diagnostics for accurate estimation of the on-target intensity for precise analysis of experimental data. This is especially important for high intensity interactions, i.e., fast ignition fusion, laser based ion acceleration etc., where fluctuations in intensity can substantially effect the interpretation of entire data sets. Such a monitor is also important for near solid density interactions (plasma density scale length <λlaser, the laser wavelength) that require plasma mirrors, or modified plasma density scale lengths (Dromey et al., Reference Dromey, Zepf, Gopal, Lancaster, Wei, Krushelnick, Tatarakis, Vakakis, Moustaizis, Kodama, Tampo, Stoeckl, Clarke, Habara, Neely, Karsch and Norreys2006, Reference Dromey, Kar, Bellei, Carroll, Clarke, Green, Kneip, Markey, Nagel, Simpson, Willingale, McKenna, Neely, Najmudin, Krushelnick, Norreys and Zepf2007; Kasperczuk et al., Reference Kasperczuk, Pisarczyk, Kalal, Martinkova, Ullschmied, Krousky, Masek, Pfeifer, Rohlena, Skala and Pisarczyk2008; Laska et al., Reference Laska, Badziak, Boody, Gammino, Jungwirth, Krasa, Krousky, Parys, Pfeifer, Rohlena, Ryc, Skala, Torrisi, Ullschmied and Wolowski2007; Quere et al., Reference Quéré, Thaury, Monot, Dobosz, Martin, Geindre and Audebert2006). Used to increase the laser contrast ratio (CR, the ratio of peak intensity to that at a few picoseconds before the peak), the operating conditions for the plasma mirror (namely incident intensity) determine the focusability of the reflected light (Dromey et al., Reference Dromey, Kar, Zepf and Foster2004; Levy et al., Reference Lévy, Ceccotti, D'Oliveira, Réau, Perdrix, Quéré, Monot, Bougeard, Lagadec and Martin2007). As a result, it is critical to ensure the maintenance of a high quality beam post reflection from the plasma mirror at very high intensities.
EXPERIMENTAL PERSPECTIVE AND SETUP
For experiments at major facilities (Danson et al., Reference Danson, Brummitt, Clarke, Collier, Fell, Frackiewicz, Hancock, Hawkes, Hernandez-Gomez, Holligan, Hutchinson, Kidd, Lester, Musgrave, Neely, Neville, Norreys, Pepler, Reason, Shaikh, Winstone, Wyatt and Wyborn2004, Reference Danson, Brummitt, Clarke, Collier, Fell, Frackiewicz, Hawkes, Hernandez-Gomez, Holligan, Hutchinson, Kidd, Lester, Musgrave, Neely, Neville, Norreys, Pepler, Reason, Shaikh, Winstone, Wyatt and Wyborn2005), the laser focal spot is generally diagnosed prior to the high intensity interaction using a low power alignment beam. While these techniques are generally acceptable, it is difficult, however, to diagnose the laser focal spot at the fundamental frequency (ωlaser) at the moment of arrival of the main TW-PW laser pulse, as scattering will affect the measured spot size.
As a result, there exists the possibility of large experimental uncertainty due to, for example, possible misalignment between the low and high power laser beams, and more commonly, shifting experimental parameters between final alignment and the time of shot-on-target, and shot to shot fluctuations in energy. Alternatively, a dynamic wavefront distortion can arise in the laser chain that is only present in the high-energy beam destroying focusability, while the low power focal spot can appear fine. It is therefore critical that an accurate measurement of the spatial intensity profile is performed during the interaction.
Typically, the resolution/accuracy of in-situ focal spot diagnostics, such as X-ray pinhole cameras, suffers in the tight focus regime (sub 10 µm full width half maximum) due to lateral energy transport. This result is an inaccurate estimate of the focus size. Imaging the focal spot in 3ωlaser, on the other hand, has several key advantages.
In the first instance, 3ωlaser is clearly distinct from other frequencies that may be generated in the interaction, which are not directly related to the intensity distribution in the focal volume (i.e., line radiation). Accordingly, imaging at 3ωlaser only provides a nearly noise free window on the interaction, which as will be shown, allows accurate diagnosis of extremely intense (1017 to >1021 Wcm−2) interactions with a very simple experimental setup.
Second, given the reduced wavelength for detection, the same resolution as the primary laser focusing optic (typically large aperture to give low f-number) can be achieved using optics up to a factor of three smaller in aperture. This significantly reduces the cost and space requirements of the components in the diagnostic chain and results in less sensitive alignment procedure than for the fundamental driving laser (the Rayleigh range increase by a factor of three).
Here we demonstrate imaging the intense interaction in third harmonic order (3ωlaser) as a technique for realizing an accurate estimate of the focal spot diameter.
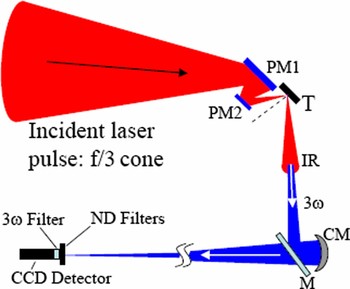
This experiment was performed on the Vulcan Petawatt at the Rutherford Appleton Laboratories delivering 600 J in 500 fs with fundamental wavelength of 1053 nm (Danson et al., Reference Danson, Brummitt, Clarke, Collier, Fell, Frackiewicz, Hancock, Hawkes, Hernandez-Gomez, Holligan, Hutchinson, Kidd, Lester, Musgrave, Neely, Neville, Norreys, Pepler, Reason, Shaikh, Winstone, Wyatt and Wyborn2004, Reference Danson, Brummitt, Clarke, Collier, Fell, Frackiewicz, Hawkes, Hernandez-Gomez, Holligan, Hutchinson, Kidd, Lester, Musgrave, Neely, Neville, Norreys, Pepler, Reason, Shaikh, Winstone, Wyatt and Wyborn2005). The focal spot of the f/3 off-axis parabola was imaged to outside the interaction vacuum chamber using an f/9 spherically curved silver coated mirror (CM, Fig. 1), giving approximately 12:1 magnification. A schematic of this setup is shown in Figure 1, including a double plasma mirror setup (PM1 and PM2), which was used for ultra high contrast interactions (CR ~ 1011). The laser intensity on the plasma mirrors was kept in the range of ~1014–1015 Wcm−2 (Dromey et al., Reference Dromey, Kar, Zepf and Foster2004). For lower contrast interactions (CR ~ 107), the plasma mirrors were removed and the primary focusing optic translated horizontally. A 16 bit optical Andor CCD with 13 µm × 13 µm pixels was used to record the image.
(Color online) Experimental schematic for 3ω imaging of the focal spot on the Vulcan Petawatt upgrade, here shown with a double plasma mirror setup (PM1 and PM2) for ultrahigh contrast interactions on the target T. The focal spot was imaged using a spherically curved silver mirror (CM) with f/9 aperture. Attenuation (105–107) of the reflected infra red (IR) beam was achieved using neutral density (ND) filters calibrated for 350 nm and via a sub-10% reflection from an uncoated glass flat with >10° wedge (M). Extra flats were also used for greater attenuation (not shown). Wedged flats were used to ensure good separation of the front and rear surface reflections. Other wavelengths were rejected using a 3ω interference filter (transmission full width at half maximum ~10 nm peaked at 350 nm) placed in front of the CCD detector.

THIRD ORDER HARMONIC DIAGNOSTIC
Typically, in high intensity interactions for conditions of both low and high incident laser pulse contrast, the generation of optical/X-ray-ultraviolet harmonics can be realized via two competing processes—the formation of a relativistically oscillating mirror-like (ROM) critical density surface (Dromey et al., Reference Dromey, Zepf, Gopal, Lancaster, Wei, Krushelnick, Tatarakis, Vakakis, Moustaizis, Kodama, Tampo, Stoeckl, Clarke, Habara, Neely, Karsch and Norreys2006, Reference Dromey, Kar, Bellei, Carroll, Clarke, Green, Kneip, Markey, Nagel, Simpson, Willingale, McKenna, Neely, Najmudin, Krushelnick, Norreys and Zepf2007) and coherent wake emission (CWE) (Quere et al., 2006; Gupta et al., Reference Gupta, Sharma and Mahmoud2007)
The process driving CWE, namely mode conversion of plasma density oscillations induced by vacuum heating from Brunel electrons (Brunel, Reference Brunel1987), and can be observed at intensities as low as ~1016 Wcm−2. Harmonic orders from the ROM mechanism are generated due to the relativistic Doppler up-shifting of light reflected from a mirror (in this case, a critical density plasma surface) moving with almost the velocity of light, and are only generated for intensities >1018 Wcm−2 (Quere et al., Reference Quéré, Thaury, Monot, Dobosz, Martin, Geindre and Audebert2006).
Typically, harmonic conversion processes experience a strong intensity dependence, which in this case could have a deleterious effect on the desired focal spot diagnosis, e.g., for a Gaussian profile, an hypothetical intensity dependence of ~In would exhibit a ~n 1/2 source size shrinkage, where n is the nonlinearity of the process. However, CWE has been shown to be almost linear with driving intensity (Quere et al., Reference Quéré, Thaury, Monot, Dobosz, Martin, Geindre and Audebert2006, Reference Quéré, Thaury, Geindre, Bonnaud, Monot and Martin2008), and in the range 1016–1019 Wcm−2 it is the dominant mechanism for 3ωlaser generation. In the range where ROM is dominant (>1019 Wcm−2), the generation process is already saturating for low order generation and as a result is also approximately linear with driving intensity (Licthers & Meyer-ter-Vehn, Reference Lichters and Meyer-ter-Vehn1997; Tsakiris et al., Reference Tsakiris, Eidmann, Meyer-ter-Vehn and Krausz2006).
It should be noted that the relative efficiency of generation for ROM and CWE depends strongly on laser pulse contrast and intensity. However, in the intensity regime where ROM efficiency is comparable to that of CWE, the generation is, as stated above, approximately linear in intensity for both mechanisms. In this context, and for the purposes of this application only, CWE and ROM are indistinguishable. Consequently, it is clear that for intensities above 1016 Wcm−2, the third order harmonic emission region will correspond approximately to the spatial extent of the laser focus, be it due to either the CWE or ROM generation mechanisms.
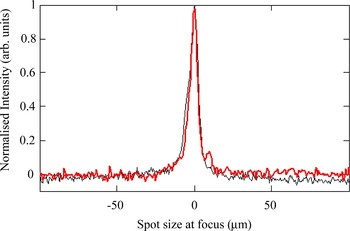
The near linear intensity dependence of the 3ωlaser source size for the intensity interval ~1019 Wcm−2 to ~1021 Wcm−2 is verified experimentally in Figures 2 and 3, demonstrating that this technique is indeed a very effective diagnostic for focal spot analysis. The spot size observed via 3ωlaser imaging is measured to be 6 ± 1 µm full width half maximum on target (red trace in Fig. 2), which is in good agreement with that obtained from conventional techniques for focal spot diagnosis prior to the experiment (black trace in Fig. 2). Therefore, assuming a near Gaussian intensity distribution in the focal spot with an intensity dependence of In, where n = 1…1.5 (as determined from experimental observation for 3ωlaser emission, Fig. 2) is within our experimental uncertainty. This indicates that there is negligible source size shrinkage.
(Color online) A comparison of the 3ωlaser emission observed in tight focus obtained during a 1021 Wcm−2 interaction (red trace) compared to the optimal ωlaser focus (black trace) obtained using a microscope objective and CW alignment beam. The estimated full width at half maximum is 6 ± 1 µm, demonstrating the near linear intensity dependence of the 3ωlaser emission process at these intensities.

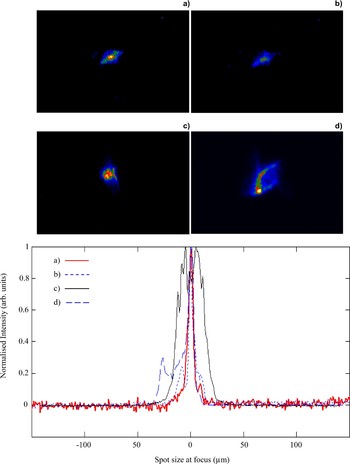
(Color online) Focal spot images and corresponding line outs recorded for the following conditions: (a) Best focus with no plasma mirror, 6 ± 1 µm full width half maximum, on target intensity ~1021 Wcm−2 (red solid line); (b) Best focus after double plasma mirror, 6 ± 1 µm full width half maximum, on target intensity ~2.5 × 10²⁰ Wcm−2 (blue dotted line); (c) Approximately 100 µm out of focus, 32 ± 3 µm full width half maximum on-target intensity ~5 × 10¹⁹ Wcm−2 (black solid line); (d) Astigmatic focus due to primary laser focus optic misalignment, on-target intensity ~1019 Wcm−2 (blue dashed). The color scales in (a)–(d) are arbitrary. The spatial scale shown in the line outs is for the laser spot at the target plane.

Examples of experimentally obtained images are shown in Figure 3. A fully optimized spot in tight focus from the final f/3 parabola is shown in Figure 3a. When coupled with calorimetric measurements, this gives a resulting intensity of ~1021 Wcm−2. Figure 3b shows that this same focal spot size can indeed be achieved after reflection from a double plasma mirror setup (Dromey et al., Reference Dromey, Zepf, Gopal, Lancaster, Wei, Krushelnick, Tatarakis, Vakakis, Moustaizis, Kodama, Tampo, Stoeckl, Clarke, Habara, Neely, Karsch and Norreys2006, Reference Dromey, Kar, Bellei, Carroll, Clarke, Green, Kneip, Markey, Nagel, Simpson, Willingale, McKenna, Neely, Najmudin, Krushelnick, Norreys and Zepf2007; Levy et al., Reference Lévy, Ceccotti, D'Oliveira, Réau, Perdrix, Quéré, Monot, Bougeard, Lagadec and Martin2007) and, from calorimetric measurements, the on-target intensity is estimated to be ~2.5 × 10²⁰ Wcm−2. This observation is of extreme importance for high contrast interactions at extreme intensities. A key observation of Dromey et al. (Reference Dromey, Kar, Zepf and Foster2004) was that the focusability of the radiation reflected from a plasma mirror was reduced/destroyed at approximately an order of magnitude in intensity lower than that for the observed drop in reflectivity (i.e., focusability rollover at 1016 Wcm−2 instead of at the reflectivity rollover observed at 1017 Wcm−2). This result can be interpreted as the onset of modulations across the plasma surface that are not sufficient to induce wide angle scattering of the reflected beam, and hence reduced reflectivity, but are sufficient to induce wavefront distortions of the beam that inhibit focusability. The observation here that a good focal spot is maintained after reflection from two plasma mirrors indicates that both mirrors are operating in a regime where reflectivity is acceptable while maintaining high beam quality.
Also shown in Figure 3 is the effectiveness of imaging the focus in 3ωlaser for the characterization of defocused conditions (~1019 Wcm−2,Fig. 3c) and also for the detection of primary laser focusing optic misalignment leading to an astigmatic focus (Fig. 3d).
As shown in Figure 1, the results presented in Figures 2 and 3 were for specular observations only. An interesting aside was observed when the target was rotated through 45° such that the interaction was at normal incidence and the detector was positioned outside the specular cone for 3ωlaser. Under high and low contrast conditions, no harmonic emission was observed for plastic (CH) targets with nanometer roughness on a sub laser wavelength scale. However, for aluminum (Al) foil targets, with micron roughness 3ωlaser radiation was observed off-specular. This is a clear indication that target roughness approaching the laser wavelength scale is sufficient to scatter generated harmonic light into wide angles. This is in agreement with recent experimental results demonstrating diffraction limited high harmonic generation from very smooth targets (≪laser wavelength, λlaser), but with beaming destroyed for targets with roughness approaching the driving laser wavelength (Dromey et al., Reference Dromey, Adams, Hörlein, Nomura, Rykovanov, Carroll, Foster, Kar, Markey, McKenna, Neely, Geissler, Tsakiris and Zepf2008).
While surface shape/roughness on a sub laser wavelength scale may indeed play a significant role in the amount of radiation reflected into the diffraction limited cone (leading to an increasing halo of scattered radiation with increasing roughness), surface shape on the scale of the focal spot size will have a very significant effect on the divergence of the emitted beam (Dromey et al., Reference Dromey, Adams, Hörlein, Nomura, Rykovanov, Carroll, Foster, Kar, Markey, McKenna, Neely, Geissler, Tsakiris and Zepf2008). Essentially any departure from a flat generating surface will correspond to emission with curved wave fronts leading to a global modification of the divergence of the emitted harmonic radiation. Such a curved surface can readily be formed by surface denting due to the ponderomotive force of the driving laser acting on the generating surface (Wilks et al., Reference Wilks, Kruer, Tabak and Langdon1992). The dent depth for the most intense interactions studied here is, from one-dimensional and two-dimensional particle in cell code simulations (Rykovanov et al., Reference Rykovanov, Geissler, Meyer-ter-Vehn and Tsakiris2008) and corroborated by experiment (Dromey et al., Reference Dromey, Kar, Bellei, Carroll, Clarke, Green, Kneip, Markey, Nagel, Simpson, Willingale, McKenna, Neely, Najmudin, Krushelnick, Norreys and Zepf2007, Reference Dromey, Adams, Hörlein, Nomura, Rykovanov, Carroll, Foster, Kar, Markey, McKenna, Neely, Geissler, Tsakiris and Zepf2008), on the order of 320 ± 20 nm. Such a dent depth has a significant effect on the divergence of all harmonics emitted from the surface and has been shown to permit a strong focusing effect for the emitted ROM harmonics (Dromey et al., Reference Dromey, Adams, Hörlein, Nomura, Rykovanov, Carroll, Foster, Kar, Markey, McKenna, Neely, Geissler, Tsakiris and Zepf2008).
Another effect which can strongly influence the divergence of the emitted harmonic radiation is the intrinsic intensity dependent phase for CWE (Quere et al., Reference Quéré, Thaury, Monot, Dobosz, Martin, Geindre and Audebert2006) and ROM (An der Brugge et al., Reference An der Brugge and Pukhov2007) due primarily to the intensity distribution of the driving laser and transverse plasma density profile at the focal plane.
While the above mentioned effects are very important to include from a harmonic source perspective, they do not play a role in the measurements presented here, since the method described is a simple imaging system for which such effects play no role at the image plane (i.e., at the CCD detector). Accordingly, wavefront curvature of the radiation will not alter the results of the observation, and coupled with the observation of linear intensity dependence of the generation mechanisms (Fig. 2), the accuracy of this diagnostic should not suffer from intensity dependent effects over a very wide range of intensities (1016 Wcm−2 to >1021 Wcm−2).
SECOND ORDER HARMONIC DIAGNOSTIC
Another interesting aspect of this technique is the possibility of the use of the second harmonic of the fundamental wavelength to estimate the spatial extent of the intensity distribution of the focal spot. The second harmonic, 2ωlaser, is more desirable for lasers with 800 nm driving radiation, where 3ωlaser ≈ 266 nm, which is well below the transmission cut-off for standard BK7 glass (10 mm thick window, <20% transmission for wavelengths <330 nm) used in vacuum chamber windows/ports. This problem can readily be overcome by the use of fused silica (or Quartz), which has <20% transmission (10 mm thick window) closer to 250 nm. However such optics/windows may not be readily available and, depending on experimental geometries and vacuum chamber port size, may represent a significant cost for modification to existing setups. In this case 2ωlaser (400 nm), will allow the use of existing BK7 optics.
The mechanism for the efficient generation of second harmonic radiation from laser solid interactions is strongly dependent on the scale length of the plasma formed. 2ωlaser can be readily generated through several routes (beyond the scope of this discussion) in the underdense region of long plasma scale length interactions, creating diffuse emission into large angles that is not necessarily dependent on the laser focal spot intensity distribution. Therefore, the application of 2ωlaser as a focal spot diagnostic is limited to short scale length plasmas (≤0.2.λlaser). Recent work performed using 800 nm laser radiation (Hörlein et al., Reference Hörlein, Dromey, Adams, Nomura, Kar, Markey, Foster, Neely, Krausz, Tsakiris and Zepf2008) has demonstrated clearly that under conditions of CR ~1010, 2ωlaser is beamed into a diffraction limited cone angle while for CR on the order of 107 beaming is destroyed. This indicates that as the plasma scale length (due to pre-plasma formed by the pre-pulse of the laser) is increased due to the reduced CR, the efficient production of second harmonic radiation via CWE/ROM mechanisms is destroyed and is replaced by diffuse 2ωlaser emission from the extended pre-plasma, which dominates the interaction. In this sense, the use of 2ωlaser for similar applications to those described in the section on third order harmonic diagnostic is limited to high incident laser pulse contrast/short scale length interactions.
CONCLUSIONS
In conclusion, imaging the focus of high power laser interactions in 3ωlaser is shown to be an effective diagnostic tool for monitoring the interaction intensity. Near linear intensity dependence of the generation mechanism for 3ωlaser is demonstrated for >1019 Wcm−2 and is shown to provide the basis for this technique. The maintenance of high beam quality/focusability post reflection from a double plasma mirror for laser contrast enhancement is also verified for the first time at intensities >1020 Wcm−2.