

Part-time (PT) employment rates tend to fluctuate with changes in economic conditions (Valletta, Bengali, & van der List, Reference Valletta, Bengali and van der List2020). When economic conditions are stable, around 75% of PT employees choose to work reduced hours (Cassidy & Parsons, Reference Cassidy and Parsons2017; Valletta, Bengali, & van der List, Reference Valletta, Bengali and van der List2020). However, during economic downturns, such as the 2007–2009 recession and the COVID-19 pandemic, the incidence of PT workers often increases to reduce labor costs (Valletta, Bengali, & van der List, Reference Valletta, Bengali and van der List2020) and increase organizational flexibility (Campbell & Chalmers, Reference Campbell and Chalmers2008; Martínez-Sánchez, Pérez, Pilar de Luis, & Jiménez, Reference Martínez-Sánchez, Pérez, Pilar de Luis and Jiménez2007), while retaining skilled employees (Gascoigne & Kelliher, Reference Gascoigne and Kelliher2018). Some employees may then be working PT when they would prefer to be working full-time (FT), a work arrangement often referred to as involuntary part-time (IPT) (Feldman, Reference Feldman1990; Wang, Reference Wang2018). A proportionate increase in PT employees, irrespective of the reason, can negatively impact corporate performance (Whyman, Baimbridge, Buraimo, & Petrescu, Reference Whyman, Baimbridge, Buraimo and Petrescu2015; Zeytinoglu, Chowhan, Cooke, & Mann, Reference Zeytinoglu, Chowhan, Cooke and Mann2017) and organizational turnover (Stavrou & Kilaniotis, Reference Stavrou and Kilaniotis2010), suggesting this is an issue worth examining.
A PT employee is ‘an employed person whose normal hours of work are less than those of comparable FT workers’ (International Labour Organization, 1994, paragraph 1). Although the Organization for Economic Co-operation and Development (OECD) classifies any person working less than 30 h a week as a PT employee, the Australian Bureau of Statistics (ABS) uses 35 h a week as the threshold (Australian Bureau of Statistics, 2013), as does the United States (US Bureau of Labor Statistics, 2020). In 2018, Australia's PT workforce was the fourth highest of the OECD countries (26%), compared to the Netherlands that has the highest (37%), and an OECD average of 17% (OECD, 2019). In 2020, 53% of Australian organizations reduced the hours of their FT employees because of COVID-19 (Australian Bureau of Statistics, 2020a), potentially further increasing the country's PT workforce and highlighting the need to better understand the experiences of these workers.
The incidence of PT work tends to vary across industries, with the service sector employing a large number of PT workers, often because of seasonal variations in demand (Anxo, Hussain, & Shukur, Reference Anxo, Hussain and Shukur2012). In 2019, the growth in PT employment in Australia was most marked in the retail, accommodation, food services, health care, and social assistance sectors (Workplace Gender Equality Agency, 2020). Across all industries in Australia, 75% of PT employees and 56% of casual PT employees are women (Workplace Gender Equality Agency, 2020). Younger (15–24) and older (65+) employees are also highly represented in PT and casual employment in Australia (Wilkins, Laß, Butterworth, & Vera-Toscana, Reference Wilkins, Laß, Butterworth and Vera-Toscana2019).
Although an increase in PT employment arrangements may help reduce overall unemployment, it can also increase IPT work rates. Indeed, the proportion of IPT workers in Australia's labor force has been slowly increasing (from 8.5% in 2008 to 11% in 2018) (OECD, 2019). During the COVID-19 pandemic, this rate rose to 14% in March 2020 (Australian Bureau of Statistics, 2020b). The USA, Canada, and the UK exhibit a similar pattern of increasing IPT workers (OECD, 2019). IPT employment has been associated with a gradual decline in workers' mental health (Milner & LaMontagne, Reference Milner and LaMontagne2017) and wellbeing (Kauhanen & Nätti, Reference Kauhanen and Nätti2015), and a higher turnover rate in organizations (Wang, Reference Wang2018). Kler, Potia, and Shankar (Reference Kler, Potia and Shankar2018) found that males, immigrants, youth, blue-collared, and casual workers were disproportionately represented among IPT employees in Australian workplaces. Hence, understanding IPT workers should be of concern to employers and governments.
Characteristics of the Australian Labor market therefore, including the high proportion of employees working PT, increasing IPT employment rates, which disproportionately affect some workers, and the higher hourly threshold used to determine PT status, underscore the importance of understanding to what extent these employees may be exploited or disadvantaged (Conway & Sturges, Reference Conway and Sturges2014; McDonald, Bradley, & Brown, Reference McDonald, Bradley and Brown2009). The design of a PT role can result in low quality work and a lack of career progression and opportunities (McDonald, Bradley, & Brown, Reference McDonald, Bradley and Brown2009). PT employees may also have little autonomy (Kauhanen & Nätti, Reference Kauhanen and Nätti2015) and potentially perform less complex, meaningful, and interdependent work (Chadwick & Flinchbaugh, Reference Chadwick and Flinchbaugh2016; McDonald, Bradley, & Brown, Reference McDonald, Bradley and Brown2009; Smith & McDonald, Reference Smith and McDonald2016). Furthermore, PT employment is often associated with work intensification or greater amounts of unpaid overtime, particularly when FT role descriptions are not adjusted to reflect the reduced hours (Conway & Sturges, Reference Conway and Sturges2014; McDonald, Bradley, & Brown, Reference McDonald, Bradley and Brown2009). The aims of the current study, therefore, were to examine how and why PT employees' experiences differ from FT employees, including differentiating IPT as a subset of PT employment, with a view toward developing more targeted management strategies to improve inclusion and work engagement (Armstrong-Stassen, Al-Ma, Cameron, & Horsburgh, Reference Armstrong-Stassen, Al-Ma, Cameron and Horsburgh1998; Barker, Reference Barker1993; Thorsteinson, Reference Thorsteinson2003; Wang, Reference Wang2018).
Theoretical framework and hypotheses development
One call for more empirical research has been in the application of work design theory to PT employees' experiences (Oldham & Fried, Reference Oldham and Fried2016; Smith & McDonald, Reference Smith and McDonald2016). A broad approach appears necessary for work design, which is ‘the content and organisation of one's work tasks, activities, relationships, and responsibilities’ (Parker, Reference Parker2014, p. 662), to be relevant to PT work. For instance, although top-down work design characteristics can affect PT work quality, employees may also be able to change their work tasks to better fit their abilities and preferences by proactively initiating change (Parker, Wall, & Cordery, Reference Parker, Wall and Cordery2001) and/or crafting the task, cognitive, and relational boundaries of their job (Wrzesniewski & Dutton, Reference Wrzesniewski and Dutton2001).
An additional challenge of PT work relates to possible differences between the attitudes and behavior of PT and FT employees. Several theories have been suggested as to why such differences might exist, including partial inclusion theory (PIT) (Katz & Kahn, Reference Katz and Kahn1966), frame of reference (Feldman, Reference Feldman1990, Thorsteinson, Reference Thorsteinson2003), and person–job fit (Thorsteinson, Reference Thorsteinson2003). PIT has attracted greater research attention because it suggests that relative to FT employees, PT employees feel only partially included in work activities and social systems, because their focus is divided between their non-work and work roles (Clinebell & Clinebell, Reference Clinebell and Clinebell2007; Katz & Kahn, Reference Katz and Kahn1966; Thorsteinson, Reference Thorsteinson2003; Wittmer & Martin, Reference Wittmer and Martin2011). A second explanation, which relates to the frame of reference PT employees use to evaluate their experiences may be particularly relevant to IPT workers, who may compare their current situation with previous FT work (Feldman, Reference Feldman1990; Thorsteinson, Reference Thorsteinson2003). Similarly, person–job fit, or whether an employee's work status is congruent with their preferred status, is another reason why differences in attitudes and behaviors may occur (Armstrong-Stassen et al., Reference Armstrong-Stassen, Al-Ma, Cameron and Horsburgh1998). Thorsteinson (Reference Thorsteinson2003) concluded from a meta-analytic review of the relevant literature that additional primary studies were needed to test explanations of why work status differences potentially exist.
An elaborated PT work design (PTWD) model, which is provided in Figure 1, was developed from prior research to identify the characteristics that differentiate the challenges of PT work from FT employment. The model reflects the work design characteristics theorized to influence PT employees' perceived inclusion and work engagement. In keeping with PIT, Mor-Barak and Cherin (Reference Mor-Barak and Cherin1998, p. 48) defined perceived inclusion as ‘a continuum of the degree to which individuals feel a part of critical organizational processes such as access to information and resources, involvement in work groups, and ability to influence the decision making process.’ Little is currently known about how different employee groups feel about their inclusion in organizational processes (Tang, Jiang, Chen, Zhou, Chen, & Yu, Reference Tang, Jiang, Chen, Zhou, Chen and Yu2015). Work engagement, which is defined as ‘a positive, fulfilling work-related state of mind that is characterized by vigor, dedication, and absorption’ (Schaufeli, Bakker, & Salanova, Reference Schaufeli, Bakker and Salanova2006, p. 702), is also worth examining because it is theoretically consistent with the tenets of PIT (Webster, Edwards, & Smith, Reference Webster, Edwards and Smith2019). If PT employees feel less involved in an organization because of their reduced hours, they may also experience reduced engagement, absorption, and energy at work. The hypothesized work design relationships of greatest relevance to PT work are discussed initially; before the final hypothesis examining how the various work status groups (i.e., PT, IPT, and FT) are related to perceived inclusion and work engagement, is then considered.
PTWD model of job crafting, inclusion, and work engagement.

Work design characteristics
Proactivity has been identified as a potentially important factor when establishing successful PT arrangements (Lirio, Lee, Williams, Haugen, & Kossek, Reference Lirio, Lee, Williams, Haugen and Kossek2008). A proactive personality is an innate disposition to behave in a way that effects change (Bateman & Crant, Reference Bateman and Crant1993). Employees may be able to mitigate some PT challenges by proactively identifying, and then addressing them. For example, setting up communication strategies for non-workdays or offering to take telephone calls at home about a critical issue has been shown to enhance FT employees' perceptions of their PT colleagues (Kossek & Lobel, Reference Kossek and Lobel2007). Proactive personality has also been linked to FT employees' job-crafting behaviors and improved work engagement (Bakker, Tims, & Derks, Reference Bakker, Tims and Derks2012), but these relationships have not been examined with PT employees. Engaging in proactive behaviors could also help PT employees feel more included in the workplace, by virtue of them being more centrally placed in critical organizational processes. Thus, it is suggested:
Hypothesis 1: Proactive personality is positively related to PT employees' job crafting (a) and perceived inclusion (b).
Autonomy has been linked to the design and implementation of better-quality PT jobs (Kauhanen & Nätti, Reference Kauhanen and Nätti2015; Marchese & Ryan, Reference Marchese and Ryan2001; Smith & McDonald, Reference Smith and McDonald2016). The opportunity for FT employees to engage in job-crafting behaviors is facilitated by autonomy (Dierdorff & Jensen, Reference Dierdorff and Jensen2018; Slemp, Kern, & Vella-Brodrick, Reference Slemp, Kern and Vella-Brodrick2015) and the level of supervisory support (Berdicchia & Masino, Reference Berdicchia and Masino2019; Blomme, Kodden, & Beasley-Suffolk, Reference Blomme, Kodden and Beasley-Suffolk2015). The current study, therefore, was designed to examine whether autonomy has a similarly positive effect on PT employees' job crafting. Increased autonomy is also thought to enhance employees' emotional investment in an organization, which may positively influence the degree to which they feel included in work processes (Chadwick & Flinchbaugh, Reference Chadwick and Flinchbaugh2016; Marchese & Ryan, Reference Marchese and Ryan2001), suggesting:
Hypothesis 2: Autonomy is positively related to PT employees' job crafting (a) and perceived inclusion (b).
Task interdependence or, ‘the connectedness between jobs such that the performance of one depends on the successful performance of the other’ (Kiggundu, Reference Kiggundu1983, p. 146), is another job characteristic potentially relevant to PT work. A lack of task interdependence contributes to poor quality PT jobs, as such roles are often less interesting and complex than equivalent FT roles (Broschak & Davis-Blake, Reference Broschak and Davis-Blake2006; Chadwick & Flinchbaugh, Reference Chadwick and Flinchbaugh2016). However, interdependence can also present challenges when work needs to be managed around PT work schedules that can result in delays, and lead to frustration and resentment from co-workers. High task interdependence might also inhibit the ability to engage in job crafting (Wrzesniewski & Dutton, Reference Wrzesniewski and Dutton2001). A study of childcare workers found task interdependence had no relationship to job crafting (Leana, Appelbaum, & Shevchuk, Reference Leana, Appelbaum and Shevchuk2009), and so no relationship is hypothesized here between task interdependence and job crafting. However, task interdependence might be expected to increase perceived inclusion when PT employees are required to directly participate in organizational processes, suggesting:
Hypothesis 3: Task interdependence is positively related to PT employees' perceived inclusion.
Treating PT employees as a homogeneous group by dichotomizing work into more or less than a set number of hours per week potentially overlooks whether a minimum number of hours is required to promote feelings of inclusion in work activities and organizational systems, as suggested by PIT (Feldman, Reference Feldman1990). Thorsteinson (Reference Thorsteinson2003) also suggested that dichotomizing workers into PT or FT, without considering hours worked, might obscure important differences within each group. More hours at work, including work intensification where PT employees work extended PT hours sometimes without additional payment (Kelliher & Anderson, Reference Kelliher and Anderson2010), could also provide employees with more opportunities to job craft. Hence, hours worked was included in the PTWD model because more hours may increase job-crafting behaviors and feelings of inclusion, suggesting:
Hypothesis 4: Hours worked is positively related to PT employees' job crafting (a) and perceived inclusion (b).
Central to the PTWD model is the notion that job crafting can be a useful tool to mitigate some of the challenges associated with PT work. Job-crafting research has been categorized into two streams (Lazazzara, Tims, & de Gennaro, Reference Lazazzara, Tims and de Gennaro2020). The first reflects Wrzesniewski and Dutton's (Reference Wrzesniewski and Dutton2001, p. 179) suggestion that job crafting involves ‘shaping the task boundaries of the job (either physically or cognitively), the relational boundaries of the job, or both.’ The second suggests job crafting impacts outcomes through changes in job demands and job resources (Bakker & Demerouti, Reference Bakker and Demerouti2008). This study is situated in the first stream for two reasons. First, changing the scope or types of tasks performed, reminding yourself of the importance of your work, and trying to get to know your work colleagues better (Slemp & Vella-Brodrick, Reference Slemp and Vella-Brodrick2013), could help overcome some of the challenges linked to PT work. Second, it has been suggested that more attention should be paid to exploring crafting activities outside the job demands-resources framework, because this might produce more positive and consistent results (Oldham & Fried, Reference Oldham and Fried2016). If PT employees perceive their tasks, social interactions, and work to be meaningful, they may also feel more included and engaged, suggesting:
Hypothesis 5: PT employees' job crafting is positively related to perceived inclusion (a) and work engagement (b).
Workplace inclusion refers to the promotion of situations in which all employees feel accepted, valued, and encouraged to contribute (Brimhall, Mor-Barak, Hurlburt, McArdle, Palinkas, & Henwood, Reference Brimhall, Mor-Barak, Hurlburt, McArdle, Palinkas and Henwood2016). PIT discusses the concept of inclusion with respect to total hours at work, but inclusion is also associated more broadly with workplace diversity and avoiding discrimination of minority groups (Lirio et al., Reference Lirio, Lee, Williams, Haugen and Kossek2008; Shore, Randel, Chung, Dean, Ehrhart, & Singh, Reference Shore, Randel, Chung, Dean, Ehrhart and Singh2011). Lirio et al. (Reference Lirio, Lee, Williams, Haugen and Kossek2008) noted a shift has occurred in the focus of diversity research toward more inclusive behaviors, while also highlighting its potential relevance to PT employees' experiences. Employees who feel more included are more likely to be committed to the organization (Chen & Tang, Reference Chen and Tang2018). Indeed, Downey, van der Werff, Thomas, and Plaut (Reference Downey, van der Werff, Thomas and Plaut2015) suggested that because inclusion can positively impact trust and engagement, its effects should be studied among employees of differing status. Prior research suggests:
Hypothesis 6: PT employees' perceived inclusion is positively related to work engagement.
Mediating hypothesis
Previous research has found that proactivity and autonomy improve the work engagement of FT employees by enhancing their available personal and job resources, respectively (Bakker & Demerouti, Reference Bakker and Demerouti2007, Reference Bakker and Demerouti2008; Bakker, Tims, & Derks, Reference Bakker, Tims and Derks2012). Bakker, Albrecht, and Leiter (Reference Bakker, Albrecht and Leiter2011) suggested that when employees are given the autonomy to manage their own work, they remain more engaged because of increased resources to do their job. Similarly, Bakker and Bal (Reference Bakker and Bal2010) found worker autonomy to be positively related to work engagement. The work engagement of PT employees might also be improved for the same reason when the additional resources of proactivity and autonomy are present. Self-determination theory (Deci & Ryan, Reference Deci and Ryan1985) has also been suggested as an explanation for why autonomy and task interdependence enhance work engagement, through the fulfillment of autonomy and relatedness needs (Lee, Shin, & Baek, Reference Lee, Shin and Baek2017). Thus, prior research, together with the previously hypothesized relationships, suggests:
Hypothesis 7: Job crafting mediates the relationships between proactive personality and autonomy, and work engagement (a), and perceived inclusion mediates the relationships between proactive personality, autonomy and task interdependence, and work engagement (b).
Work status differences
Based on PIT, Miller and Terborg (Reference Miller and Terborg1979) theorized PT employees feel only partially included in an organization's social system due to their reduced hours at work and increased non-work commitments. A moderate difference in PT employees' reported job involvement (i.e., identification with their work) compared to FT employees has been previously found, providing some support for PIT (Martin & Hafer, Reference Martin and Hafer1995; Thorsteinson, Reference Thorsteinson2003). Barker (Reference Barker1993) also reported that women working PT hours felt excluded from organizational activities, interpersonal relationships, and skill development opportunities at work. According to PIT, therefore, employees who work reduced hours, regardless of whether it is voluntary or not, may feel less included at work than FT employees. Thorsteinson (Reference Thorsteinson2003) found little difference between PT and FT employees' job satisfaction, organizational commitment, intentions to leave, and facets of job satisfaction, concluding that PT workers potentially use other PT workers as their frame of reference. Thorsteinson also found, however, that PT employees were slightly more satisfied at work than IPT employees, providing some support for person–job fit and suggesting:
Hypothesis 8: PT and IPT employees' perceived inclusion is significantly lower than FT employees (a), and IPT employees' work engagement is significantly lower than PT and FT employees (b).
Method
Procedure and participants
A commercial, general population online panel provider collected the data from PT and FT employees in Australia, with industry representation sought from relevant Australian and New Zealand Standard Industrial Classification Service Industry Categories. The distribution of participants across service industries was comparable to the general Australian population (Vandenbroek, Reference Vandenbroek2018). Drawing from a cross-section of service sectors can help provide more generalizable results (Kees, Berry, Burton, & Sheehan, Reference Kees, Berry, Burton and Sheehan2017). Participation required a minimum of 6 months job tenure in recognition of the importance of time spent in a role before being able to job craft (Bakker, Tims, & Derks, Reference Bakker, Tims and Derks2012). All participants were asked if their PT work status was voluntary (want to work PT), involuntary (prefer to work FT), or not applicable (work FT); as well as how many hours, on average, they worked each week (excluding overtime).
An online questionnaire was completed by 308 participants, comprised of 130 PT (42%), 30 IPT (10%), and 148 FT (48%) employees. Participants were categorized as PT if they worked less than 35 h a week. The main reasons for voluntarily working PT were work–life balance (27%), caring for children or others (27%), and transitioning to retirement (23%). The average voluntary PT hours were 19.93 (sd = 8.36) and IPT hours were 18.70 (sd = 8.37), compared to the Australian average of 17 h a week (Cassidy & Parsons, Reference Cassidy and Parsons2017). FT employees worked an average of 39.24 h a week (sd = 4.42). Three-quarters (75%) of the PT, 63% of the IPT, and 30% of the FT participants identified as female, whereas 39% of PT, 43% of IPT, and 59% of FT employees had completed a bachelors degree or higher. The PT, IPT, and FT employees' average age was 50 (sd = 14.76), 45 (sd = 11.89), and 38 (sd = 13.57) years, respectively, and average job tenure was 9 (sd = 9.10), 7 (sd = 6.08), and 7 (sd = 7.47) years, respectively, suggesting all participants were familiar with their job and employing organization.
The measures
The online questionnaire included items designed to measure the constructs in the PTWD model. Existing scales were adapted to measure these constructs to ensure questions were consistent and reflected previous research, which also suggested a 7-point scale, which ranged from 1 (strongly disagree) to 7 (strongly agree), was appropriate (Krosnick & Presser, Reference Krosnick and Presser2009).
Work design characteristics
The 6-item short form of the Proactive Personality Scale was used to measure proactive behaviors (α = .85) (Bateman & Crant, Reference Bateman and Crant1993; Parker, Reference Parker1998). An example item is, ‘If I see something I don't like, I fix it.’ Autonomy was measured using nine items from the Job Design Questionnaire (JDQ) (α = .85) (Morgeson & Humphrey, Reference Morgeson and Humphrey2006). An example item is, ‘This job allows me to make my own decisions about how to schedule my work.’ Task interdependence was measured using six items from the JDQ (α = .80) (Morgeson & Humphrey, Reference Morgeson and Humphrey2006). An example item is, ‘This job requires me to accomplish my job before others complete their jobs.’ The 15-item Job Crafting Questionnaire (JCQ), which includes three sub-scales (task, cognitive, and relational crafting), was used to measure job crafting (α = .91) (Slemp & Vella-Brodrick, Reference Slemp and Vella-Brodrick2013). An example item is, ‘Introduce new approaches to improve your work.’
Outcome and control variables
The 14-item Inclusion–Exclusion scale was used to measure perceived inclusion (α = .84) (Mor-Barak & Cherin, Reference Mor-Barak and Cherin1998). An example item is, ‘I feel part of informal discussions in my work group.’ The 9-item Work Engagement scale was used to measure individual work engagement (α = .80) (Schaufeli, Bakker, & Salanova, Reference Schaufeli, Bakker and Salanova2006). An example item is, ‘At my work, I feel I am bursting with energy.’ Questions about gender, age, education, job tenure, work status, and average hours worked/week were also included.
Analysis and results
A staged approach was used to examine the data. Stages 1 and 2 employed partial least squares (PLS) structural equation modeling using WarpPLS (Kock, Reference Kock2020) to examine the measurement and structural models (Chin, Reference Chin, Esposito Vinzi, Chin, Henseler and Wang2010; Kock, Reference Kock2020; Sarstedt, Ringle, Smith, Reams, & Hair, Reference Sarstedt, Ringle, Smith, Reams and Hair2014). PLS was chosen over a covariance-based approach because it can accommodate non-normal data, small samples, single item variables, and multiple mediators (Hair, Sarstedt, & Ringle, Reference Hair, Sarstedt and Ringle2019; Kock, Reference Kock2020; Ringle, Sarstedt, Mitchell, & Gudergan, Reference Ringle, Sarstedt, Mitchell and Gudergan2020; Willaby, Costa, Burns, MacCann, & Roberts, Reference Willaby, Costa, Burns, MacCann and Roberts2015). In stage 3, a multivariate analysis of covariance (MANCOVA) was undertaken to test hypothesis 8 due to the small and unequal cell sizes, education covariate, and the three-way group comparison (Hair, Babin, Anderson, & Black, Reference Hair, Babin, Anderson and Black2018). Chin (Reference Chin and Marcoulides1998, p. 305) suggests researchers use a rule of thumb of 10 cases per predictor when using PLS, but also warns ‘the stability of the estimates can be affected contingent on the sample size.’ Based on Chin's recommendation, the 30 IPT cases were considered insufficient for multi-group comparisons using WarpPLS.
Stage 1: measurement model results
An examination of the constructs' measurement properties resulted in several indicators with loadings less than .70 being removed (Kock, Reference Kock2020; Sarstedt et al., Reference Sarstedt, Ringle, Smith, Reams and Hair2014). Hair, Ringle, and Sarstedt (Reference Hair, Ringle and Sarstedt2011) have suggested indicators with very low loadings (<.40) should always be eliminated from reflective scales; whereas those with loadings between .40 and .70 should be removed if doing so increases composite reliability without affecting content validity. Once these indicators were removed, the measurement model fit indices were within the recommended thresholds (Hair et al., Reference Hair, Babin, Anderson and Black2018). To confirm the item removal had not compromised content validity, Thomas, Soutar, and Ryan's (Reference Thomas, Soutar and Ryan2001) approach was followed. This method involves correlating the scale means before, and after, item removal. The correlations were all greater than the recommended .80. Furthermore, the job crafting and inclusion latent constructs were found to be unidimensional (Hair et al., Reference Hair, Babin, Anderson and Black2018). All reflective indicators for the relational crafting sub-scale of the JCQ had loadings well below the recommended minimum.
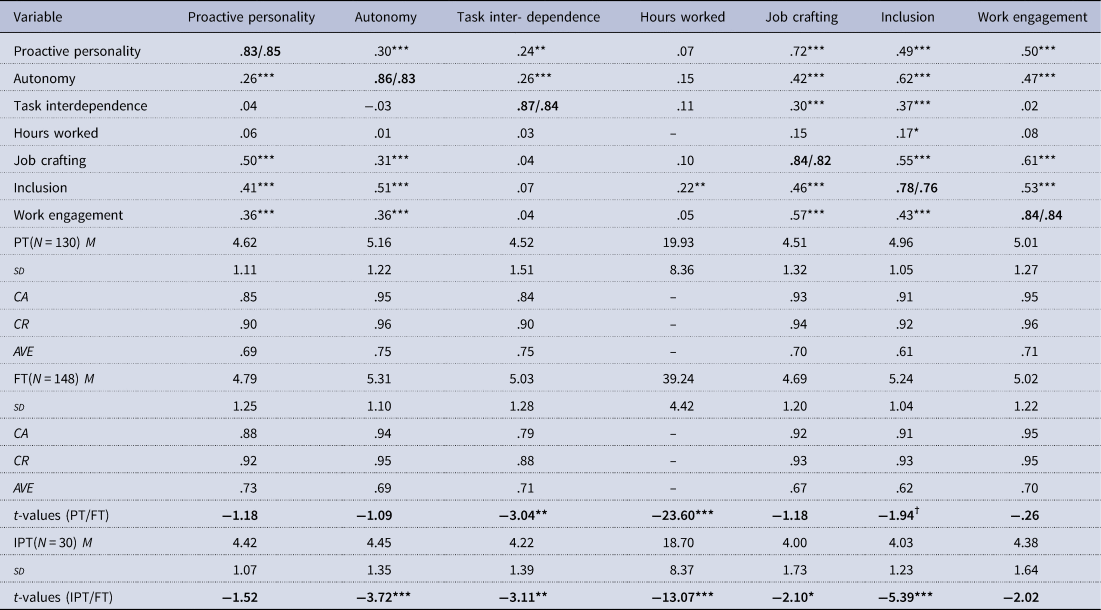
Table 1 shows the descriptive statistics, measurement properties, and bivariate correlations for all latent variables. Convergent and discriminant validity were examined by computing average variance extracted (AVE) scores (Fornell & Larcker, Reference Fornell and Larcker1981). The alpha and composite reliability coefficients were all higher than the recommended .70, and the AVE scores were all higher than .50, suggesting that the constructs were reliable and had convergent validity. Discriminant validity was also apparent, as the square root of the AVE for each variable was higher than all bivariate correlations. The constructs' heterotrait-monotrait (HTMT) ratios of correlations were all well below .85 (ranging from .12 to .63), further supporting discriminant validity (Henseler, Ringle, & Sarstedt, Reference Henseler, Ringle and Sarstedt2015).
Descriptive statistics, measurement properties, bivariate correlations, and t-tests among study variables

M, mean; sd, standard deviation; CA, Cronbach alpha; CR, composite reliability.
Notes. N = 308. Correlations for the FT employees appear above the diagonal and correlations for the total PT employees appear below the diagonal. Square roots of AVE are shown in bold on the diagonal for PT/FT.
†p < .10; *p < .05; **p < .01; ***p < .001.
Stage 2: structural model results
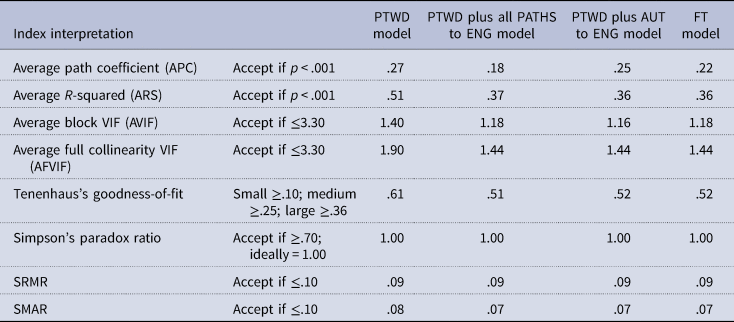
The relationships in the PTWD model were estimated first, before a comparison with the FT sample was undertaken (Kock, Reference Kock2020). A robust path analysis was used to estimate the inner model due to the presence of a single item variable (hours worked) and, because the relationships were all almost linear, a linear model was estimated (Kock, Reference Kock2020). The fit indices for the PTWD and FT models, as shown in the first two columns of Table 2, all met their recommended levels (Kock, Reference Kock2020; Kock & Lynn, Reference Kock and Lynn2012).
Fit indices comparison for FT, PTWD, and alternate PTWD models in WarpPLS

SRMR, standardized root mean squared residual; SMAR, standardized mean absolute residual; ENG, work engagement; AUT, autonomy.
Notes. N(PT) = 160; N(FT) = 148.
The PTWD model was also tested against two alternate models (i.e., the fully saturated model and a mediation model with a pathway from autonomy to work engagement) to see ‘whether more paths would provide more explanation’ (Willaby et al., Reference Willaby, Costa, Burns, MacCann and Roberts2015, p. 75). The fit indices for the two alternate models, which are shown in the last two columns of Table 2, were not improved, suggesting the more parsimonious hypothesized PTWD model was the most appropriate.
As common method variance can arise with single source, cross-sectional research designs (Podsakoff, Reference Podsakoff2003), the full-collinearity variance inflation factor (VIF) scores were used to examine this issue (Kock, Reference Kock2015). Here, the values were all <3.3, suggesting that common method bias is unlikely to be an issue. Furthermore, Simpson's paradox ratio was 1.0, suggesting that the correlations and paths have the same signs (Kock, Reference Kock2020) and the goodness-of-fit index, which measures a model's explanatory power had ‘large values’ (Kock, Reference Kock2020), suggesting that the estimated models were reasonable and that the beta path coefficients could be further examined.
Figure 2 shows the beta path coefficients from the PTWD and FT models, for which the standard errors in both the PTWD and FT models were between .07 and .08. All direct hypotheses for the PTWD model were supported, except for hypotheses 3 and 4a. Task interdependence was unrelated to perceived inclusion (hypothesis 3) and PT hours worked had no relationship to job crafting (hypothesis 4a). As hypothesized, hours worked was significantly related to PT employees' perceived inclusion (hypothesis 4b). These results are replicated when the PTWD model is run with all reflective indicators included, except for hypothesis 1b (proactive personality to perceived inclusion), which is significant only at the .10 level (β = .11, p = .07). The group comparison using the constrained latent growth approach found significant differences in the path coefficients for interdependence and inclusion for FT over PT employees, and for hours worked and inclusion for PT over FT employees, suggesting these differences warranted further examination. The R 2 values for the PTWD model were moderately strong (Hair et al., Reference Hair, Ringle and Sarstedt2011), with 41% of inclusion and 37% of work engagement explained, compared to the FT model, with 52 and 43% respectively.
Results of hypothesis testing for PTWD and FT models.
Notes. N(PT) = 160; N(FT) = 148. PTWD model standardized beta weights in bold; FT model standardized beta weights in brackets. *p < .05; **p < .01; ***p < .001.

Assessment of the structural model should not be restricted to direct effects because ‘a richer picture of the relationships in the structural model’ can be provided by also considering total effects (i.e., relationship of work design characteristics to work engagement through the mediators of job crafting and inclusion) (Sarstedt et al., Reference Sarstedt, Ringle, Smith, Reams and Hair2014, p. 110). PLS has an advantage over other regression-based approaches when assessing mediation because it considers the entire structural model in the estimation process and reduces measurement error (Hair et al., Reference Hair, Sarstedt and Ringle2019).
The variance accounted for (VAF) approach was used to test mediating hypothesis 7, for job crafting and perceived inclusion. The VAF scores suggest job crafting and inclusion fully mediated the proactive personality to work engagement relationship (VAF = 86%) in the PTWD model (Hair et al., Reference Hair, Babin, Anderson and Black2018). To determine whether these mediation effects were mainly due to job crafting or inclusion, Kock (Reference Kock2020) suggests isolating the effects of each pathway. This analysis, which was undertaken using a bootstrapping approach to determine statistical significance (Kock, Reference Kock2011; Willaby et al., Reference Willaby, Costa, Burns, MacCann and Roberts2015), suggested mediation was primarily associated with job crafting, providing some support for hypothesis 7a in relation to proactive personality.
To test the effect of the control variables on the PTWD model's relationships, direct links were added from the control variables to the two outcome variables and the model was re-estimated (Kock, Reference Kock2011). Age, gender, and tenure were not significantly related to the model's outcome variables. However, education was positively related to inclusion (r = .19, p < .001) and work engagement (r = .15, p < .01). When IPT status was added to the PTWD model, the path coefficient was significant (β = .19, p < .01) and the R 2 for perceived inclusion increased by 4%, whereas the other path coefficients remain unchanged. These results suggest further examination of the work status differences using MANCOVA was warranted.
To confirm the results of the hypothesis testing for the PTWD model, the same procedure, online questionnaire and WarpPLS analyses were conducted with an additional sample of 164 university students enrolled in a Business School who voluntarily worked at a PT job while enrolled in a program of study. Students have been identified in PT work typologies as a group worthy of separate study because they have a different pattern of involvement in school, family and work roles, than other PT employees (Haines, Doray-Demers, & Martin, Reference Haines, Doray-Demers and Martin2018; Martin & Sinclair, Reference Martin and Sinclair2007). The samples average weekly PT hours was 16 (sd = 7.12), average age was 19 years (sd = 3.25), and average job tenure was 2 years (sd = 1.43). Model fit indices were again within the recommended thresholds and the significances of the path coefficients were consistent with the mature PT employee sample, with the student PTWD model explaining 39% of the variation in inclusion and 51% of the variation in work engagement.
Stage 3: MANCOVA results
A MANCOVA model with education as a covariate was estimated to reduce the potential for type 1 errors, due to unequal and small numbers in the group cells. The IPT cell size of 30 exceeded the recommended minimum 20 observations, and Pillai's trace statistic was used, due to the unequal cell sizes and non-normal variables (Hair et al., Reference Hair, Babin, Anderson and Black2018). Two cases were excluded due to Mahalanobis' distances being greater than 13.82 (Field, Reference Field2013). Box's M test and the regression slopes were non-significant (Field, Reference Field2013). Levene's test was significant for engagement, suggesting variances were potentially unequal across the groups (F (2,303) = 4.72, p = .01). Pillai's trace was significant for work status (V = .10, F (4,606) = 7.72, p < .001, R 2 = .05) and the education covariate (V = .30, F (4,301) = 5.28, p < .01, R 2 = .04). Pairwise comparisons with a Bonferroni correction show a significant difference in estimated means for perceived inclusion, between IPT (M = 4.05, se = .19) and FT (M = 5.20, se = .09, p < .001), and IPT and PT (M = 4.99, se = .09, p < .001). The estimated mean difference in perceived inclusion for PT and FT, controlling for education, was not significant. For work engagement, IPT and PT (p = .04) were significantly different in the predicted direction. A follow-up univariate analysis of variance using Welch's test of equality of means due to unequal variances and sample sizes (Zimmerman, Reference Zimmerman2004), found work status did not affect work engagement significantly (p = .14). Thus, the MANCOVA results provide partial support for hypothesis 8a, but not for hypothesis 8b.
Discussion
The main aims of this study were to better understand how work design characteristics and work status influence PT and IPT employees' perceived inclusion and work engagement. The study contributes to existing knowledge in several ways. First, it drew on prior research to identify work design characteristics thought to differentiate working PT from FT. Interestingly, group comparison of the PTWD and FT models found similarities in most relationships, suggesting all employees, regardless of work status, may improve perceived inclusion and work engagement through work design initiatives, albeit to differing degrees. The results also suggest that task interdependence was associated with greater perceived inclusion for FT employees, but the lack of task interdependence in PT roles meant this was not the case for PT employees. This low task interdependence is consistent with a broader concern that PT work is often poorly designed. The IPT employees also reported significantly lower autonomy and job crafting than the other groups, despite the average work hours being comparable to the voluntary PT workers. Although the features of PT situations can vary widely, Haines, Doray-Demers, and Martin (Reference Haines, Doray-Demers and Martin2018) suggested ‘bad’ PT employment is characterized by less role flexibility and autonomy, lower educational and experience requirements, fewer work hours and supervisory responsibilities, and lower pay levels.
Second, proactivity and job crafting have been widely researched and suggested as effective strategies for FT employees. However, little attention has been paid to whether the same benefits accrue to PT employees. The PTWD model results suggest proactive behaviors and job crafting may, indeed, provide a tool through which PT employees can bridge or close the gap between the challenges and benefits of PT and IPT work. It also appears job crafting mediates the relationship between proactive personality and work engagement for PT employees, suggesting job crafting should be explored as a potential managerial strategy for improving PT employees' experiences.
Third, the findings increase our understanding of the role inclusion plays in PT employees' experiences. Previous PIT studies have associated reduced hours of work with a lack of inclusion, and this was supported by the PT employees in our sample. Beyond hours worked, the results suggest proactivity, autonomy, and job crafting, all characteristics that can be influenced through human resource management (HRM) initiatives, were positively associated with feeling more included. Furthermore, the multi-group analysis suggested task interdependence has a positive relationship with inclusion only for FT employees. PT employees might feel more included if greater task interdependence could be accommodated in their PT roles, such as through job sharing arrangements. This study contributes to the existing PT literature by showing work design characteristics influence PT employees' work engagement through slightly differing pathways, compared to FT employees.
Fourth, the analysis of the influence of work status found significant differences in perceived inclusion for IPT employees, compared to both PT and FT employees. Since there were no significant differences in hours worked, PIT cannot fully explain these differences. Although voluntary PT employees may use other PT employees as their frame of reference, IPT employees potentially use both PT and FT workers as referent points. Consequently, person–job fit potentially offers a more complete theoretical explanation of work status differences, as IPT employees reported feeling significantly less included than both PT and FT employees. Proportionate increases in IPT employees during economic downturns suggest that line managers should pay particular attention to this group in such times. Unlike Thorsteinson (Reference Thorsteinson2003), work engagement appeared unaffected by work status. Future research is needed to replicate these results given the small IPT sample. The findings improve our understanding of IPT and PT employees' experiences, when historically there has been a focus on qualitative research and on treating employees as a homogenous group.
Limitations and future research directions
A limitation of the study is that the results are based on same-source data. This limitation is common in social science research, where some bias can result from self-reports (Bakker et al., Reference Bakker, Tims and Derks2012; de Menezes & Kelliher, Reference de Menezes and Kelliher2011). However, it has been argued that self-reporting inclusion and work engagement is the most accurate form of measurement (Downey et al., Reference Downey, van der Werff, Thomas and Plaut2015), as only the individual can report perceptions about, and attitudes toward, their work. Although self-reporting has the potential for common method bias (Podsakoff, Reference Podsakoff2003), the full collinearity VIF values obtained suggest that the results were not affected by such biases in this study.
The analysis led to the relational crafting items being omitted from the job-crafting measure, due to their lack of convergent validity. Although Slemp and Vella-Brodrick (Reference Slemp and Vella-Brodrick2013) reported a Cronbach alpha of .83 for this sub-scale, their sample was obtained primarily from FT employees. These findings raise the possibility of a connection between low task interdependence in PT roles and an opportunity to engage in relational job-crafting strategies. As Carpenter, Son, Harris, Alexander, and Horner (Reference Carpenter, Son, Harris, Alexander and Horner2016) noted, initial construct validation processes cannot account for all the varied study contexts and conditions under which a scale might later be used. Further studies of the type of job crafting PT employees choose to use are needed.
Another potential issue relates to the definition of PT work used. As the sample was comprised of Australian employees, the ABS definition was used. For international comparability, the more restrictive OECD definition of PT work as being less than 30 h a week was also applied to the data and the same modeling was conducted. Similar results were obtained. This definitional issue could, however, provide an avenue for future research into PT and FT work, allowing for international comparisons, particularly during economic downturns. In Australia, about 7.7% more employees in 2021 would be classed as FT if the OECD definition were to be used (Australian Bureau of Statistics, 2021). The Australian Bureau of Statistics (2021) further suggests that no single measure or simple dichotomy can fully capture all dimensions of PT and FT work and that hours usually worked, including the distribution of those hours, may be more useful for future research in this area.
One of the challenges of conducting research into subgroups of employees of differing work status is obtaining enough participants (Armstrong-Stassen et al., Reference Armstrong-Stassen, Al-Ma, Cameron and Horsburgh1998). The proportion of IPT employees compared to voluntary PT employees in this study was 19%). This baseline suggests sample sizes are likely to be small and, hence, PLS is a useful analytical approach in this context. The findings support the importance of future studies distinguishing between employee groups, including PT and IPT workers, but also between FT and involuntary FT (prefer to work PT) workers.
A final limitation, and one that may be relevant in a broader social science context, relates to concerns about the quality of data collected using online panels. Data quality issues may result from bias toward participants with internet access, self-selection bias, or less reliable responses resulting from the anonymity of panels (Smith, Roster, Golden, & Albaum, Reference Smith, Roster, Golden and Albaum2016). Clarity of wording, randomized question ordering, and a progress bar were included in the questionnaire design to help mitigate these concerns. However, in this case, the second student PT sample provided additional support for the relationships suggested in the PTWD model.
Practical implications
Managers can play a strong role in work design (Parker, Andrei, & Van Den Broeck, Reference Parker, Andrei and Van Den Broeck2019). Some characteristics of poor-quality PT work (e.g., lack of autonomy and interdependence and peripheral organizational tasks) are areas over which managers have some influence. These findings highlight job crafting as a possible managerial strategy to overcome work design issues. Working with, or supporting, PT employees to make changes related to task, relational and cognitive job-crafting elements could form a structured part of regular performance review processes or be more informally integrated into regular work group and task allocation meetings. It has also been suggested that when teams engage in job crafting, they have more successful collaborative arrangements. Consequently, this could be a useful approach for improving task interdependence in PT roles (Leana et al., Reference Leana, Appelbaum and Shevchuk2009).
Attention to work design appears particularly important in situations where an employee may be returning to work on a PT basis (e.g., as a new parent or following extended sick leave) or is transitioning to retirement, as these returns to work are often negotiated with managers. Employees adjusting to a PT role are often expected to keep doing the same role, in fewer hours, which can lead to work overload. HRM processes should be developed for the redesign of existing roles of this type and awareness through training, could be raised, in managers of this potential PT challenge. For example, task crafting may be helpful to identify whether there is enough autonomy or decision-making in a PT role and relational crafting may identify new or different beneficial working relationships that could promote inclusivity for this group of employees. Since the proportion of IPT work status employees may increase due to economic challenges associated with the COVID-19 pandemic, greater attention should be devoted to crafting activities that might improve the inclusion of this group of employees.
PT employees can be excluded from learning and development activities, overlooked for promotional positions, and viewed unfavorably by FT employees, which may reflect a lack of leadership support for PT roles in an organization (Smith & McDonald, Reference Smith and McDonald2016; Wittmer & Martin, Reference Wittmer and Martin2011). The role leaders and managers play in modeling desired behaviors and expectations and the promotion of a culture of inclusion have been identified as instrumental in shaping an organization's environments. Supportive managerial and leader behaviors have also been shown to play an important role in fostering an inclusive culture that can impact the success of PT work arrangements (Boekhorst, Reference Boekhorst2015; Lirio et al., Reference Lirio, Lee, Williams, Haugen and Kossek2008). Selecting proactive employees, as well as promoting job-crafting activities, could make a longer-term difference to PT employees' perceived inclusion.
Conclusions
All employees, regardless of their work status, are entitled to perform quality work and to feel included and energized at work. HRM practices that select proactive employees and promote job crafting could make a difference to PT employees' perceived inclusion. In the service sector, where PT employees form a large proportion of the workforce, such initiatives appear particularly important. The responsibility for change lies in three places. First, PT employees themselves can use this knowledge to proactively make changes to improve their roles, irrespective of hours worked, and to engage in task, cognitive and relational forms of job crafting. Second, managers can encourage inclusive workplaces, especially for IPT employees, through better work design that promotes proactive, autonomous, and job-crafting behaviors. Third, person–job fit also appears to be critical to promoting feelings of inclusion. In today's workplaces, as Barker (Reference Barker1993) observed nearly two decades ago, feelings of exclusion should not be the price PT employees pay for their work status.
Funding
This research was supported by an Australian Government Research Training Program Scholarship awarded to the first author.
Jennifer Sarich is currently working on the design and business development of post-professional award and non-award learning and development programs for an Australian university. She was awarded her Doctorate of Business Administration by the University of Western Australia and she has research interests in the human resource management of part-time employees.
Sandra Kiffin-Petersen is a Senior Lecturer at the UWA Business School where she teaches in the areas of organizational behavior and leadership. Her research interests include emotions in the workplace, work team effectiveness, and interpersonal trust. She has published in journals such as British Journal of Management, Human Relations, Personality and Individual Differences, The International Journal of Human Resource Management, and Journal of Business Ethics.
Geoff Soutar is an Emeritus Professor at the UWA Business School and has published more than 200 research papers as journal articles and book chapters. His present research interests include cross-cultural decision-making, new product and service development, and the marketing of services, especially educational and tourism services. He has published in a wide range of journals including Decision Sciences, Journal of Business Research, Industrial Marketing Management, and Organizational Research Methods.