

In 1864, Tsar Alexander II issued the Statutes on Provincial and District Zemstvo Institutions as part of a larger effort to modernize Russia after its defeat in the Crimean War.Footnote 1 This Act established a new institution of local self-government – the zemstvo – in 34 of the 50 provinces of European Russia. Besides various administrative responsibilities, the founding statutes called on the zemstva to undertake programs to support ‘the local economic and welfare needs of each province’.Footnote 2 Until 1917, this mandate led to substantial zemstvo involvement in the expansion of rural education and healthcare, in the support of local artisans and craftsmen, in encouraging credit and cooperative organizations, and in providing veterinary and agronomic services to farmers. This form of political and fiscal decentralization improved the provision of publically provided good and services at the local level.
But what makes the zemstvo an especially intriguing institution is that it was set up to include specific representation from different parts of Russian society. Legislative assemblies (sobranie) approved spending and revenue policies under simple majority voting, and these plans were then enacted by executive councils (upravy). Under the 1864 law, district assemblymen were elected by three curiae of voters: rural property owners, urban property owners and communal peasant villages. The statutes fixed the number of assembly seats from each curia in each district.Footnote 3 Therefore, the new institution guaranteed the recently emancipated peasantry at least some voice in local affairs. In this limited way, Tsarist Russia participated in the nineteenth-century trend towards wider political participation.Footnote 4
But did the structure of the zemstvo allow the peasantry to have any influence on how policy was made?Footnote 5 Under both the 1864 law and an important 1890 reform, the peasant curia was allocated a minority of assembly seats, while private landowners (predominantly the nobility) received large majorities in most districts. As a result, the nobility numerically dominated assemblies and executive committees at the district and provincial levels. This led numerous commentators to assert that the peasantry detested the institution and viewed it as a way for the local elite to impose their authority (and taxes). Under this interpretation, limited zemstvo spending was enacted to head off social unrest at a relatively low cost and perhaps some benefit to the landed elite.Footnote 6 Other authors argue that the zemstvo served as a locus for late-Tsarist liberal opposition. In that capacity, the institution attracted participants who were particularly supportive of policies to improve conditions for the peasantry.Footnote 7 A simple median voter framework would suggest that at the margin, the allocation of assembly seats to the peasantry should have had little impact on the policies pursued, because private landowners – regardless of their policy preferences – typically held large majorities in the district assemblies.
Recently, a number of studies have considered how increasing the political voice of previously underrepresented groups (such as women, ethnic minorities, or low social classes) through new electoral rules or political quotas may influence local public policies.Footnote 8 The impact of such reforms depends on the way that these formal changes in voice were channeled through local political institutions. In the Russian case, peasant assembly representation may have created opportunities to propose policies, to obtain agenda-setting executive positions, or, most importantly, to ally with liberal elements of the other curiae to defend spending proposals. This article is the first in the literature on the zemstvo to combine archival and statistical evidence to investigate how, if at all, the institution's political structure influenced spending and revenue policies. The findings are consistent with the presence of indirect ‘democratic’ political channels being operative in at least some districts, especially late in the period during the escalation of zemstvo activity after 1890.
In the empirical analysis, I employ a newly collected district-level panel data set of zemstvo political characteristics and budgetary information to investigate the role of peasant representation in policymaking. Employing a variety of econometric models, I find that relative property tax rates, total spending per capita and the allocation of funds to education, a category that was particularly aimed at the peasant population, were positively and significantly associated with the share of legislative seats assigned to the peasant curia. To interpret these findings, I turn to a series of extensions: an evaluation of exactly where the variation in assembly seat allocations came from and had the largest effects, tests of whether the effects are limited to politically ‘contestable’ districts, and panel data specifications. These extensions do not overturn the general finding that the peasantry's position in the institution influenced zemstvo policies, especially in the late period. However, they do suggest that the influence of the peasantry was unlikely to have come through any median voter effect. Rather, minority peasant representation appears to have mattered more in districts that may have contained a more liberal gentry class.
The article is divided into four parts. The first describes the organizational structure of the zemstvo and sketches its role in providing local administration and public services in the period 1864–1914. I then utilize archival and published sources to detail how the electoral structure of the zemstvo functioned in theory and in practice. The third, main part of the article considers the empirical relationships between the political structure of the zemstvo and budget outcomes. A concluding section outlines the implications of these findings for our understanding of Imperial Russia's economic development and identifies some of the many questions about the zemstvo that remain to be explored.
1. What was the zemstvo?Footnote 9
Before the Great Reforms, the Tsarist regime had a limited presence outside the capital cities.Footnote 10 Substantial authority was left to the landed nobility, but they funneled few resources towards education, healthcare, transportation, or other local public goods.Footnote 11 In practice, peasant (and urban) communities possessed significant de facto autonomy, but limited resources and collective action problems precluded large investments in public goods and services.Footnote 12 By the late 1850s, relatively few Russians attended school, rural infrastructure was appalling, and healthcare was practically non-existent.Footnote 13 In this context Alexander II convened a Special Commission on Provincial Reform, which concluded that there was a need for an ‘all-class’ institution of local government. Coming amidst the planning for peasant emancipation, hopes were that such an institution would increase government revenue collection, foster local economic development, and provide outlets for defusing potential unrest.Footnote 14
After an initial organizational period, zemstva existed in 34 provinces and over 350 districts between 1882 and 1911.Footnote 15 The 1864 law did not establish the institution in more peripheral regions, either because the population was too sparse (Siberia and the north), special governing bodies already existed (e.g. military authorities in the Caucasus), or because no amount of electoral rigging could guarantee that an Orthodox Russian elite would maintain control (e.g. the Byelorussian provinces).Footnote 16Zemstva were founded in the Byelorussian provinces in 1911 and in three southeastern provinces in 1913. Laws promulgating provincial, district, and (new) township-level zemstva throughout the empire were announced in spring of 1917, but the institution was abolished by Soviet decree in late 1917.
Throughout its existence, the zemstvo had two components at both the district and provincial levels: assemblies that met once or twice a year and executive boards. District assemblymen were elected for three-year terms in a complicated electoral process (outlined in detail below). At their meetings, these assemblymen voted among themselves for representatives to the provincial assembly, for the district executive boards, and for various commissions and representatives to non-zemstvo bodies.Footnote 17 The executive boards carried out the day-to-day functioning of the zemstva and set the agendas for the assembly meetings. These meetings – which lasted for up to two weeks by the 1910s – heard reports on dozens of large and small issues, granted or denied funding to ongoing or proposed projects, and approved the proposed budget for the coming year.Footnote 18 Clause 89 of the 1864 law required open, majority voting on any agenda item in the assembly meetings, with ties broken by assembly chairmen. Scattered references to voting practices suggest that many zemstva practiced closed balloting over more contentious issues.Footnote 19Zemstvo boards and commissions executed expenditures through contracts sold at public auctions, by commissioning specialists to manage projects, or by directly employing workers.Footnote 20
Any assemblyman could propose new projects or amendments to existing programs, but such initiatives had to fall under the zemstvo's statute responsibilities.Footnote 21 Clause 2 of the 1864 law outlined 14 functions of the new institution, divided into two categories: obligatory and non-obligatory.Footnote 22 The former included provisioning troops and funding local courts and other administrative bodies. The zemstvo was also made responsible for allocating central government tax obligations among district residents and property owners, although the actual collection of revenues remained the duty of the local police. Non-obligatory functions included a variety of services, such as schooling, public health and agronomy – anything supporting ‘the local economic and welfare needs of each province’.Footnote 23 Reforms in the decades after 1864 shifted some obligatory responsibilities to central ministries while detailing the scope of zemstvo activity in the non-obligatory categories.Footnote 24
Despite the broad mandate, various measures were put in place that restricted the autonomy of the zemstvo. All budgets and programs approved by both provincial and district assemblies had to be forwarded to the governor (or sometimes the Ministry of Internal Affairs) for final ratification. The governor was endowed with veto rights, which he could employ if zemstvo plans violated the law, if they were financially unsound, or if they impinged upon another government agency. Under the 1890 reform (discussed more below), external veto rights were strengthened, and additional oversight was imposed on zemstvo decisions.Footnote 25 Under both laws, responsibilities and revenues were divided between the province and district zemstva, but provincial assemblies could disallow district-level initiatives that interfered with provincial or state interests.Footnote 26 Finally, legislation throughout the period strictly limited zemstvo cooperation across provinces due to fears of coordinated political opposition.
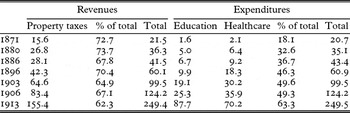
Despite these limitations, the creation of the zemstvo was a considerable decentralization of Tsarist policymaking that enabled the funding of public goods and services. Table 1 summarizes expenditures (provincial and district) for all zemstva in benchmark years (revenues are discussed below).Footnote 27 Real per capita zemstvo expenditures increased by approximately 500 percent, from 0.5 to 2.8 rubles between 1877 and 1903.Footnote 28 Expenditures per capita showed considerable geographical variation, ranging from less than 0.18 rubles per capita in Tul'a to over 2.3 in St Petersburg province in 1877. In 1903, the range was approximately 1 (Penza) to over 4.3 rubles per capita (Olonets).Footnote 29
Total zemstvo revenues and expenditures, select years (millions of current rubles)

Note: Numbers refer to the sum of district and provincial revenues and expenditures for just the 34 provinces with zemstva in 1903. The spending totals for 1871 and 1880 do not include Samara province (hence the differences between total income and expenditures). Property tax income in 1871 and 1880 is defined slightly more broadly than the years that follow (hence, the larger portion of total income). Data for 1871 and 1880 are budgeted rather than actual totals. The difference in total spending and income for 1913 reflects extra expenditures on items budgeted in 1912. Finally, the price indices of Mironov (Reference Mironov2010) and Gregory (Reference Gregory1982) show inflation of approximately 35% between the early 1870s and 1913. With the population of the zemstvo provinces increasing from roughly 50 to 88 million, real per capita zemstvo expenditures increased by 500% over the period.
Sources: 1871 and 1880 are taken from Veselovskii (1909-11); 1886 is from Russia, Tsentral'nyi, Sbornik (1890, pp. 226–33); 1896 is from Russia, Tsentral'nyi, Zemskie (1896); and 1903–13 are from Russia, Statisticheskoe, Dokhody (1908-15).
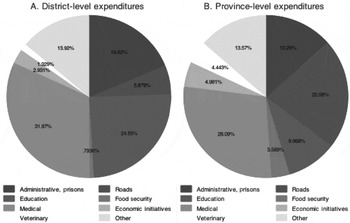
Figure 1 decomposes budgeted district and provincial zemstvo expenditures for 1903. Besides administrative expenses, the zemstva supported road construction and maintenance, grain storage, agronomy/veterinary extension, and a variety of other economic measures.Footnote 30 The zemstva spent more on healthcare than any other category – 32 percent of district and 28 percent of provincial expenditures. This spending included preventative measures, like vaccinations and the monitoring of diseases, and curative efforts, such as hospitals, traveling doctors and rural feldshers, or trained medics.Footnote 31 Primary education was the other large recipient of district zemstvo spending, while provincial zemstvo funds typically went towards teacher training and secondary schools. Although the management of schools was generally left to school district officials, the zemstvo supported school construction, paid for books and supplies, and (especially) provided teacher salaries.Footnote 32 Overall, the share of zemstvo expenditures going towards education and healthcare rose from about 18 percent in 1871 to over 63 percent in 1913. At the same time, public services other than defense received relatively little from the central government before the 1900s. After 1900, the center increased direct grants to provincial and district zemstvo, especially for education.Footnote 33
Breakdown of 1903 zemstvo expenditures

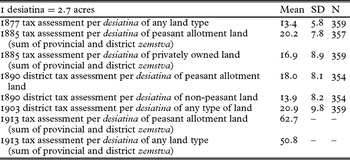
In terms of revenues, zemstva collected payments for trade and commercial rights, for renting out zemstvo-owned property, for issuing passports, and for various goods and services, such as seed grain.Footnote 34 But as Table 1 indicates, the majority of zemstvo revenues were generated by property taxes imposed on land, urban structures and various forms of ‘immovable’ capital.Footnote 35 Tax rates were to be based upon yearly property income but not who owned the property (clause 92). Provincial and district assemblies had the right to set their own rates (subject to some outside monitoring), and these rates could be adjusted to reflect changes in assessment rules or in the value of taxable property.Footnote 36Table 2 provides evidence that peasant communal land – the land received in the emancipation settlements – was taxed at a higher rate than privately owned land throughout the period. Across districts in 1890, peasants paid about 4 kopeks more per desiatina (2.7 acres) than did private landowners. Despite the fact that former serfs often received the worst of estate land in the emancipation settlements, this gap persisted through 1913.Footnote 37 Finally, although year-to-year arrears in local revenue collection were often substantial, intra-governmental transfers and borrowing apparently kept most zemstva solvent.Footnote 38
Mean zemstvo land taxes, select years (kopeks)

Sources: N refers to the number of districts supplying data. 1877 data are from Russia, Departament, Statisticheskiia (1883); 1885 from Skalon (Reference Skalon1988); 1890 from Veselovskii (1909–11, vol. 1, appendix VII, pp. 648–52); and 1903 and 1913 from Russia, Statisticheskoe, Dokhody (1908–15). The 1913 data are averages of all taxes across all types of land and refer to all 40 provinces with zemstva at that time. There were 100 kopeks in a ruble.
2. The political economy of the zemstvo
In 1889, the Russian State Council argued that, ‘there can be little doubt that the calling of locally elected people to lead local matters has significantly improved provincial life and led to the wide satisfaction of the demands of the local population’.Footnote 39 While the zemstvo was a significant source of funding and organization for rural public services, did this have anything to do with the way the institution ‘called’ on the local population, especially the majority who were peasants? Social scientists commonly assert that political and fiscal decentralization can improve the provisioning of public goods and services because local politicians have better information regarding local preferences and can use this to improve targeting or elicit greater contributions.Footnote 40 However, this is only true if local political institutions make politicians accountable for their actions. If local authorities are simply appointed or face no (electoral) mechanisms holding them responsible for their policies, then decentralization may result in the ‘capture’ of the local public sector by an elite minority.Footnote 41 As related below, the structure and electoral processes of the zemstvo did not generate perfect democratic accountability, and representatives may have had little incentive to be responsive to constituent demands. This is likely to have affected the extent to which the peasantry's preferences impacted upon revenue and expenditure policies.
According to the 1864 statutes, each district assembly was to include between 10 and 100 representatives elected for three-year terms by three curiae of property owners. The first curia was comprised of rural property owners from any social class with at least a minimum amount of property (either land or other forms of ‘immovable property’).Footnote 42 The second curia included any district resident holding urban property in the district of at least a minimum size or value.Footnote 43 Eligible voters in the first two curiae elected representatives to district assemblies at primary meetings.Footnote 44 The third curia was made of representatives indirectly elected from peasant communal villages (i.e. communal property owners).Footnote 45 Village councils of household heads (skhody) sent approximately one member for every 10 households to township meetings, where a fixed number of electors (vyborshchiki – roughly one for every two to five skhod representatives) were selected for district primaries.Footnote 46 At their primaries, the first and second curiae could only elect representatives who were eligible to vote, while the third curia could elect non-peasant assemblymen from the other curiae.Footnote 47 In all primaries, voting over representatives was supposed to take place by closed balloting. Until the 1900s, formal affiliations with political parties were explicitly forbidden in these elections, and there is no evidence of active campaigning or electoral platforms.Footnote 48
In each district, the curiae elected a specific number of assemblymen according to the ‘number of landowners, the size of arable lands they own, population of the towns, number and value of urban properties, number of townships, rural population, and the amount of land in possession of the rural communities’.Footnote 49 In this way, representation was supposed to reflect each curia's interests in local affairs and relative contributions to zemstvo revenues. However, even though the peasantry was over 85 percent of the population in European Russia and contributed the largest share of local taxes, policymakers argued that peasant illiteracy and political inexperience required them to weigh the seat allocation towards the first curia, where the landed nobility predominated.Footnote 50 The State Council's final deliberations apparently followed two rules of thumb: no absolute majority curia and, for the first and third curiae, one representative for property equal in size or value to 3,000 average peasant landholdings. However, if a former serf community had not yet begun to redeem (i.e. buy with state financing) their land from their former seignior, the property was credited to the previous owner.Footnote 51
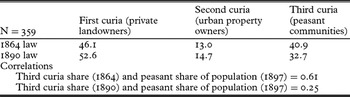
The first row of Table 3a summarizes the statute seat allocation for the provinces with active zemstvo after 1875. On average, the first curia assemblymen were the most numerous, forming an overall majority in 66 districts despite the State Council's ‘rule of thumb’. Moreover, when combined with the second curia, the two formed an overall majority in 322 of 359 districts. In contrast, the third curia was granted a plurality in 73 districts and an absolute majority in 18 of those. Districts with these ‘peasant zemstva’ had too few eligible voters in the first two curiae to supply more assemblymen.
Statute representation in district zemstvo assemblies

Note: The means from the 1864 law include a small number of adjustments of seat that allocations that occurred before 1890, including all but one of the districts of Bessarabia province, which only opened a zemstvo in 1870, and in Ufa province, which opened a zemstvo in 1875.
Sources: PSZ, series II, vol. 39, issue 3 [appendices], and series III, vol. 10; Russia, Khoziaistvennyi, Sbornik (1878–90); Troinistikii (Reference Troinitskii1905); Obchinnikov (Reference Obchinnikov1872).
Peasant representation was made even less proportional to population or land when an important reform of the zemstvo in 1890 significantly adjusted the statute allocations of seats.Footnote 52 This reform, which was part of a conservative trend in policymaking under Tsar Alexander III, shifted electoral weight away from the third and toward the first curia. As Table 3a indicates, the statute number of assemblymen fell from 13,196 in the district zemstva (2,284 in provincial assemblies) to 10,236 (1,618), with most of the reduction coming from the third curia's share. The first curia went from an absolute majority in only one district under the 1864 law to 294 districts under the reform, while the peasant curia was left with a plurality in only 41 districts, but a majority in 26 of these.
The 1890 reform also shifted the underlying definitions of the curiae away from property and towards social class.Footnote 53 Concerned with the gentry's shrinking landholdings and influence role in the zemstvo, reformers restricted the first curia electorate to the nobility of at least a certain – now smaller – amount of property. All other private property holders (urban and rural) were placed in the second curia, but peasants could only participate if they had formally separated from the commune and were no longer liable for a share of collective tax and land obligations.Footnote 54 Governors now picked assemblymen of the third curia from a list of candidates proposed in the township meetings, rather than simply certifying those elected in the curia primary. In practice, this meant that the governors often selected the third curia assemblymen recommended by sitting executive boards or district land captains (non-peasant local authorities established under an 1889 law), thereby circumventing direct democracy. This continued until 1907, when the direct election of third curia assemblymen was reinstated.Footnote 55
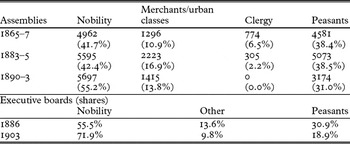
Table 3b summarizes data from three zemstvo elections showing that the number of peasants in district assemblies closely corresponded to the number of seats set aside for the third curia and fell with the passage of the 1890 law.Footnote 56 The malapportionment of statute seats translated into minority political positions for the peasant majority in almost all districts. And representation corresponded to even lower shares of executive board positions in 1886 and, especially, 1903.Footnote 57
Actual representation in the district zemstva

Note: For the 1865–7 period, only 29 zemstvo provinces conducted elections. As a result, the total number of assemblymen = 11,915 (in contrast with 34 provinces and 13,196 assemblymen in 1883–5), including 302 of unknown social class. In 1883–5, 86.4% (N = 4635) of third curia representatives were peasants. The 1890–3 data do not include 37 districts where the first and second curiae were unified into one.
Sources: Veselovskii (1909–11, vol. 3, pp. 433–4 and 674); Russia, Tsentral'nyi, Sbornik (1890, pp. 226–33); Syrnev (Reference Syrnev1888); and Zakharova (Reference Zakharova1968, p. 14).
In theory, representation may have mattered because assembly decisions were taken by majority voting. Assembly minutes indicate that many votes were contested, with proposals voted down or narrowly passing.Footnote 58 But the electoral weight of the first and second curiae meant that they could overcome the third curia on any issue. A simple median voter model would imply that third curia representation had little influence translating peasant preferences into policy, especially when governors appointed third curia assemblymen from nominations. And with relatively high travel and communication costs, the multi-tiered system of third curia elections generated representatives who were possibly quite distant – physically, socially and politically – from their peasant constituents.Footnote 59 Regardless of their electoral weight, if third curia assemblymen were unwilling or unable to represent the preferences of their constituents, then the zemstvo may have been especially unresponsive to specifically peasant demands.Footnote 60
Contemporaries viewed the assemblies as the democratic heart of the zemstvo, but the executive boards undertook much of the institution's policymaking. These boards held agenda-setting power in assembly meetings and were important participants in the budgeting process.Footnote 61 In several modern developing countries, the identities of local executive authorities have been found to significantly affect the supply of public goods and services. Recent reforms in India mandated that a share of local council leadership positions be set aside for women, lower castes and minority tribal groups. Districts where previously underrepresented populations received executive positions exhibited not only greater transfers to such groups but also had higher overall levels of public investment.Footnote 62 Such an explicit assignment of positions did not occur in the Russian case, but some peasants were elected to the zemstvo boards (Table 3b).Footnote 63 Perhaps it was these few positions, rather than third curia assembly seats per se, that allowed peasant preferences to influence zemstvo policy.
Despite the minority position, limited accountability of assemblymen, and relatively few executive positions, third curia representation of peasant interests might have influenced policies in other, more indirect ways. Research on Indian legislative reforms in the 1990s shows that increasing the representation of a minority group, even if it does not result in a majority position, can influence government policies.Footnote 64 The mere presence of peasants in the zemstvo assemblies may have given voice to policies that otherwise would have no advocates. Moreover, rather than passively attending the assemblies, as some authors have argued, peasant representatives may have lent pivotal electoral support to other factions pushing for a particular program.Footnote 65 Although many non-peasants were often uninterested in zemstvo matters, Veselovskii and others have noted that the expansion of zemstvo activity was driven by a cadre of middle-rung, liberal-minded gentry who often found themselves in conflict with more conservative members of the landed nobility.Footnote 66 In such cases, a minority peasant voting bloc may have supported the more pro-peasant policymakers from other curiae.Footnote 67
But were peasant representatives really a ‘bloc’ with a unified set of policy goals? If so, what defined specifically ‘peasant’ preferences over public spending and revenue policies? Scholars have labeled the relatively few districts with third curia majorities ‘peasant zemstva’ and noted that they spent more on the provision of public goods and services, especially when it came to rural primary education.Footnote 68 Other categories of public expenditures – medical care, roads, etc. – plausibly entailed more diffuse benefits, which may have limited their relative appeal to the peasantry.Footnote 69 Moreover, it was surely in the peasantry's interests to shift some of the costs of any extra spending onto property owners in other curiae. But, as outlined above, the third curia assemblymen may not have represented the median peasant, because the nomination and electoral processes surely favored the politically powerful, they were probably more wealthy, and, from 1890 to 1906, they were appointed by governors based on the recommendations of the other local officials.
At the same time, at least some assemblymen from the first two curiae may have been just as interested in more local public spending or in funding for rural schools. If such expenditures improved local economic conditions, non-peasants possibly stood to benefit, especially if a large share of the costs was borne by the peasantry.Footnote 70 More liberal gentry may have held ideological motivations for supporting pro-peasant policies, while, with zemstvo expenditure levels at a relatively low 1–2 rubles per capita, even the more conservative local non-peasant elite may have advocated zemstvo activities as a way to extract rents themselves or to ‘bribe’ the peasantry in exchange for social quiet.Footnote 71 With such a wide range of possibilities, whether the shares of third curia assemblymen or peasants on executive boards represented a unified set of policy preferences, and whether these positions actually had any influence over zemstvo policies, constitute important empirical questions.
3. The empirical implications of zemstvo ‘democracy’
The zemstvo was clearly not an egalitarian system of perfectly democratic policymaking. Representation was not proportional, and there were numerous ways that the peasant majority's voice was dampened. Despite this, did the political structure of the zemstvo allow the peasantry some say over taxes or expenditures? The previous section presented a number of hypotheses regarding the relationship between third curia representation and/or peasant executive authority and zemstvo budget policies. First, the identity of who held actual political power within the new institution may have influenced zemstvo decisions. Did the attainment of executive positions by the newly emancipated peasantry affect spending and revenue patterns? Second, if the majority voting structure of the zemstva really mattered, then the third curia's influence on policies may have been more evident in districts where the peasant representatives were pivotal voters. And finally, even if the statute assembly seat allocations did not lead to third curia majorities or executive authority, having more peasant representatives may have influenced zemstvo policies through more indirect channels. Of critical importance in addressing these possibilities is to understand why the electoral structure of the zemstvo – especially the distribution of seats by curia – varied across districts.
To investigate these hypotheses and related questions, I collected district-level zemstvo expenditure and revenue data for a number of years.Footnote 72 I matched these data to information on the legal allocation of assembly seats (from the two statutes), to the detailed data on the 1883 election, and to a variety of socio-economic indicators. These last variables are generally only available for a small number of years, which limits matches to the zemstvo budget data. In addition to the spatial richness of the resulting dataset, the budgetary information for years before and after 1890 makes it possible to exploit the temporal variation in the third curia assembly seat shares. The variables in the data set are summarized and documented in Tables 2, 3 and A1. An ancillary outcome of this effort is one of the first (panel) data sets in Russian economic history that covers a significant geographic area at a sub-provincial level. In what follows, I employ these data to study the budgetary implications of the zemstvo's electoral structure in several empirical steps.
3.1. Peasant political positions and zemstvo property tax rates
I begin the analysis on the revenue side of the ledger. Variation in revenue sources across districts is not an adequate measure for evaluating the local political economy of zemstvo policymaking, because the amounts of taxable property and non-property tax revenue were determined by law and underlying economic conditions, rather than by explicit decisions of the zemstva. However, property tax rates were set by assemblies with only limited outside interference.Footnote 73
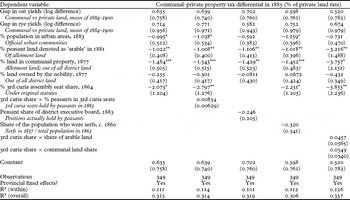
Therefore, I consider the differential between zemstvo tax rates on peasant (communal) land and privately owned land in 1885. On average, communal land was taxed at 20.2 kopeks per desiatina, versus 16.9 kopeks for private land (Table 2). While it may be possible that communal land was better on average, data on grain yields from the 1890s would suggest otherwise (Table A1).Footnote 74Table 4 reports estimates of the following simple OLS model of the percentage gap between the two tax rates:

Here, Y is the percentage difference between the two tax rates ([communal – private]/private), X is other explanatory variables and i indicates the district. To control for the underlying quality of taxable property, the explanatory variables include the percentage differences in mean oat and rye yields (the two most important crops grown throughout European Russia) on the two types of land over the period 1884–1900, the share of the population who resided in urban areas in 1883, the portions of land owned privately by the nobility or under peasant communal tenure in 1877 (the excluded property includes state-owned land, other types of privately held land and vacant land), the share of communal land that was arable in 1881, and provincial fixed effects (pj) to control for regional characteristics and factors constant across zemstva in a particular province. Including fixed effects means that the identification relies on within-province differences in peasant political ‘rights’.Footnote 75 Finally, in some specifications, I also include the share of the population who were serfs at the time of emancipation (as opposed to urban citizens, merchants, nobility, or other types of peasants). Due to the land settlement process, such areas may have had greater quality differences between the land retained by former serf owners and peasant communal land. This serf variable also serves as a proxy for inequality, which may have influenced the way politics worked inside the zemstvo.
What determined zemstvo land tax rate differentials in 1885?

Note: ***p < 0.01, **p < 0.05, *p < 0.1 See Tables 2, 3 and A1, and the text for information on the variables in these specifications. The regressions are all OLS with provincial fixed effects and robust and clustered (at the provincial level) standard errors. The dependent variable is defined as the percentage difference in the tax rates per desiatina (2.7 acres) on communal (peasant) and private land. The share of noble landownership variable is missing for one province (Taurida) with 8 districts, but the other results are little changed if this variable is dropped.
In the first column of Table 4, the main variable – ‘peasant political influence’ – is measured by the third curia seat share under the 1864 law.Footnote 76 Taking advantage of the timing of the data, the other models utilize direct measures of the political positions achieved by the peasantry from the unique data on the 1883–6 electoral term. These models test whether specific positions mattered more than statute third curia seats.Footnote 77 For the models of Table 4, the identifying assumption is that the within-province variation in the political variables is uncorrelated with unobserved determinants of the tax rates.
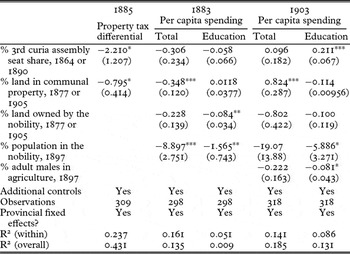
The results in Table 4 offer qualified support for an effect of peasant political voice on zemstvo property taxes. The negative coefficient on the assembly seat share in columns 1, 2, 4 and 5 implies that 1 percent greater peasant representation was associated with a 2–6 percent smaller tax gap, a relatively large effect. However, when the actual share of peasants elected by the third curia is interacted with the formal third curia share (column 2), there is no additional representation effect.Footnote 78 Moreover, if the share of peasants in executive board seats is employed (column 3), the estimated coefficient, although having the expected negative sign, is small and not statistically significant. If the third curia share variable is replaced with the first curia share (not reported here), the coefficient is negative and significant (albeit smaller in size). The share of the population that was formerly serfs was unrelated to the tax gap.
In addition to these main results, other coefficients exhibit suggestive patterns. The negative coefficient on the urban population share probably means that privately owned land in such areas had greater commercial potential and was taxed at a higher rate. Districts where peasants had a greater share of all land, or where more of their land was arable, showed more equal tax rates. This may simply mean that private property in such districts was more highly selected, and, therefore, more valuable. Alternatively, these negative coefficients may reflect the greater bargaining power of the peasantry in districts where they held more wealth, irrespective of the zemstvo's electoral structure. However, the converse – areas where the nobility owned a lot of land – showed no relationship with the tax gap.Footnote 79
The absence of any association between actual peasant positions in the zemztvo and the tax rate gap suggests that statute third curia representation may reflect more indirect political channels. Alternatively, the curia share may be picking up unobservable factors associated with the relative quality of the two different types of property. As an indirect way of investigating this explanation, I interacted the assigned curia seat share with the arable land share and the communal land share (column 5). While the interaction terms are not statistically significant, their positive signs and the larger absolute size of the curia seat effect in column 5 imply that the allocation of seats was possibly related to other district characteristics, a possibility I return to below.
The findings in Table 4 are consistent with a relationship between the allocation of assembly seats and zemstvo policies. A larger third curia meant a lower property tax gap, but the ‘effect’ of the peasant block was not reflected in actual peasant political achievement and was slightly weaker in districts where peasants possessed higher-quality land. This indicates that the curia share is probably not a simple measure of political voice, and whether the coefficients represent a causal mechanism depends on what drove the variation in share of seats assigned to the third curia. If unobservable determinants of the seat allocation were correlated with the error term in equation 1, then the resulting estimates of the third curia share effect may be biased.Footnote 80
3.2. Did peasant representation influence zemstvo spending?
A relative shift in the burden of taxes did not necessarily mean that the electoral structure allowed the peasantry to affect the zemstvo's provision of goods and services. A more direct test of this is to consider how spending patterns were related to the peasantry's role in the zemstvo's political system. While the 1883 data on zemstvo politics can be matched to the 1885 data on taxes, there exists no similar information on expenditures for the same electoral cycle. However, district-level spending data do exist for other years and were matched to the statute curiae shares (under both laws) and other covariates. I use these data to investigate whether the curia structure allowed the peasantry to influence zemstvo expenditures. I address concerns about the possible endogeneity of the curia shares below.
I begin with the following simple cross-sectional model, where Yi is per capita zemstvo spending in total or on a particular category in district i:Footnote 81

3rdCuriaShare is the portion of district assemblymen allocated to peasant communes under the 1864 or 1890 law (depending on the year of the dependent variable). As in the models of Table 4, I include the share of votes in the third curia rather than all three curia shares separately, because there were a number of districts where the first and second curia were unified. I also control for other possible determinants of either the demand for, or supply of, zemstvo expenditures in the Xi vector, and for unobserved factors that were constant within a province. I vary the controls across specifications due to necessity (not all years of budget data could be matched to the similar controls) and as a check on the underlying correlations. If the coefficients on the curia share variables change significantly as controls are added, that may be a sign that an unobserved factor is biasing the estimates.
Income and wealth levels were most likely related to the ability to finance zemstvo expenditures and to the demand for the services such spending provided. To capture this, different specifications of equation 2 include some or all of the following variables: the average male agricultural wage for the period 1884 to 1900, the portion of peasant land that was arable, the share of the adult male population occupied primarily in agriculture, and measures of per capita local tax receipts in various years.Footnote 82 I also include the urban share of the population and a dummy variable equal to one if the provincial capital was in the district. Commercial activity and wealth were concentrated in urban centers, which also possessed non-zemstvo town governments that collected their own taxes and acted as alternative suppliers of public goods and services. The clearest case of this was in those districts where provincial capitals were located. Municipal governments in provincial centers funded public services that catered to the entire province, and the central government also concentrated its activities in those cities. To control for any economies of scale in spending, most specifications include the log of the total land area of the district.Footnote 83
Migration was limited in this period due to work passport requirements, residential restrictions and transportation costs, so it is unlikely that Tiebout sorting induced endogeneity between peasant representation and zemstvo policies. But some provinces with zemstva were only recently incorporated into the empire, and there may have been different demands for public goods in frontier areas. Therefore, in some specifications I control for the share of the population born in another province in 1897. Finally, more non-peasants (or greater property ownership by non-peasants) may have impacted on zemstvo policymaking by changing the composition or orientation of curia and assembly meetings. After experimenting with a number of specifications, Tables 5 and 6 also report models that include the share of the population in the noble estate in 1897 and the share of land owned by the nobility.Footnote 84
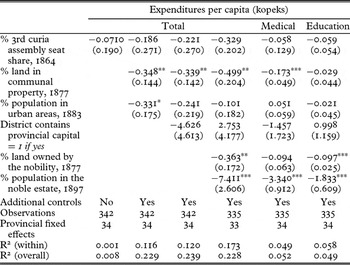
Understanding district zemstvo expenditures in 1883 – baseline

Note: ***p < 0.01, **p < 0.05, *p < 0.1 Regressions are estimated by OLS with robust and clustered (by province) standard errors in parentheses and constant terms (not displayed). The explanatory variables are described in the text and summarized in Tables 2 and A1. All ‘%’ variables are in percentage points – i.e. 80% = 80. The 1883 expenditure data are missing 17 observations distributed across 13 provinces. The ‘Additional controls’ include the log of the total land area (in desiatina) and the portion of peasant land that was arable in 1881. Including a per capita measure of the tax burden had no effect, although 16 observations are lost – these results are available upon request. If provincial fixed effects are not included in the model of column 1, then the coefficient estimate on the curia share variable is −0.308 (s.e. = 0.349) with an R2 of only 0.008.
For the baseline specifications, I focus on two years of budget data – 1883 and 1903 – that bracket the 1890 reform and can be matched to many other variables.Footnote 85Table 5 reports regression estimates for three dependent variables available in the 1883 data: total per capita expenditures and per capita expenditures on education and healthcare. The results provide little support for any relationship between third curia representation and zemstvo expenditures.Footnote 86 The signs on the curia coefficients are actually negative, although never statistically significant. Areas with more land in communal property exhibited significantly lower total expenditures and expenditures per capita on healthcare, while there is some indication of lower expenditures in urban areas.Footnote 87 Intriguingly, greater noble landownership and a greater share of nobles in 1897 were associated with less spending. Thus, third curia representation had little relationship with how the institution spent money before 1890, although both greater noble and communal land ownership were associated with lower expenditures.
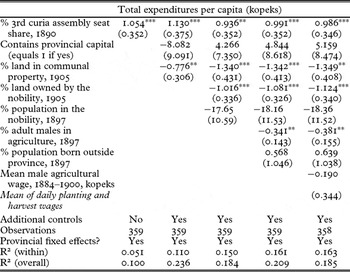
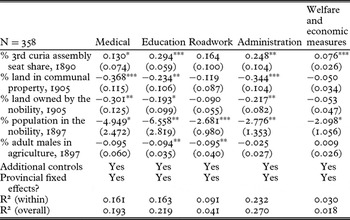
When I apply the same empirical model to the 1903 budget data, I find very different results. In Table 6a, which presents models for total per capita expenditures, the estimated coefficients on the third curia assembly share are large, statistically significant, and positive. A one standard deviation increase in the share of seats assigned to the third curia (roughly 12 percent) was associated with roughly 10–13 more kopeks spent per capita. Areas where communes or the nobility held relatively more property continued to show lower levels of spending. Districts with more agricultural employment saw lower expenditures, which may have reflected lower returns (demand) for zemstvo spending. Agricultural wages, the migrant population share, and other controls (not shown) were unrelated to total spending levels.
Understanding district zemstvo expenditures in 1903 – baseline

The results presented in Table 6b (which draws on the model of column 5 in Table 6a) show that the third curia relationship was especially strong for spending on education and zemstvo administration. These two categories contributed about 50 percent of the total expenditure effect. Education was precisely the spending category that scholars have associated with high peasant demand, while zemstvo administration included executive board salaries, office expenses, support for other local government bodies (courts, treasuries, etc.), and prison maintenance. These forms of expenditures may have provided more opportunities for rent-seeking. The other three categories of expenditure all show positive, albeit smaller, coefficients on the third curia share.
By category

Note: ***p < 0.01, **p < 0.05, *p < 0.1. The specification is the same as in Table 7 (with constant terms). The variables are described in the text and summarized in Tables 3 and A1. In Table 6a, the ‘Additional controls’ include the portion of land that was arable in 1881, the log of the total land area, and the urban share of the population in 1904. The models in Table 6b include these controls, the provincial capital dummy variable, and the mean wage level in the 1890s. Including a measure of mean tax burdens does not change the results. In Table 6a, excluding fixed effects from the first model results in a coefficient of 1.547 (s.e. = 0.776) on the third curia share variable.
Besides these findings, the other coefficients closely follow those in Table 6a. Communal and noble land ownership was associated with lower spending, while more agricultural areas saw slightly lower spending on education and infrastructure (consistent with lower returns to education or road maintenance in less commercial districts). The significant and negative coefficients on the nobility's population share in a district – especially for education – suggest that zemstvo policies were sensitive to the demands of a constituency that was possibly opposed to specific peasant interests.Footnote 88
What exactly lay behind the 1903 third curia ‘effect’? The positive coefficients in Table 6 may reflect representation's influence on policymaking, but the absence of strong correlations for the pre-1890 period seems to belie any simple median voter explanation. Moreover, in both years, the areas with larger communal and noble landownership showed lower expenditure levels. Areas with more state-owned and vacant land were more peripheral, and may have been precisely those identified by contemporaries as possessing ‘peasant zemstva’.
3.3. Extensions to the baseline models: ‘peasant zemstva’ and ‘contestability’
Contemporaries noted that ‘peasant zemstva’ districts saw greater spending, especially on education. The inclusion of provincial fixed effects would seem to take such regional differences into account, but a simple way to evaluate whether the third curia effect existed across European Russia is to exclude the provinces specially noted to possess ‘peasant zemstva’ and re-estimate the models from Tables 4–6. Table 7 reports the results from such an exercise when the provinces of Viatka, Vologoda, Olonets and Perm are dropped.Footnote 89 Overall, the channel from the statute third curia seat share to tax and spending policies was somewhat weaker outside the ‘peasant zemstvo’ provinces. The third curia share was associated with more equal tax rates, was uncorrelated with 1883 expenditures, and was positively related to 1903 education spending but not total spending. But all the curia coefficients were somewhat smaller than when estimated over all provinces.
Dropping the provinces with ‘peasant zemstva’

Note: *** p < 0.01, ** p < 0.05, * p < 0.1. These models drop all observations from Perm, Olonets, Viatka and Vologda provinces. Otherwise, column 1 is equivalent to column 5 in Table 4, columns 2 and 3 are equivalent to columns 3 and 6 in Table 5, and columns 4 and 5 are equivalent to column 5 of Table 6a and column 2 of Table 6b. Including the interaction terms and other variables employed in Tables 4–6 did not affect these results. The 1864 third curia share variable is used for the first three models, and the 1890 for the last two models (similarly for the% communal land variable).
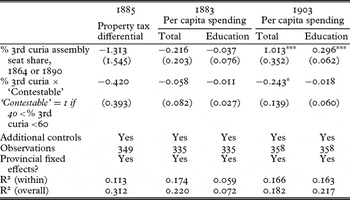
Even outside the ‘peasant zemstva’ provinces, it appears that minority peasant representation had some consequences for zemstvo policymaking. But why do the findings in Tables 5 and 7 not support this for 1883 when the peasantry had a much larger share of seats? In a standard median voter model of legislatures or committees, the effect of an additional seat should be stronger in settings where the majority opinion is ‘swing-able’. I explore this possibility by defining a measure of the ‘contestability’ as a dummy variable equal to one if the third curia was assigned a portion of the seats near the majority cut-off (between 40 and 60 percent of the total seats). I re-estimated versions of the models from Table 7 but include an interaction between this measure and the relevant third curia share variable. It is worth noting that the number of the contestable districts changed sharply with the 1890 reform. Under the initial law, 208 districts had third curia shares between 40 and 60 percent. After 1890, only 18 districts fell into that range. I experimented with changing the range for the 1890 shares, but this had little effect on the results.
Results of this exercise are reported in Table 8 and give little support to a ‘median voter’ effect. For the tax gap, the coefficient on the third curia is slightly larger for the contestable districts, but the additional effect is not statistically significant. In contrast, the spending models show no ‘reinforcement’ of the direct curia effects and even an offsetting interaction for total expenditures in 1903.Footnote 90 Experiments with other definitions of ‘swing vote’, with non-linear terms, or with more flexible forms of ‘contestability’ produced no other signs of non-linear effects of third curia representation.Footnote 91 Therefore with the results of Tables 4–6 and evidence of some third curia ‘effect’ outside the ‘peasant zemstva’ districts, understanding the underlying mechanisms for these findings requires a more detailed examination of what drove the variation in the curiae shares under the original law and the 1890 reform.
Were the effects different in more ‘contestable’ districts?

Note: ***p < 0.01, **p < 0.05, *p < 0.1. The models are the same as in Table 7 (with the same covariates), although the ‘peasant zemstva’ observations are not dropped here.
3.4. Understanding the variation in peasant zemstvo representation
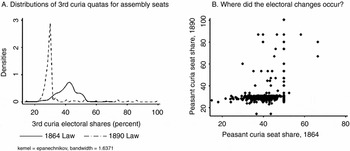
Section 2 noted that reformers used population, landholdings and economic ‘interest’ as criteria in allocating district zemstvo assembly seats among the different curiae. But despite some proposed rules of thumb, there were apparently no exact functions mapping district characteristics into representation for either the 1864 or 1890 laws. It is clear that the means in Table 3a hide substantial variation: the standard deviation of the third curia was 6.7 under the 1864 law and 12.2 under the 1890 law. Panel A of Figure 2 plots the densities of the two third curia seat distributions. While the 1864 density is distributed normally around the mean of 41 percent, the 1890 density is tight around one-third of the seats, with only a small number of districts scattered above that norm. However, the 1890 third curia shares are more highly correlated with the peasantry's population share than are the 1864 shares (see Table 3a).Footnote 92 The two third curia seat shares are positively correlated (coefficient of 0.34), which implies that some underlying factors continued to influence the setting of the curia seats.
The change in zemstvo assembly seats, 1864 vs 1890

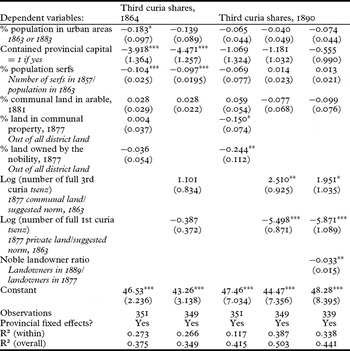
The Minister of the Interior, P. A. Valuev, in his proposal for the 1864 statutes, provided explicit amounts (tsenzi) of communal or private land that were intended to correspond to one first or third curia seat in each district. These guidelines were formulated amidst fears of former serf unrest but with a stated goal to match representation to economic ‘interests’ in local affairs. Reflecting this idea, I can ‘predict’ the assigned share of assembly seats in 1864 based on information known at the time: the land tsenzi, the portion of the population who were serfs, and the urban share of the population.Footnote 93 As the basic allocation of property was defined in the emancipation settlements, I also include the shares of communal and noble-owned land in 1877 in some specifications. The first two columns of Table 9 present results from a linear regression model of the 1864 share of third curia assembly seats using these variables.Footnote 94
Determinants of district Zemstvo third curia assembly seat quotas

Note: ***p < 0.01, **p < 0.05, *p < 0.1. The regressions are OLS with provincial fixed effects and robust and clustered (by province) standard errors. The dependent variables are the share of district zemstvo assembly seats allocated to the third curia under the two laws (defined in percentage points, as the other percentage variables are here). The number of curia tsenz refers to the sum of land owned communally or privately (in 1877, when such data are available – see Table A1), divided by the amount of land corresponding to one assembly seat for that curia according to zemstvo reform proposal of P. A. Valuev (see Russia, Khoziaistvennyi, Materialy, vol. 2, 1886, pp. 67–80). Before taking the logs of these two variables, I add 0.1 to deal with the log of zero problem (affecting three observations – the results are unchanged). The ‘Noble landowner ratio’ takes the number of landowning nobility eligible to vote in zemstvo primaries in 1889 (before the 1890 reform) and divides it by the number of landowning nobility in 1877. This 1889 number is taken from Russia, Tsentral'nyi, Statisticheskiia (1889). Ten districts have missing data from 1889. The other variables are summarized and sourced in the Appendix.
As would be expected, the urban population share in 1863 and a dummy for whether the provincial capital was in a district were negatively associated with the share of third curia seats in 1864.Footnote 95 In apparent reaction to fears of peasant unrest, less representation was granted in districts where serfdom had been more prominent.Footnote 96 The land ownership and tsenzi coefficients have the expected signs – positive for peasant land/third curia and negative for noble landownership/first curia – but somewhat surprisingly, these results are not statistically significant. Although Valuev was the central figure in zemstvo reform, the State Council did not rely exclusively on his input in finalizing the details of the curia system, and there remains a substantial unexplained component to the variation in the third curia's share of assembly seats under the 1864 law.Footnote 97
Behind the conservative shift of the 1890 reform was a concern that merchants, peasants and other non-gentry property holders were increasingly dominating the first and second curiae. Not only was peasant participation in the first two curiae effectively ended, but the third curia's share of assembly seats was reduced across the distribution under the 1864 law (panel B of Figure 2). Most of the districts that retained substantial third curia shares were located in the peasant zemstvo provinces.Footnote 98 To explore the factors behind the adjusted distributions, I utilize data available to policymakers in the 1880s to estimate models of the 1890 statute curia share. The other three columns of Table 9 present these results.
While the portion of serfs and the urban variables are no longer strongly correlated with the third curia share, other results stand out. In column 3, both the communal and noble landownership variables were negatively related to the third curia seat share, implying that the 1890 reform shifted electoral weight away from the peasantry in districts where there was less vacant or state-owned land. At the same time, columns 4 and 5 show that the coefficients on each of the tsenz variables now have the expected signs and are statistically significant.Footnote 99 Finally, the last model of Table 9 also includes the ratio of the number of noble landowners in 1889 that fulfilled the 1864 tsenz to the total number of noble landowners in 1877.Footnote 100 This variable captures the evolution of the noble landed electorate. If the changes wrought by the reform were driven by the declining electoral power of the nobility in particular zemstva, then we would expect the coefficient on this variable to be positive. However, a large noble electorate relative to the total landowning nobility twelve years earlier was negatively related to the 1890 third curia share of assembly seats. Again, the reform reinforced existing electoral variation – the districts that retained a large number of third curia assemblymen were those that always had relatively few land-owning nobility.
3.5. Extensions to the baseline models: the underlying mechanisms
According to one prominent scholar, the assignment of third curia electoral shares under the 1890 law was largely ‘arbitrary’.Footnote 101 However, the stated intent of policymakers at the time, along with the findings in Table 9, suggests that both the 1864 and the 1890 distributions of third curia seat shares were related to the underlying property and population structures. As such, the results in Tables 4–8 may possibly be biased. To understand what the underlying endogeneity might look like, and what the third curia coefficients represent, I turn to several more extensions of the basic expenditure model.
One way to address this issue would be through an instrumental variable framework. Unfortunately, none of the variables in Table 9 that were correlated with the third curia assembly shares can be plausibly excluded from any second-stage regression. For example, the tsenzi and the share of serfs were probably functions of underlying conditions that directly influenced zemstvo spending. Although, these ‘pre-determined’ variables generate insignificant coefficients when entered directly in the models of Tables 6–8, the curia share 1903 coefficients are not very different between the OLS models and various IV specifications.Footnote 102 The difficulties of identifying the exogenous effect of the third curia share leads me to employ an indirect approach to better understand which types of districts exhibited especially strong correlations.
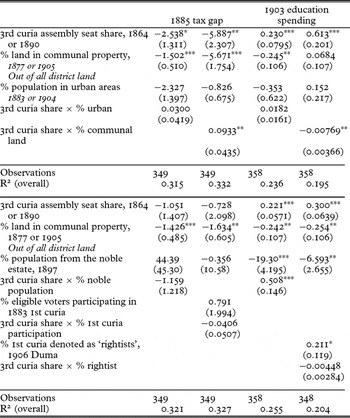
Table 10 reports models that extend those considered earlier by interacting the third curia share with various characteristics of the districts. To keep things manageable, I only report models of the 1885 tax gap and 1903 education expenditures and only four of the interactions explored.Footnote 103 A number of findings stand out. More urban areas displayed no differential effects – the third curia coefficients were identical to the non-interacted models and the interaction coefficients were close to zero. Also, the negative association between the share of communal land and education spending in 1903 was primarily located in districts with high third curia shares.
Where were the third curia ‘effects’ located?

Note: ***p < 0.01, **p < 0.05, *p < 0.1. These models also include all the same variables as those in Table 7.
Models that include proxies of the political preferences of the first curia electorate have important implications for how the third curia effect may be interpreted. The specifications in the bottom portion of Table 10 include three such proxies: the participation rate of the first curia electorate in the election of 1883, the share of ‘rightist’ noble representatives to assemblies that elected members of the 1906 Duma (Russia's first nationally representative political body), and the share of the population in the noble class in 1897.Footnote 104 After controlling for the share of the land owned by the nobility, the urban share of the population, and whether the district contained the provincial capital (all included in the models of Table 10), higher values of the population share of the nobility were indicative of a larger number of nobles with small landholdings. By 1900, many such landholders had only recently entered the nobility through service in the military or in the expanding central bureaucracy. According to Manning (Reference Manning1982) and others, it was precisely this ‘new’ nobility who formed the basis of what came to be known as the zemstvo liberal movement, who opposed the more conservative hereditary gentry in many assembly meetings.
Neither participation by the first curia in the 1883 elections, nor the share of ‘rightists’ in the Duma primary meetings, were associated with differential ‘effects’ of third curia representation. Somewhat surprisingly, the ‘rightist’ variable was positively correlated with educational expenditures, although such districts may have had more liberal elements elected from other electoral curiae. Most strikingly, the interaction between the third curia variable and the population share of the nobility generated a large, positive and statistically significant coefficient in the educational spending model (and a negative but not statistically significant coefficient in the tax gap model).Footnote 105 This finding is only present in the post-1890 models and suggests that part of the ‘effect’ of peasant representation on educational spending originated with a group of ‘new’ gentry that defended zemstvo activities in the face of conservative opposition among much of the landed nobility.Footnote 106 With the reduced political positions of the peasantry after 1890, this is consistent with the interpretations of Veselovskii, Manning and others regarding the liberal ‘middling’ gentry.
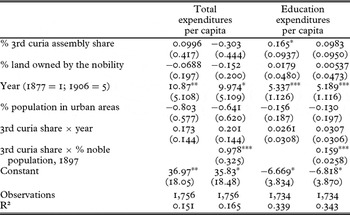
The models of Table 10 continue to show direct effects of third curia representation on zemstvo policymaking. While the share of the population that was in the noble estate is an imperfect proxy for the presence of a liberal group of gentry, the direct curia effect may still be picking up other unobserved factors. As a final strategy to address this possibility, I take advantage of the multiple years of spending data to control for the fixed (over time) part of the unobservable determinants of zemstvo policymaking that may be correlated with the peasant curia share. To do this, I introduce district-level fixed effects into equation 1 and merge the five years of expenditure data to create a panel dataset. I then estimate the following model, where the other controls are subsumed into theXit vector:

Here, t is the year, the λt is a time trend variable (from 1 in 1877 to 5 in 1906), and the pd are district effects. This model relies on the change in the third curia's share between the two laws. Unfortunately, most covariates cannot be matched to all cross-sections. I do include the urban population share and match the 1877 noble land shares to 1877 and 1883 and the 1905 shares to 1896, 1903 and 1906.Footnote 107
Table 11 presents results from estimating this specification for per capita total and education expenditures. The noble land and urban population shares were unrelated to spending per capita in these models. The positive coefficient on the ‘year’ variable reflects the growth in expenditures over time. While the direct effect of the third curia share on total expenditures was essentially zero for total expenditures, there was a small positive correlation for education expenditures. Moreover, for both total and education expenditures, there was a strong interaction effect with the share of the population that was noble in 1897. Again, although the noble share variable is an imperfect proxy, this result lends additional support to the zemstvo liberalism interpretation.Footnote 108
Full panel model, 1877–1906

Note: ***p < 0.01, **p < 0.05, *p < 0.1. These OLS models with district-level fixed effects include data from 1877, 1883, 1896, 1903 and 1906 (both spending and population totals). The urban share and year variables are defined for each year. The 1864 third curia and 1877 noble landownership variables are both applied to 1877 and 1883, while the 1890 shares and 1905 noble landownership variables are applied to 1896, 1903 and 1906. Robust and clustered (by district) standard errors are in parentheses. The variables are defined in the text and the Appendix.
3.6. Interpreting the findings: do the results mean that the zemstva were democratic?
The findings in Tables 4–11 show that zemstvo policies varied according to local characteristics. Rather than budgets simply being a random (or completely rent-seeking) set of revenues or allocation of funds, the institution generated goods and services that catered to the predominantly rural and peasant population, at least to some degree. This was true despite the layers of elections and bureaucracy between peasants and assemblymen, the biased allocation of representation, the ‘tyranny of the majority’ that may have reigned in the assemblies, and external interference in what the zemstvo did.
Peasants most likely benefited more than other groups from the spending undertaken by the zemstvo, and third curia representatives may have been able to give some political voice to these demands, especially in the so-called ‘peasant zemstva’. But it appears likely that the help of at least some sympathetic gentry was critical. Given the liberal and conservative blocks that emerged within the first curia, the existence of an extra third curia representative may have pushed policy in a direction more favorable to the peasantry, either by contributing votes or by simply giving voice to their needs.Footnote 109 This possibility does not preclude the opposite – areas with more nobles may have seen more rent-seeking through the zemstvo budget process.
The peasantry themselves were certainly a heterogeneous group. It is likely that the elite, politically connected peasants were precisely the ones able and willing to participate in the zemstvo. They may have had different policy preferences than the median peasant. Moreover, this article does not pretend to argue that there was no waste, graft or inefficient targeting of zemstvo spending. But overall, more peasant involvement in the assemblies was associated with policies that favored the peasantry on the margin.Footnote 110 If this was the case, then the empirical findings presented in this article may be cautiously employed to describe the zemstvo as democratic, albeit a very limited democracy that was rigged in favor of a (heterogeneous and gentry) elite.
4. Concluding thoughts and future extensions
At noon on 23 October 1883, zemstvo assembly chairman and marshal of the nobility A. P. Fedorov and 31 assemblymen filed into the Ardatov district courtroom in Simbirsk province. After meeting for three days, they were ready to hear final reports on issues ranging from the ongoing construction of a village school to the zemstvo's activities in road maintenance over the past year. After approving the proposed budget for 1884, the assembly voted on several elected positions. These included a new executive board, zemstvo representatives to the district school council, and nine members of the provincial zemstvo assembly. After voting, almost all of the newly elected members of the zemstvo administration were from the landed gentry, but at least one – Filipp Mikhailovich Mikhailov – was a peasant, and he was elected as executive board chairman. Filipp Mikhailovich's rise within the zemstvo was indicative of the expanding – albeit still limited – possibilities for the peasantry in the new institution. Did his achievement or the presence of other peasants in the assembly affect how policy was conducted, especially given the first curia's voting strength in the Ardatov zemstvo?Footnote 111 Although we do not have the answer for this particular zemstvo, this article has addressed such questions through a detailed examination of the structure of this institution and an empirical analysis of zemstvo budgets.
The story emphasized here is one that involves local self-government and a form of decentralized decision-making over public revenues and expenditures. Not only was the zemstvo extensively involved in providing local public services – from schooling and medical care, to agronomy and road maintenance – but it was an arena where the newly emancipated peasantry could, in theory, give voice to their concerns. I present evidence that peasant electoral power in the zemstvo was positively associated with relative tax rates (shifting the burden in the peasantry's favor) and spending per capita, especially on education – which was the category of expenditures most attractive to the peasantry.Footnote 112 Under the rule of majority voting, it is unlikely that adding an additional peasant representative to a minority position would have directly influenced policy through a median voter mechanism. The effects I do observe are stronger after peasant political rights were restricted in 1890, and they were more prominent in areas with absolute peasant majorities or in districts where the nobility comprised a larger share of the population. In most districts, peasant political voice was restricted and probably had only indirect effects on policy through its influence on receptive members of the local gentry majority. These findings are consistent with a historical literature that views an emerging group of liberal gentry as a key to the expansion of zemstvo activities from 1890 onwards.
This study is a useful complement to recent works on political representation and local public goods in India and other modern developing societies. However, there remain a number of issues that must be addressed to develop a better understanding of the zemstvo. To better identify the causal mechanisms at work, it is necessary to conduct additional research on exactly what determined the assignment of assembly seat shares and how assemblymen could actually affect zemstvo budget and program decisions. Ongoing study of zemstvo meeting minutes and budget records in Nizhnii Novgorod province aims to develop a more nuanced picture of internal debates and policymaking within the institution. Such an effort is necessary to uncover the heterogeneity of interests within the different curiae. Finally, it is worth noting that the long-run objective of this research program is to look at the impact of the zemstvo on Russian economic development. The aggregate evidence points to the important effects of this institution in terms of public goods and services, even if the underlying political structure was less than democratic. With additional data, it is possible to investigate whether zemstvo expenditures had a measureable impact on the rural population. For example, ongoing research has begun to compare educational outcomes between zemstvo and non-zemstvo districts and finds that the new institution did appear to deliver faster growth in the supply of primary schooling to the local population.Footnote 113
Despite remaining uncertainty about the relationship between political structure and budgetary outcomes, it is clear that the zemstvo was a new type of electoral institution in what was perhaps the quintessential absolutist state of the nineteenth century. Prior to 1864, there was a tradition of elected self-government among peasants, urban classes and the nobility. However, these bodies catered exclusively to their respective social estates, collected little in the way of revenues and funneled few resources towards public goods and services. The zemstvo was a key component of a new local public sector after the Great Reforms, and its electoral structure served as a model for Russia's first parliament – the Duma – in 1905. Economic historians have yet to fully unravel the implications of these and other political institutions for economic growth in the late Tsarist period. Doing so will contribute towards a growing literature on the political economy of development and improve our understanding of the origins of the Russian Revolution of 1917.
Acknowledgements
I would like to thank the attendees at numerous seminars and conferences for helpful comments. Tim Guinnane, Jean-Laurent Rosenthal, Dan Bogart, Tracy Dennison, Latika Chaudhary, Ran Abramitsky, Cormac Ó Gráda and two anonymous referees offered insightful suggestions. Toni Kraeva and Gean Spector provided excellent research assistance. The staffs of over a dozen libraries in the United States, United Kingdom, Finland, and Russia were extraordinarily helpful, as were the archivists in the Central Archive of Nizhegorod Oblast’. Support and funding for this research was generously provided by Williams College, Caltech, the Kennan Institute at the Woodrow Wilson International Center for Scholars, and the National Science Foundation (SES - 0922531). Any remaining errors are my own.
Appendix
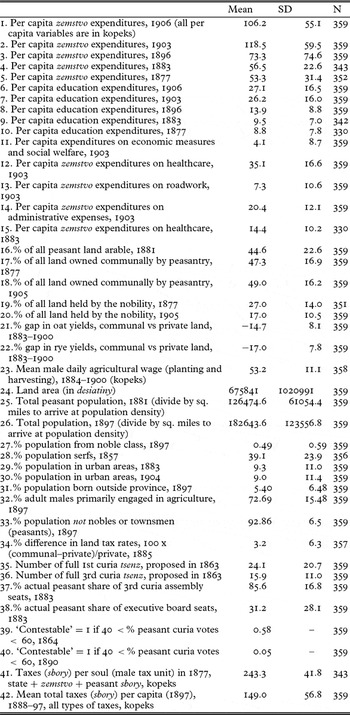
Summary statistics for district (uezd)-level data

Sources and notes: Numerators for budget variables from 1903 and 1906 are from Russia, Statisticheskoe, Dokhody (1908-15); for 1877 are from Veselovskii (1909–11, vol. 1 [appendix]); for 1883 are from Russia, Tsentral'nyi, Dokhody (1886); and for 1896 are from Russia, Tsentral'nyi, Zemskie (1896). Land variables for both 1877 and 1905 are derived from Russia, Tsentral'nyi, Statistika (1906) and Ershov (Reference Ershov1886). Variables 21, 22 and 23 are from Russia, Ministerstvo, Svod statisticheskikh (1902). Variables 16, 24 and 25 are from Russia, Tsentral'nyi, Mirskie (1886). Variable 28 is taken from Troinitskii (Reference Troinitskii and Herman1982), while 35 and 36 are derived from information reported in Russia, Khoziaistvennyi, Materialy, vol. 2 (1886). Variables 39 and 40 are defined from the information summarized in Table 3; number 34 comes from Skalon (Reference Skalon1888); and 37 and 38 come from Syrnev (Reference Syrnev1888). 1897 variables are derived from the 1897 census data in Troinitskii (Reference Troinitskii1905). ‘Portion’ or ‘Share’ indicates that the variable is a percentage (41 = 41%). Variable 41 is taken from Russia, Kommissiia, Priamye (1879), while 42 is provided in Russia, Department, Svod (1902). 1877 expenditures per capita draw on 1881 population numbers (available upon request), while the 1903 expenditures per capita rely on the 1897 national census numbers. Note that information on zemstvo expenditures in 1883, 1896, 1901 and 1906 and several other variables relevant for those years are also available in the data set and were utilized in the panel specifications. These variables are summarized in footnotes accompanying the text. Information and sources of other variables mentioned in the text are available upon request.