INTRODUCTION
The archaeological record shows that Clovis groups at least occasionally killed or scavenged now-extinct Pleistocene megafauna. These species play an important role in the traditional interpretation of Clovis foragers as highly mobile big game specialists (Kelly and Todd, Reference Kelly and Todd1988). However, the discovery of new sites and new interpretations of old evidence have questioned this original interpretation and ignited debate. The frequency of megafauna hunting by Clovis has implications for multiple aspects of Pleistocene life, including subsistence (e.g., Waguespack and Surovell, Reference Waguespack and Surovell2003; Cannon and Meltzer, Reference Cannon and Meltzer2004), the human role in megafaunal extinctions (Martin, Reference Martin, Martin and Wright1967), division of labor (Waguespack, Reference Waguespack2005), and human motivations for large game hunting, whether economic or social (Byers and Ugan, Reference Byers and Ugan2005; Lupo and Schmitt, Reference Lupo and Schmitt2016). One frequent challenge to the Clovis subsistence specialist and overkill hypothesis is the low frequency of sites with strong evidence for megafauna butchery (e.g., Haynes and Stanford, Reference Haynes and Stanford1984; Meltzer, Reference Meltzer1986; Grayson, Reference Grayson2001; Grayson and Meltzer, Reference Grayson and Meltzer2002, Reference Grayson and Meltzer2003, Reference Grayson and Meltzer2015; Wroe et al., Reference Wroe, Field, Fullagar and Jermin2004). However, others have proposed the number of observed butchery sites is reasonable given the relatively short time span and taphonomic biases (Surovell and Waguespack, Reference Surovell and Waguespack2008; Surovell and Grund, Reference Surovell and Grund2012; Wolfe and Broughton, Reference Wolfe and Broughton2020).
A recent reevaluation of the record of human hunting of extinct megafauna only accepted a butchery site if “evidence for the association between artifacts and extinct mammal remains supported not just the contemporaneity of the two, but was also sufficient to document that people were involved in the demise of the animal” (Grayson and Meltzer, Reference Grayson and Meltzer2015, p. 177). In other words, spatial association of archaeology with megafaunal remains is not enough to conclude cultural utilization. Using these criteria, only 15 of more than 75 proposed sites are widely accepted as megafaunal butchery sites (Grayson and Meltzer, Reference Grayson and Meltzer2002, Reference Grayson and Meltzer2015).
Proboscideans (Mammuthus, Mammut, and Cuvieronius) are particularly important in the Pleistocene megafauna hunting record, as these genera are found at 14 of the 15 widely accepted sites (Grayson and Meltzer, Reference Grayson and Meltzer2015). In the absence of lithic artifacts, bone breakage or disarticulation are used as indicators of cultural association in some of the proposed sites (e.g., Carlson and Steele, Reference Carlson, Steele, Fox, Smith and Wilkins1992; Holen, Reference Holen2006). However, lithic artifacts occur with proboscidean remains in at least 31 questionable sites (Table 1). While these 31 sites do not pass the confirmation criteria, most cannot be ruled out as cultural associations either. At least three offer convincing evidence of coincidental association—the Trappey, Huntington, and Richmond sites, which have point types that postdate the Early Paleoindian period. This leaves 28 sites of questionable association. In this analysis, we take a quantitative approach to assessing the nature of associations and ask how many could have occurred by chance alone given what is known about the geographic distributions and densities of Clovis and proboscidean sites.
Cases of spatial association between artifacts and proboscideans at sites not widely accepted as proboscidean kill/butchery sites.

Using the observed record of Clovis and proboscidean sites and knowledge of land-use behavior, we approach the question of coincidental artifact association with megafaunal remains by simulation. The simulations use empirically informed densities and sizes of Clovis and proboscidean sites in concert with water-tethering behavior to estimate how many coincidental spatial associations we should expect in the archaeological record. This null model is compared to the observed archaeological and paleontological record of known associations to evaluate the probability of observing the 31 coincidental associations that are currently not considered cultural.
MATERIALS AND METHODS
Multiple previous studies have used computer simulations to analyze Pleistocene megafauna extinction, with an emphasis on assessing the overkill hypothesis (e.g., Alroy, Reference Alroy2001; Prescott et al., Reference Prescott, Williams, Balmford, Green and Manica2012; Lima Riebeiro et al., Reference Lima-Ribeiro and Felizola Diniz-Filho2013; Zuo et al., Reference Zuo, Smith and Charnov2013; for review, see Yule et al., Reference Yule, Fournier, Jensen and Yang2014). These simulations explored the timing, spatial distributions, or human population size required to cause megafauna extinction. Here, modeling is used for a different purpose—to create a null model of incidental spatial association between artifacts and remains of now-extinct megafauna.
Our analysis follows six major steps: (1) generate a sample of Clovis and proboscidean sites of empirically informed sizes, (2) model a site probability landscape that accounts for water-tethering behavior, (3) place the sites on the model landscape at an empirically informed geographic density, (4) identify and tally geographic overlap between proboscidean and Clovis sites, (5) repeat the procedure many times, and (6) use the theoretical coincidence frequencies to estimate how many of the 31 empirical associations in North America are likely to be coincidental (Table 2). In addition to assuming water-tethered use of North American landscapes, we also compare the empirically observed record to a second, simpler model that assumes uniformly random spatial distributions to estimate coincidental associations. We describe the finer points of each step, including sampling procedure and parameterization, here and present our code in Supplementary Material 1.
Pseudocode for simulating and counting coincidental associations between archaeological and paleontological proboscidean sites.

Clovis site density
In discussions of continental trends in the Clovis record, the focus is usually on a limited number of sites classified as “Classic Clovis” based on their large assemblages, secure dating, or significant artifacts (Waters and Stafford, Reference Waters and Stafford2007; Miller et al., Reference Miller, Holliday, Bright, Graf, Ketron and Waters2014). In contrast, our simulations require an overall density that represents the sum of all discovered Clovis localities. This is a challenging number to estimate because of inconsistencies in projectile point classification, difficulties with dating Clovis sites in the absence of clear temporal diagnostics, and the rarity of terminal Pleistocene sites compared to the more abundant recent archaeological record. It is further complicated by the fact that many possible Clovis sites are only documented in the gray literature or have never been formally reported. Fortunately, several formal surveys of state archaeological databases have systematically searched and evaluated all possible Early Paleoindian sites. Archaeological database searches have been published for Wyoming, New Mexico (Mullen, Reference Mullen2008), Texas (Bever and Meltzer, Reference Bever and Meltzer2007), and Illinois (Loebel, Reference Loebel2012). While the surveys in Wyoming, New Mexico, and Texas show low densities of sites (approximately one site per 10,000 km2), the Illinois survey shows high densities, with approximately one site per 1000 km2 (Fig. 1, Supplementary Table 1).
Density of Clovis points (n = 31) and Clovis sites (n = 14) by state per 1000 km2.

Densities for 10 additional states were compiled using state-specific fluted-point surveys available through the Paleoindian Database of the Americas (PIDBA; http://pidba.utk.edu; Anderson et al., Reference Anderson, Shane Miller, Yerka, Christopher Gillam, Johanson, Anderson, Goodyear and Smallwood2010, Reference Mackie, Surovell, O'Brien, Kelly, Pelton, Haynes and Frison2019). These point surveys were selected because they contain projectile points that are classified into diagnostic categories (e.g., Clovis, Folsom, Gainey) and include site-level provenience. For each state, we identified the projectile points classified as Clovis, or possibly Clovis, and counted the total number of unique sites that contained these diagnostics. Points with only county or regional geographic provenience were not included in this analysis. Admittedly, isolated Clovis artifacts located on later occupations could be counted or sites not included in the database could be missed, but we assume such errors are minimal, and that the data offer a reasonable approximation of the number of localities containing Clovis diagnostics. For all density variables, site counts were converted to densities using a state's total land area excluding perennial water sources (United States Census Bureau, 2018). While this could underestimate the areal extent of water sources in the Pleistocene, which was generally a wetter period than today, we assume any resultant decrease in calculated site density would be negligible relative to the total landmass under consideration.
We found that Clovis site densities from 14 states range from 0.08 to 2.38 sites per 1000 km2 (Fig. 1). The maximum Clovis site density recorded is based on the presence of Clovis points at 12 sites in Delaware. The modeled mean density of 0.67 sites per 1000 km2 is used for the Clovis site density in our simulations.
Clovis isolate density
Current site density estimates do not integrate isolated artifacts because of archaeological site recording conventions, which make a distinction between sites and isolated artifacts. Yet isolates are crucial for our analysis given the possibility that an isolated Clovis artifact could coincidentally fall within the boundaries of a proboscidean site, leading to a coincidental association. To establish the density of Clovis isolates we again turned to PIDBA and various regional surveys. Archaeologists have compiled and analyzed fluted-point distributions to evaluate patterns of Paleoindian land use and demography (e.g., Anderson and Fought, Reference Anderson and Faught1998; Blackmar, Reference Blackmar2001; Taylor, Reference Taylor2003; Bever and Meltzer, Reference Bever and Meltzer2007; Anderson et al., Reference Anderson, Echeverry, Shane Miller, White, Yerka, Kansa, Kansa, Thulman and Garrison2019). PIDBA provides counts of Paleoindian projectile points for North America, with point frequencies totaled for all counties in the United States. The quality of reporting varies, with the most comprehensive records in the eastern states. PIDBA, along with regional surveys (e.g., Bever and Meltzer, Reference Bever and Meltzer2007; Asher, Reference Asher2016), currently form the best summaries of Clovis point densities. While there are inherent biases in PIDBA related to inconsistent reporting, lack of standardization, population density, extent of agricultural development, and differential intensity of research (Anderson and Fought, Reference Anderson and Faught1998; Shott, Reference Shott2002; Prasciunas, Reference Prasciunas2011), it is widely used as an indicator of general trends in point frequencies for large-scale analyses. Moreover, those biases pertain to questions about systemic processes that would allow estimates of, for example, Clovis population densities and mobility patterns. Our purpose is less concerned with systemic behaviors per se and more concerned with archaeological outcomes that are the result of both systemic and postdepositional processes, including all of their biases (Schiffer, Reference Schiffer1987). In other words, the archaeological record is what conditions the chance associations of interest to this analysis.
To establish reasonable ranges of Clovis isolate densities, counts were compiled from PIDBA and various regional surveys of Early Paleoindian projectile point databases (e.g., Bever and Meltzer, Reference Bever and Meltzer2007; Asher, Reference Asher2016). Only overall quantities of points per state were used, and no attempt was made to separate points based on the context of their discovery. Since some of the points likely came from sites where multiple points were present, this could spuriously inflate isolate density, thereby increasing the chance of an association in the simulations. We assume that such effects are likely minimal. If counts for the same state differed between sources, the highest count was used. States that had no Clovis points recorded in PIDBA (n = 17) were excluded.
Of the 31 states with reported Clovis points, densities vary from well under one point to more than six points per 1000 km2 (Fig. 1, Supplementary Table 2). Based on the mean of 31 states, isolate density is set to 1.25 points per 1000 km2.
Clovis site size
Ethnographic and archaeological research has shown that many factors influence hunter-gatherer site size, including reoccupation, length of occupation, available area, and occupation group size (Surovell, Reference Surovell2009; Hamilton et al., Reference Hamilton, Buchanan and Walker2018; Haas and Kuhn, Reference Haas and Kuhn2019). Additionally, errors during measurement due to amorphous site shape, postdepositional disturbances, and the subjective nature of defining site area can affect site-size estimation. Regardless, recent analysis has identified statistical regularities in the archaeological outcome of hunter-gatherer site sizes. Haas and colleagues (Haas et al., Reference Haas, Klink, Maggard and Aldenderfer2015; Haas and Kuhn, Reference Haas and Kuhn2019) observed that site size from seven different hunter-gatherer settlement systems in North and South America followed a heavy-tailed distribution. In other words, small sites are extremely frequent, and extremely large sites are rare. Two types of continuous statistical distributions—log normal and exponential—characterize variation in the areal extents of hunter-gatherer sites remarkably well. Assuming the factors that contribute to site area (group size, nonoverlap between occupations, and dispersion of materials) randomly contribute to area variation, a lognormal distribution offers a theoretically reasonable model of site-area variation (Mitzenmacher, Reference Mitzenmacher2004; Haas et al., Reference Haas, Klink, Maggard and Aldenderfer2015).
In order to model site size, we fit a lognormal distribution to archaeologically observed site sizes from 28 well-documented Clovis sites (Fig. 2, Supplementary Table 3). Since these areal extents are meant to replicate the entire Clovis record irrespective of site type, campsites, kill/scavenges, and workshops were included. If the site size was reported by investigators, that value was used. Otherwise, areal extent was derived using the method outlined by Andrews et al. (Reference Andrews, LaBelle and Seebach2008), which estimates an area using the smallest rectangular area that encompasses all Clovis-aged artifact clusters, excavation units, and trenches. This method systematically overestimates site extent, but minimally so, and provides a standardized way to establish site area across diverse studies. Since overestimation of site size increases the chance of coincidental spatial association, any effect makes a chance association more likely. A lognormal model with a mean log of 9.44 m2 (12,700 m2) and a log standard deviation of 2.14 m2 produced the best fit to the archaeological data by maximum likelihood estimation (Fig. 2, Supplementary Table 3). It also offered a statistically plausible fit to the Clovis dataset (Kolmogorov-Smirnov D = 0.10, p = 0.89), suggesting that the statistical model offers a reasonable approximation of Clovis site-size variation.
(color online) Raw and logged Clovis areal extent (n = 27) with best-fit line of lognormal distribution.

Proboscidean site density
A recent survey of proboscidean remains from the mid-continent has produced one of the most comprehensive records of proboscidean death sites in the American Midwest, a region known for high densities of proboscideans (Widga et al., Reference Widga, Lengyel, Saunders, Hodgins, Walker and Wanamaker2017). The study encompassed portions of 12 states and identified 627 proboscidean localities that were dominated by the American Mastodon (Mammut americanum) and mammoth (Mammuthus sp.) remains, although a few localities contained other older proboscidean taxa (Wigda et al., Reference Widga, Lengyel, Saunders, Hodgins, Walker and Wanamaker2017). While most localities only contained teeth (n = 401, 61%), 101 (15%) consisted of partial or complete skeletons. Of the 93 reported dates from this collection, 56% (n = 53) have an age younger than 15,000 cal yr BP. To establish a density of proboscidean sites, we measured the total area encompassing the localities (1,476,754 km2), resulting in a density of 0.42 proboscideans per 1000 km2. While this density may be inflated compared to other portions of the continent due to the high frequency of proboscidean sites in the region, it is one of the only systematic attempts to identify proboscidean localities over a large area; it therefore offers the most complete account of the total number of proboscidean sites compared to other paleontological compilations. All proboscidean sites, regardless of age, were used to calculate densities because proboscidean remains from any period can become coincidentally associated with archaeology. For the simulations, we chose to round up proboscidean density (0.67 sites per 1000 km2) to account for any possible underrepresentation in the observed record and to guard against underestimation of coincidental associations. This should only increase the potential for chance associations.
Proboscidean site size
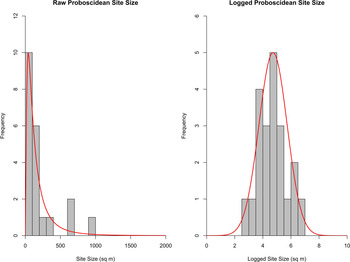
Finally, proboscidean site size identifies the potential area for artifact association, making it particularly influential for association rates of Clovis isolates. The areal extent of excavations at 22 proboscidean sites was measured (Fig. 3, Supplementary Table 4). Accepted and proposed butchery sites, as well as natural death sites, were included in order to replicate the excavation styles of archaeologists, paleontologists, and avocationalists. Since artifact discoveries are generally limited to excavated portions of sites, the excavated area immediately surrounding the proboscidean remains was used to identify site extent. If the total area of the immediate excavation area was reported or could be calculated from a published figure, that was used. Sites with poorly defined or irregular excavation blocks were measured using the same method outlined for determining Clovis site size (Andrews et al., Reference Andrews, LaBelle and Seebach2008). Excavation areas varied in size from 20 m2 to more than 950 m2 (Fig. 3). As in our approach to modeling Clovis site-size variation, a maximum likelihood estimation was used to fit a lognormal distribution to the proboscidean site-size data, resulting in a log mean of 4.73 m2 (113 m2) and a log standard deviation of 1.00 m2 (Fig. 3). The modeled site-size distribution was statistically consistent with the empirical site sizes (Kolmogorov-Smirnov, D = 0.14, p = 0.78), suggesting that the statistical model offers a reasonable approximation of Clovis site-size variation.
(color online) Raw and logged proboscidean site areal extent (n = 21) with best-fit line of lognormal distribution.

Site placement with water tethering
One approach to modeling a coincidental spatial association might be to randomly distribute sites on a virtual landscape, and we did explore this approach. However, such a uniform random distribution fails to capture land-use biases that can affect geographic co-occurrence. Perhaps the most important factor biasing both proboscidean and human land-use patterns is water. Both species are obligate drinkers, requiring nearly daily access to water (Packer Reference Packer2002; Institute of Medicine 2004, pp. 73–185). Observations of modern mass African elephant (Loxodonta africana) die-offs have shown that remains are rarely found more than 6–8 km from water sources (Corfield, Reference Corfield1973; Haynes, Reference Haynes1988; Haynes and Klimowicz, Reference Haynes and Klimowicz2015). We might therefore expect geographic tethering to water sources to inflate coincidental co-occurrence of proboscidean and human sites.
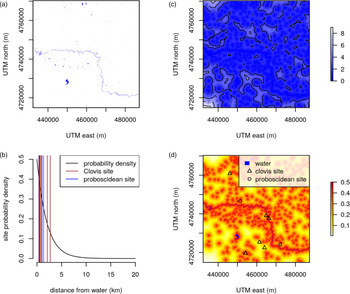
To model the effects of water tethering on the geographic distribution of paleontological and archaeological sites in Pleistocene North America, we first modeled the geographic distribution of water using an empirical global surface-water database compiled by Pekel et al. (Reference Pekel, Cottam, Gorelick and Belward2016). This high-resolution raster database is resolved to approximately 30 m, a resolution that approaches a behaviorally meaningful geographic scale (Fig. 4a). The exact resolution varies slightly by latitude. Despite this high resolution, the model cannot capture small seeps and springs and therefore tends to underestimate bioavailable surface water. Further, the database reflects contemporary conditions rather than the late Pleistocene conditions of interest, thus also leading to underestimation of surface water. To minimize these effects, we used the annual maximum water extent dataset. Together, these data limitations are likely to underestimate Pleistocene surface water, inflating the chances of spatial coincidence of proboscidean and human archaeological sites. Thus, the surface-water model is a liberal model for estimating the frequency of coincidental associations and a conservative model for estimating the frequency of systemic associations.
(color online) The water-tethering model used in one iteration of this analysis. (a) Surface-water model for a selected 3025-km2 area on the landscape. (b) A distance-from-water model derived from the surface-water model. (c) An exponential decay model for site occurrence relative to surface water, based on Corfield (Reference Corfield1973), which assumes that 95% of proboscidean and human sites will be within 6 km of water. (d) The distance-from-water model converted to a probability of occurrence surface using the exponential decay water-tether function. Simulated sites from one iteration are shown in (c) and (d).

Although the surface-water model allows us to identify prominent locations on proboscidean and human landscapes, it does not specify how tightly those species should adhere to those locations. Water is critical, but it must be balanced against access to other geographically dispersed resources. Following basic Poisson point-process dynamics (Tijms, Reference Tijms2003), we modeled water tethering as an exponential distance decay function such that the probability of finding a site is highest at the water source and decays with distance (Fig. 4b). To obtain an appropriate distance-decay rate, we solved for an exponent that ensures 95% of occurrences fall within 6 km from water, which is an approximation of Corfield's (Reference Corfield1973) and Haynes's (Reference Haynes1988) observations that African elephant remains are rarely found more than 6–8 km from water. We found that an exponential decay term of 0.5 meets this criterion. We assume the same decay function for humans, given that both elephants and humans have similar water requirements.
To place a given proboscidean or Clovis site on the simulated landscape, we created a Euclidean distance-to-water model from the surface-water model (Fig. 4c; Hijmans, Reference Hijmans2019), drew a distance from the exponential probability function (see Fig. 4b), and placed the site at the location on the distance-to-water raster nearest to the drawn distance (Fig. 4d). For example, to place a proboscidean site on the landscape, we might draw a distance of 150.24 m from the exponential probability function, locate the cell in the distance-to-water raster that has a value closest to 150.24 m, and place the site at that location. This procedure ensured that site placement was biased to water under realistic conditions of surface water geometry and water-tethering behavior.
Model parsing and iteration
Because of the continental geographic scale of our study and the high resolution of the surface-water dataset, it was computationally prohibitive to conduct our simulations for the entire study area all at once. We therefore parsed our analysis into 1000 smaller geographic units. To do this, 1000 random locations were selected from the study area, defined as the boundary of the coterminous United States. To minimize geographic bias in our selection, the study area was projected to the Albers equal-area conic projection. For each location, we selected a 55-x-55-km (3025 km2) area centered on the location and projected the sample area to the Universal Transverse Mercator (UTM) system. The UTM projection served to minimize geographic distance distortion. Once the 3025-km2 sample area was defined and projected, the corresponding surface-water raster was selected, projected to the corresponding UTM system, and cropped to the sample area. All geographic projections were performed in the R statistical computing environment (R Core Team 2020) using the packages Raster (Hijmans, Reference Hijmans2019), Geospatial Data Abstraction Library (Bivand et al., Reference Bivand, Keitt and Rowlingson2019a), Geometry Engine Open Source (Bivand et al., Reference Bivand, Pebesma and Gómez-Rubio2019b), and sp (Pebesma and Bivand, Reference Pebesma and Bivand2005; Bivand et al., Reference Bivand, Pebesma and Gómez-Rubio2013).
For each of the 1000 sample areas, two proboscidean sites, four isolated Clovis points, and two Clovis sites were placed on the landscape (Table 3). These counts reflect the densities deduced in our empirical analyses presented above. Each Clovis and proboscidean site was further assigned a size based on the lognormal statistical models derived from real-world areal extents, also presented above (Figs. 2 and 3). Clovis isolates were given an areal extent of 3.14 m2 (radius of 1 m), which approximates the spatial proximity that archaeologists would typically accept as a tentative spatial association between artifact pairs.
Site densities and frequencies per simulation.

Geographic associations between Clovis and proboscidean sites were tallied for the 1000 sample areas, which total approximately 3 million km2. To derive an expected coincidental association frequency for North America, that rate of occurrences was then projected to the size of habitable land in Pleistocene North America, which is estimated at 14 million km2. This estimate is based on the total area of North America (25 million km2) less an estimated areal extent of Pleistocene glaciers (10 million km2) and southern Mexico (1 million km2). Southern Mexico is excluded because of a general lack of Paleoindian research in that region. Finally, site-size assignment and coincidental frequency estimation were repeated 10,000 times to estimate error in the modeled association frequencies.
To assess the effects of water-tethering behavior, a second null model placed site locations randomly within each 3025-km2 simulation area. The same archaeological and paleontological densities were used—two proboscidean sites, four Clovis points, and two Clovis sites within each iteration—with site sizes dictated by the lognormal models created from real-world extents (Figs. 2 and 3). Associations between archaeological and paleontological sites were tallied for 100,000 iterations, which totaled 302 million km2.
RESULTS
Of the 20 million water-tethered proboscidean sites simulated (2000 sites simulated 10,000 times), 20,835 proboscidean sites (0.1%) were coincidentally associated with a Clovis archaeological site (Fig. 5). No Clovis isolates were found in association with a proboscidean site. Per 1000 sample areas, iterated 10,000 times, the number of associations varied from zero to seven, with a mode of two associations per 3.025 million km2 and 95% of the iterations producing one to three associations (Fig. 5). When this result is scaled to the size of North America, the modal expectation is nine coincidental associations, with 95% of simulations predicting 5–14 coincidental associations. Conversely, the results indicate that that 22 of the 31 sites are likely systemic (i.e., “real”) associations, with a 95% confidence interval of 17–26 systemic associations. In other words, fewer than 14 of the 31 empirically observed archaeological-proboscidean sites are coincidental. This frequency readily accounts for the three confirmed coincidental associations but suggests at least 11 additional coincidental associations. Conversely, at least 17 of the 31 archaeologically observed artifact-proboscidean sites are likely systemic.
Histogram of the number of coincidental associations for 10,000 iterations of the 1000 site locations expressed as both raw count of associations per iteration (3.025 million km2) and expected coincidental associations adjusted to the total area of Pleistocene North America (14 million km2).

The results from the water-tethered model can be compared to a second null model that randomly places sites on the landscape using the same archaeological and paleontological densities and site sizes. Of the 200,000 proboscidean sites simulated (two sites for 100,000 iterations), 19 proboscidean sites (0.0095%) were coincidentally associated with a Clovis archaeological site. This gives a chance-association rate of 6.3 × 10⁻⁸ associations/km2 [19 associations/(3025 km2 × 100,000 iterations)]. Projecting this co-occurrence rate to continental North America, we should not expect to observe any coincidental associations (6.3 × 10⁻⁸ associations/km2 × 14 million km2 = 0.88 associations). Since at least three of the 31 observed sites are likely coincidental associations, this simulation appreciably underestimates chance associations and shows that water tethering plays an important role in driving chance associations, even if such behavior cannot account for all empirical associations.
DISCUSSION
Our literature review indicates that of the 45 proboscidean sites with lithic artifact associations in North America, 14 are accepted butchery sites, meeting the strictest criteria of spatial association and evidence of human-animal interaction (Grayson and Meltzer, Reference Grayson and Meltzer2015). Conversely, at least three sites are likely coincidental associations. The remaining 28 sites are indeterminate, having not been confirmed as systemic associations (Table 1). We have taken a quantitative approach to assessing the proportion of these indeterminate sites that could reasonably be excluded or included as systemic cultural associations given the basic properties of Clovis and proboscidean site size and geographic distribution. Given observed densities and sizes of Clovis and proboscidean sites and tethering to water sources, our simulations suggest that the most likely frequency is nine coincidental associations and 22 systemic associations, with 95% of the simulations producing 5–14 coincidental associations. These observations further suggest that many of the empirically observed artifact-proboscidean associations (17–26) are likely systemic. If anything, this simulation may overestimate coincidental associations given our conservative approach, which guards against underestimating chance associations. The second, uniformly random spatial model shows that in the absence of water tethering, no coincidental associations should be expected in an area the size of North America at these site densities. Given that at least three of the empirically observed sites are likely coincidental associations, we know this is an underestimation of chance associations, as archaeological landscapes are spatially heterogeneous.
Given the relatively small number of 14 widely accepted proboscidean butchery sites, the addition of any site to the record is significant. Our conservative estimate more than doubles the count, suggesting a 121% increase in butchery sites. Our best estimate of 22 systemic sites suggests a 157% increase. These figures hold implications for ongoing debates in Paleoindian archaeology related to Clovis subsistence and the cause of Pleistocene megafaunal extinctions. For example, one common critique of the overkill hypothesis is the apparent low frequency of sites with evidence for human hunting of now-extinct fauna (e.g., Meltzer, Reference Meltzer1986; Grayson, Reference Grayson2001; Grayson and Meltzer, Reference Grayson and Meltzer2002). The increase in the number of culturally associated proboscidean sites inferred in our analysis is consistent with an appreciably greater degree of proboscidean hunting, thus supporting the hypothesis that humans played a role in their disappearance from North America.
The relatively low frequency of secure cultural associations with proboscidean remains has led to the conclusion that these species were not frequently included in the Clovis diet because there are “strikingly few archaeological sites that document human predation on, or scavenging of, these now extinct animals” (Grayson and Meltzer, Reference Grayson and Meltzer2015, p. 188). The addition of 17 or more sites with proboscidean remains would more than double the known instances of hunting or butchery. Further, there are only approximately 40 sites that are commonly used to define the Classic Clovis complex (Miller et al., Reference Miller, Holliday, Bright, Graf, Ketron and Waters2014), 13 of which contain megafauna (38%). Adding more proboscidean sites would create an even greater portion of sites containing megafauna remains, strengthening the arguments for dietary specialization.
No isolates were found in association with proboscidean remains during the simulations. This highlights the extreme unlikelihood of a Clovis artifact falling within the area generally excavated around proboscidean remains. However, caution should be taken if the projectile point is more recent, as archaeological site densities increase exponentially through time (Surovell et al., Reference Surovell, Finley, Smith, Brantingham and Kelly2009). The relative abundance of archaeological sites in more recent times is also why each of these sites must be evaluated further before acceptance. Nonetheless, these simulations do show that instead of skepticism there is a good chance that many associations with Paleoindian artifacts are systemic, not postdepositional. It is worth noting that, while the focus of this work is Clovis, some of the proposed sites listed here predate Clovis (e.g., Halligan et al., Reference Halligan, Waters, Perrotti, Owens, Feinberg, Bourne, Fenerty, Winsborough, Carlson and Fisher2016). We chose to include them, as sites from any period can become coincidentally associated with artifacts. Further, these sites need to be considered, as their inclusion on a list of widely accepted megafaunal butchery sites would be significant for early Paleoindian studies as well as the overkill hypothesis.
Although quantitative approaches that examine the record in aggregate, such as this one, cannot assign any particular association as a Paleoindian butchery site or a coincidental association, they nonetheless offer insight into how many known associations can be considered butchery sites or coincidental associations. Quantitative approaches thus have an important role to play alongside more traditional site-centered approaches in evaluating hypotheses. Most spatially associated sites reviewed here (Table 1) were only preliminarily investigated or reported and require additional field or collections work before they can be widely accepted (Grayson and Meltzer, Reference Grayson and Meltzer2002, Reference Mackie, Surovell, O'Brien, Kelly, Pelton, Haynes and Frison2015). Some have had this work recently completed (e.g., Halligan et al., Reference Halligan, Waters, Perrotti, Owens, Feinberg, Bourne, Fenerty, Winsborough, Carlson and Fisher2016; Mackie et al., Reference Mackie, Surovell, O'Brien, Kelly, Pelton, Haynes and Frison2020), but it was since the last significant review of megafauna butchery sites (Grayson and Meltzer, Reference Grayson and Meltzer2015), so we continued to place them on the indeterminate list. Several sites do not have well-defined ages (Dick and Mountain, Reference Dick and Mountain1960; Zier et al., Reference Zier, Jepson, McFaul and Doering1993), a problem that can be addressed via concerted dating efforts. Others have the potential to contain geofacts (e.g., Lubinski et al., Reference Lubinski, Terry and McCutcheon2014) instead of human-produced assemblages, which would eliminate them from the potential megafauna butchery list (e.g., Tune et al., Reference Tune, Waters, Schmalle, DeSantis and Kamenov2018).
CONCLUSIONS
It is only with the consolidation of nearly a century's worth of archaeological and paleontological data that we can begin to take such quantitative approaches to the question of human-megafauna associations. Based on the simulations presented here, coincidental associations between archaeology and megafauna can, and have been shown, to happen. Our best estimate suggests nine coincidental associations, and that 22 of the 31 observed associations are systemic (Table 1). The low estimates place the additional number of systemic associations at 17, while more generous approximations indicate that 26 observed associations are likely systemic. The default position of some scholars when finding lithics associated with proboscidean remains is coincidental association. Our analysis shows that such an approach is likely to lead to overestimation of coincidental associations. While additional site-specific work is needed before any of the 31 spatially associated sites, in particular, are accepted or rejected as culturally associated, the results of the water tethered simulation suggest that 17–26 of these cases are likely due to systemic associations. Given that only 14 sites are currently widely accepted, a 121–186% increase in the known proboscidean butchery sites is significant for understanding the human exploitation of proboscideans in the Pleistocene. Depending on one's theoretical perspective, scholars have tended to draw different conclusions from spatial associations. At one extreme, any spatial association is viewed as evidence of human-megafaunal interaction. At the other extreme, only spatial associations without direct evidence of interaction are considered evidence of an absence of interaction. Instead of viewing all spatial associations between artifacts and megafauna as confirmatory or suspect, we should consider the full range of possibilities.
Supplementary Material
The supplementary material for this article can be found at https://doi.org/10.1017/qua.2021.1
Acknowledgments
We thank Todd Surovell, Robert Kelly, Melissa Murphy, Mark Clementz, Tom Demere, David Kilby, Tyler Faith, and an anonymous reviewer for useful comments on earlier drafts of this paper. David Anderson provided the most recent copy of PIDBA. This research did not receive any grant from funding agencies in the public, commercial, or not-for-profit sectors. Any errors are our own.