Implications
Performance data for Swedish Warmblood horses used for genetic evaluation go back to the early 1970s. Some of the recorded traits have changed considerably over the years. To estimate accurate and reliable breeding values (BVs) it was important to investigate how the long-time series of data should be handled in genetic evaluations. Different models were compared regarding their predictive ability, and differences and accuracies of predicted BVs were investigated. The study showed that all data from the beginning of the recording can be used to maximise ‘unbiasedness’ and reliabilities of BVs for as many horses as possible.
Introduction
Genetic evaluation for Swedish Warmblood sport horses (SWB) is based on a multiple-trait animal model with results from competitions and young horse performance tests. Data go back to the beginning of the 1970s. Earlier studies (Viklund et al., Reference Viklund, Thorén Hellsten, Näsholm, Strandberg and Philipsson2008 and Reference Viklund, Braam, Näsholm, Strandberg and Philipsson2010) have shown that some of the recorded traits have not stayed the same throughout the years. The heritabilities and variances changed over time, and the genetic correlations between traits recorded at different time periods were sometimes considerably less than unity. For conformation, gait and jumping traits at riding horse quality tests (RHQT) for 4-year-old heritabilities increased between judging periods 1973 to 1987 and 1996 to 2002, mostly due to lower residual variances in the later period (Viklund et al., Reference Viklund, Thorén Hellsten, Näsholm, Strandberg and Philipsson2008). For example, the heritability for canter under rider increased from 0.22 to 0.37, whereas the residual variances decreased from 0.87 to 0.52. The phenotypic variance decreased for all traits. Genetic correlations between traits in the different judging periods ranged between 0.48 (correctness of legs) and 0.97 (walk under rider). For dressage competition traits, heritabilities decreased slightly between birth year groups 1953 to 1983 and 1992 to 2002 (from 0.18 to 0.14), whereas they increased slightly for show jumping (from 0.31 to 0.34; Viklund et al., Reference Viklund, Braam, Näsholm, Strandberg and Philipsson2010). For both disciplines, the phenotypic variances decreased between traits recorded in the early period and late period (0.61 to 0.50 for dressage and 0.61 to 0.47 for show jumping). The genetic correlations between traits in different birth year periods were 0.71 (dressage) and 0.66 (show jumping). These changes in genetic parameters were suggested to be caused by expansion of the sport, changes in scoring of young horses and increased foreign influence on the horse population as breeding has become internationalised (Viklund et al., Reference Viklund, Thorén Hellsten, Näsholm, Strandberg and Philipsson2008 and Reference Viklund, Braam, Näsholm, Strandberg and Philipsson2010).
Accuracy of genetic evaluations depends on how well the assumptions of the model match the data. Usually, as for the genetic evaluation of SWB, constant variance of traits recorded across time is assumed, but often this assumption does not hold. In dairy cattle, for example, milk yield has increased over time due to improvement of management and increased genetic level as a result of selection. Variances for milk production traits have increased simultaneously with increasing means (Van Vleck, Reference Van Vleck1966; Tsuruta et al., Reference Tsuruta, Misztal and Lawlor2004). In the Icelandic horse population, the phenotypic standard deviation as well as the heritabilities increased considerably between time periods due to a re-definition of traits in 1990 (Árnason and Sigurdsson, Reference Árnason and Sigurdsson2004). The largest difference in heritabilities between traits recorded in different judging periods (1979 to 1989 and 1990 to 2003) was found for legs that increased from 0.16 to 0.38, and the largest difference in phenotypic standard deviation was found for trot (from 0.48 to 0.72). The correlations between traits in the two different time periods were for many traits significantly deviating from one (0.68 to 0.94). For other horse populations, changes in variation of traits over time have not been reported.
There are different approaches for handling changes in variation over time. One way is to adjust variances of data from different groups to a common population variance (e.g. Hill, Reference Hill1984; Wiggans and VanRaden, Reference Wiggans and VanRaden1991; Van der Werf et al., Reference Van der Werf, Meuwissen and De Jong1994). Another way of handling the problem, suggested by Weigel and Banos (Reference Weigel and Banos1997), as regards international dairy sire evaluations, was to discard historical performance data of bulls from breeds or strains that have been changed by imported stock. A third approach is to treat traits in different time periods as different traits. In the Icelandic horse population, the traits are regarded as different traits if they are scored before or later than 1990 (Árnason et al., Reference Árnason, Sigurdsson and Lorange2006), and Tsuruta et al. (Reference Tsuruta, Misztal and Lawlor2004) handled milk records in every 3-year interval as separate traits.
The objective of this study was to investigate how the long-time series data of SWB horses should be handled in genetic evaluation to estimate accurate and reliable breeding values (BVs). Univariate models including all performance data or excluding data from the early period were compared to a bivariate model (BM) where performance traits were considered as different traits in the early and late period.
Material
Data
The data were provided by the Swedish Warmblood Association and the Swedish Equestrian Federation. RHQT data comprised 18 216 horses evaluated between 1973 and 2007. The RHQT is a 1-day field test, where conformation, gaits, jumping and rideability are judged on a scale from 1 to 10. The test is open to all 4-year-old SWBs, and to 5-year-old mares that had foaled as 4-year-olds. The traits studied were type, trot at hand, canter under rider, jumping technique and ability, and temperament and general appearance for jumping. Competition data comprised 15 396 horses that had competed in dressage and 29 564 horses that had competed in show jumping. The horses were born between 1953 and 2002, and they had competed during the period 1962 to 2006. Competition results were recorded as accumulated lifetime upgrading points in show jumping and dressage, transformed with a logarithm to the basis of 10 to a nearly normal distribution. Show jumping and dressage results were analysed separately. The data structure is described in more detail by Viklund et al. (Reference Viklund, Thorén Hellsten, Näsholm, Strandberg and Philipsson2008 and Reference Viklund, Braam, Näsholm, Strandberg and Philipsson2010).
For both RHQT and competition data, a pedigree database including seven ancestral generations was used to create the corresponding additive relationship matrix A for the genetic analyses (45 811 ancestors for RHQT data and 81 103 ancestors for competition data).
Time periods
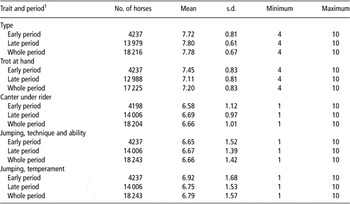
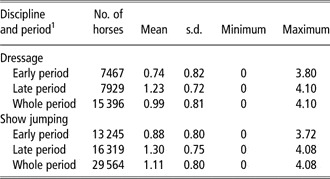
Following Viklund et al. (Reference Viklund, Thorén Hellsten, Näsholm, Strandberg and Philipsson2008) the RHQT data were divided into two test time periods, early period (1973 to 1987) and late period (1988 to 2007). The competition data were divided into two corresponding periods by birth year, early period (1953 to 1983) and late period (1984 to 2002), as recommended by Viklund et al. (Reference Viklund, Braam, Näsholm, Strandberg and Philipsson2010). The cut points were chosen to coincide with a breakpoint in annual genetic progress, measured by the trends in the BLUP index of tested horses. For horses born until 1983, this progress was modest. Because horses are 4 or 5 years of age at RHQT, the cut point 1987 for RHQT data corresponds to birth year 1983 for competition data. The distribution of horses judged or competing at different time periods, means and standard deviations for RHQT and competition traits are presented in Tables 1 and 2.
Description of data used for study of judging period (early–late) of riding horse quality test for 4-year-old horses

1Early period = horses judged 1973 to 1987; late period = horses judged 1988 to 2007; whole period = horses judged 1973 to 2007.
Description of data used for study of birth period (early–late) based on 10-log transformed accumulated points at competitions

1Early period = horses born 1953 to 1983; late period = horses born 1984 to 2002; whole period = horses born 1953 to 2002.
Methods
Estimation of genetic parameters
The RHQT and competition data were analysed separately. Genetic parameters and BVs were obtained by using the DMU package for analysing multivariate mixed models (Jensen and Madsen, Reference Jensen and Madsen1997). For each trait, four analyses were performed according to the following type of model and data included:

In addition, univariate analyses were performed for whole data sets where the scores were standardised to a common unity variance. The phenotypic variance for RHQT traits was adjusted to be equal for all events, whereas the competition trait variances were adjusted to be equal for all birth years. The results from these analyses were almost identical to the results from the UW and are therefore not reported.
The basic BM was:

where y 1 is the observed trait 1 (early period) and y 2 is the observed trait 2 (late period). The vector (β 1′β 2′)′ contains for RHQT traits the fixed effects of event (1,…,432), sex (male or female) and age (4 or 5 years of age), and for competition traits the fixed effects of birth year (1953,…,2002) and sex (male or female). The X and Z matrices are incidence matrices relating the observations to the fixed and random effects, respectively, a is a vector of additive genetic effects of the horses, and e is a vector of random residuals:

where G is the additive genetic covariance matrix with the following components:

⊗ is the Kronecker product, A is the additive genetic relationship matrix and R is the residual dispersion matrix having the following components:

where σe 12 is the residual variance for trait 1 (data from the late period are missing); σe 22 is the residual variance for trait 2 (data from the early period are missing); and σe 1,e 2 and σe 2,e 1 are the covariances between the early and late periods. Because a horse could not have observations from both periods, those covariances are not estimable and were set to zero.
The same model was used in the univariate analyses (UW, UE and UL) with the simplification of including only one trait and the corresponding rows and columns of R and G deleted.
Index calculation
The predicted BVs from the analyses were transformed to the common publication scale as follows:

where BV is the predicted BV on the common publication scale, μ is the mean of BV for the reference population equal to 100, BVu is the BV on the original scale from the analyses, mu is the mean of BVu in the reference population (horses judged in RHQT 1994 to 2007 or horses born during 1989 to 2002 with competition results regardless of discipline), σ a = additive genetic standard deviation of the trait in the reference population, and s.d. is the desired genetic standard deviation of BV fixed to 20 units.
Accuracy of BVs
Accuracies defined as the correlation between true and estimated BV (r TI) were calculated as

where PEV is the prediction error variance.
Comparison of models
Comparison of BVs
All comparisons of BVs were performed relative to the BVs for the late period estimated with the bivariate model, because these were regarded as the most correct BV for the actual breeding population. Correlations between BVs predicted in different models were calculated and the average of the differences (real) and average of the absolute values of the differences (absolute) between different BVs were investigated. The comparisons were conducted for different groups of horses, that is, all horses judged in RHQT and horses in each time period of RHQT, and for all horses with competition results within a discipline and for horses of each birth year period.
Comparison of r TI
For each judging year (RHQT) or each birth year (competition), the average r TI was calculated for BVs predicted in the different models.
Cross validation
A cross validation (CV) study was performed for one trait from each data set to compare the predictive ability of the models. The chosen traits trot at hand from RHQT data and 10-log accumulated points in show jumping had shown the lowest genetic correlations between time periods in the earlier studies by Viklund et al. (Reference Viklund, Thorén Hellsten, Näsholm, Strandberg and Philipsson2008 and Reference Viklund, Braam, Näsholm, Strandberg and Philipsson2010). The late period of the data was divided into five equal test data sets within the event for RHQT data and within the birth year for competition data. All test datasets had the same number of horses and the same distribution of fixed effects. The UL, UW and BM analyses were performed leaving out one test data set at a time. For the test data set left out, the expected phenotypic values of the horses were calculated from the estimates from the analyses and compared to the real phenotypic values by the correlation and the root mean squared error (RMSE).
Results
Genetic parameters
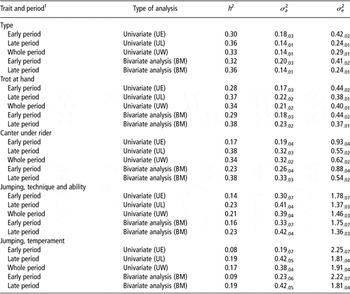
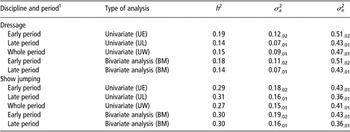
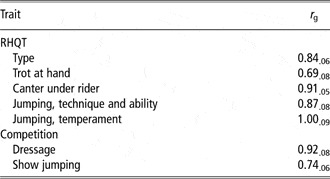
In the analyses of RHQT data, heritabilities ranged between 0.08 and 0.38, and genetic variances ranged between 0.14 and 0.42 (Table 3). For all traits, the heritabilities were largest in the late period (UL and BM). The genetic variances were highest in the late period (UL and BM) for all traits, except for type, but there were no large differences compared with the univariate analysis using all data (UW). The residual variances were lowest for all traits in the late period (UL and BM). For competition traits, heritabilities ranged between 0.14 and 0.31, and genetic variances ranged between 0.07 and 0.19 (Table 4). For dressage, the heritabilities were highest for the early period (UE and BM). For show jumping, there was no difference between early and late periods (UE, UL and BM). The genetic variances, as well as the residual variances, were highest in the early period for both dressage and show jumping. The genetic correlations between traits recorded in different time periods (RHQT) or different birth year groups (competition) showed that most traits had not been the same throughout the years, especially trot at hand judged at RHQT (0.69) and show jumping (0.74; Table 5).
Heritabilities (h 2), additive genetic (σa 2) and residual (σe 2) variances (s.e. as subscripts) estimated in univariate and bivariate analyses for traits evaluated at riding horse quality tests 1973 to 2007

1Early period: horses judged 1973 to 1987; late period: horses judged 1988 to 2007; whole period = horses judged 1973 to 2007.
Heritabilities (h 2), additive genetic (σa 2) and residual (σe 2) variances (s.e. as subscripts) estimated in univariate and bivariate analyses for 10-log transformed accumulated points at competitions for horses born 1953 to 2002

1Early period: horses born 1953 to 1983; late period: horses born 1984 to 2002; whole period = horses born 1953 to 2002.
Genetic correlations (r g) (s.e. as subscripts) between early and late period of riding horse quality testFootnote 1 (RHQT) and competitionFootnote 2 traits estimated in bivariate analyses

1 Genetic correlation between trait judged 1973 to 1987 and trait judged 1988 to 2007.
2 Genetic correlation for 10-log transformed accumulated points between birth year 1953 to 1983 and birth year 1984 to 2002.
BVs
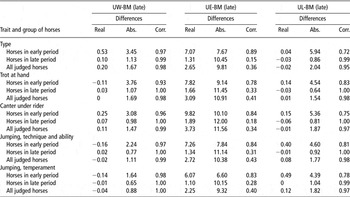
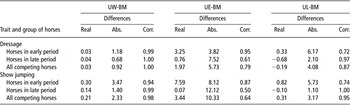
The average real differences between BVs in the late period in the BM analyses and the UW analyses were non-existent for either group of traits (Table 6 and 7), whereas there were some absolute differences between the BVs for horses in the early period. The correlations between BVs ranged from 0.93 (trot at hand for horses in the early period) to 1.00. The higher correlations between BVs for horses in the late period compared to the BVs for horses in the early period showed that those BVs were more closely related to the ones for the whole period (i.e. in agreement with the absolute difference).
Average real and absolute (abs.) differences, and correlations (corr.) between predicted breeding values for late periodFootnote 1 riding horse quality test traits in bivariate analysis (BM) and BVs in univariate analysis for whole periodFootnote 1 (UW), early periodFootnote 1 (UE) and late periodFootnote 1 (UL)

1 Whole period = 1973 to 2007; early period: trait judged 1973 to 1987; late period: trait judged 1988 to 2007.
Average real and absolute (abs.) differences, and correlations (corr.) between predicted breeding values for late periodFootnote 1 competition traits in bivariate analysis (BM) and BVs in univariate analysis for whole periodFootnote 1 (UW), early periodFootnote 1 (UE) and late periodFootnote 1 (UL)

1 Whole period = horsed born 1953 to 2002; early period: horses born 1953 to 1983; late period: horses born 1984 to 2002.
Comparison between BVs for the late period predicted in the BM and UL analyses showed no average real differences either. However, there were large absolute differences in BVs, indicating less reliable BVs for horses from the early period that were not included with records in univariate analysis (UL) (Tables 6 and 7). The largest difference was above six index units, corresponding to nearly one-third of the genetic standard deviation. The correlations were moderate to high (0.72 to 1.00 for both RHQT and competition data) between the BVs. For horses with records in the early period, the correlations between BVs predicted with late period data only (UL) and BM were moderately low (0.72 to 0.83).
There were large average differences, both real and absolute, between the model with data from the early period only (UE) and the BM. The correlations were low to moderate (0.15 to 0.89).
Accuracies of BVs
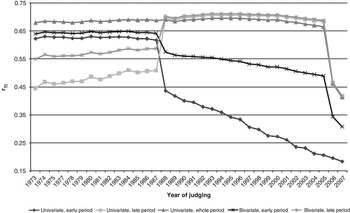
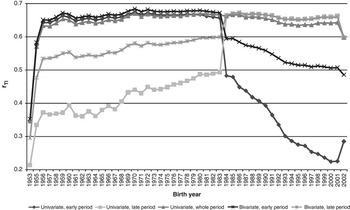
The average accuracies for BVs for the different traits followed the same pattern as the absolute differences in BVs and are illustrated in Figure 1 (RHQT; trot at hand) and Figure 2 (competition; show jumping). For horses judged in the later period of RHQT, both BVs from bivariate analysis (BM, late period) and univariate analysis with data from the late period (UL) showed high accuracies, closely followed by the univariate analyses with data from the whole period (UW). For show jumping, similar results were obtained as for the RHQT trait.
Average accuracies (r TI) of predicted breeding values for trot at hand judged at riding horse quality test in univariate or bivariate analyses with data from different time periods (whole period = judging years 1973 to 2007, early period = judging years 1973 to 1987, late period = judging years 1988 to 2007).

Average accuracies (r TI) of predicted breeding values for show jumping in univariate or bivariate analyses with data from different birth year periods (whole period = birth years 1953 to 2002, early period = birth years 1953 to 1983, late period = birth years 1984 to 2002) for different birth years of competing Swedish Warmblood horses.

Cross validation
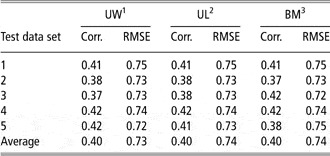
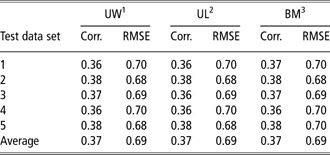
In Table 8 (RHQT; trot at hand) and Table 9 (competition; show jumping), the correlation and RMSE between the real and estimated phenotypic scores in each test data set are presented. There were no differences between the three compared models for any of the traits studied (UW, UL and BM).
Correlations (Corr.) and root mean squared errors (RMSE) between predicted and true phenotype for the trait trot at hand at riding horse quality test for the different test data sets in the cross validation

1UW = univariate model, all data (whole period).
2UL = univariate model, only data from late period.
3BM = bivariate model, all data with separate trait definition for early and late time periods.
Correlations (Corr.) and root mean squared errors (RMSE) between predicted and true phenotype for the trait accumulated points in show jumping for the different test data sets in the cross validation

1UW = univariate model, all data (whole period).
2UL = univariate model, only data from late period.
3BM = bivariate model, all data with separate trait definition for early and late time periods.
Discussion
To achieve genetic progress in sport horse breeding, it is essential to have a reliable genetic evaluation of the horses. In this study, we have investigated three different models of using data from long periods of time in the genetic evaluation. The heritabilities and variances were at the same level as estimated earlier by Viklund et al. (Reference Viklund, Thorén Hellsten, Näsholm, Strandberg and Philipsson2008 and Reference Viklund, Braam, Näsholm, Strandberg and Philipsson2010). The judging of horses at RHQT has improved over the years. This was indicated by the lower residual variances and higher heritabilities for the late period. The test is regulated and performed in the same way at all different locations, and the judges have to participate regularly at courses to harmonise the judging. The larger genetic variances for the late period, especially for jumping traits, may be explained by the importation of stallions included in SWB breeding and the increased specialisation for either jumping or dressage, thus contributing to a larger total variation in jumping traits.
Accumulated lifetime upgrading points reflect competition performance of a horse. The equestrian sport has expanded and developed considerably since the 1960s. There are more competitions, more classes, more horses and more riders that are competing. The horse population has also changed as a result of selection and importation of breeding stallions. This development explains the genetic correlations to be less than unity between time periods (0.74 for show jumping and 0.92 for dressage). It has led not only to an increase in the means of competition traits, but also lower residual variances. The genetic variances were lower in the late period, especially for dressage, most likely due to inclusion of younger horses in that data set. These horses have not yet expressed their full genetic potential due to the longer training period dressage horses require to achieve results at advanced levels.
Trot at hand was obviously evaluated in a different way in the late period than in the early period (genetic correlation of 0.69 between traits separately defined by time period). This may be primarily related to the change of judges, which in the early period were dominated by cavalry officers who have been replaced by dressage riders and trainers with a different view on movements of sport horses. Overall, the genetic correlations between traits in the two time periods were in the same range as Árnason and Sigurdsson (Reference Árnason and Sigurdsson2004) estimated for traits evaluated in Icelandic horses before and after 1990 (0.68 to 0.94).
Adjusting the scores to the same variance per event or birth year did not affect the genetic parameters. Hill (Reference Hill1984) concluded also that scaling by the sample deviation seemed to be a robust procedure, but he stated that it was not obviously the best way to deal with heterogeneity of variance in a BLUP analysis where homogeneity of variance is assumed. Van der Werf et al. (Reference Van der Werf, Meuwissen and De Jong1994) used an animal model and showed that the simple method for standardisation of variances within herd-year reduced biases of BVs by about 20%. Wiggans and VanRaden (Reference Wiggans and VanRaden1991) also used an animal model and concluded that the standardisation of variance for yield traits in US dairy cattle generally improved the evaluations, but that future research would probably reveal better methods.
Because some of the traits have not stayed the same over time, a bivariate approach (BM) was assumed to give more accurate BVs than a univariate model including data from the whole period (UW). In the BM analyses, the BVs of interest were based on the most recent data (late period) because it reflected the current breeding stock. BVs for the older horses were obtained through the genetic correlations and the performance of relatives. This is similar to the genetic evaluations for the Icelandic horse population (Árnason et al., Reference Árnason, Sigurdsson and Lorange2006). However, the high correlations between BVs (BM and UW) for the younger group of horses (0.99 to 1.00 for both RHQT traits and competition traits from the late period) indicated that the two models barely differed. The results from the CV study also showed no difference in predictive ability between the two models. For both models, high accuracies (r TI) of BVs were obtained for younger horses (RHQT and competition traits in the late period), but for older horses (RHQT and competition traits in the early period) the accuracies were much lower for BVs from the BM analysis than for BVs from the univariate analysis (UW). In this study, we analysed one trait at a time. In the official breeding evaluation, up to 10 traits are included in a multiple-trait analysis. In a bivariate approach with early and late period traits, there will be 20 traits in the genetic evaluations and this can lead to computational difficulties associated with the large covariance structure (Árnason et al., Reference Árnason, Sigurdsson and Lorange2006). The results show that even if the bivariate approach theoretically is expected to give more accurate BVs for the breeding stock of interest, the gain is negligible.
Another approach to handle heterogeneity in variances over time is to discard parts of the data as Weigel and Banos (Reference Weigel and Banos1997) suggested. In international dairy sire evaluations, selection has taken place at different rates among a number of populations with different base genetic variances. The differences are partly due to the starting date and rate of importation of stock from other populations, and how much historical data are available depending on when the national dairy database was established (Weigel and Banos, Reference Weigel and Banos1997). When performance data from daughters of sires born before the beginning of importation were discarded, the estimates of genetic standard deviations became more alike and BVs of elite bulls were close to true values. The conditions are not the same for national evaluations of a horse population. In this study, excluding historical data (UL model) negatively affected the accuracies of the BVs of the older horses with recorded traits in the early period. The long generation intervals and overlapping generations in horse breeding make it important to correctly predict BVs also for older animals, even for those that may not belong to active breeding stock. Therefore, the first period of data cannot be neglected in the genetic evaluation. This is also appreciated by the breeders who want to see the BVs of horses from different generations.
In a successful breeding programme with large genetic progress, the selection of breeding stock takes place among rather young horses. Therefore, it is most important that these horses are correctly evaluated. However, as stated above, the older horses also contribute important information. In the official BV prediction today, all data are used and no corrections are made to take into account that the traits have changed over time. The results in this study show that this is probably the best compromise to get the most accurate BVs for all horses of interest with limited computational efforts.
Conclusions
Some traits of riding horses have, except for genetic improvement, changed considerably over a period of about three decades. Traits from early and late time periods were considered as genetically different traits and were evaluated in a bivariate model. Use of all data or exclusion of data from the early time period for univariate analyses showed no difference in BVs of late born horses compared to BVs from the bivariate model. However, the accuracy of BVs decreased considerably for older horses when data of the early period were excluded.
The most accurate way to predict BVs for all SWB horses is either by a bivariate model, where the traits are considered genetically different between time periods, or by a univariate model including all data from the beginning of the recording. We recommend use of the univariate model in the genetic evaluations due to less complex calculations to achieve practically the same results.
Acknowledgement
Financial support from the Swedish Foundation for Equine Research is gratefully acknowledged. The Swedish Warmblood Association, the Swedish Horse Board and the Swedish Equestrian Federation are gratefully acknowledged for providing materials for the study.