Introduction
Polar regions in both the Northern Hemisphere and Southern Hemisphere are characterized by highly adverse living conditions for many organisms, and as a result relatively few invertebrate species have been reported from these locations (Coulson et al. Reference Coulson, Convey, Aakra, Aarvik, Ávila-Jiménez and Babenko2014, Russell et al. Reference Russell, Hohberg, Potapov, Bruckner, Otte and Christian2014). The paucity of recorded species stems from the specific climatic conditions (long winter, short vegetation period, low temperature) in these regions, as well as environmental conditions (e.g. water availability, plant communities, nutrient content), since extensive areas are covered by glaciers. However, as a consequence of climate change, the natural environment in polar regions is being transformed (Turner et al. Reference Turner, Bindschadler, Convey, di Prisco, Fahrbach and Gutt2009): glaciers are melting, and in areas free from ice cover succession is being observed not only in the case of plants (Moreau et al. Reference Moreau, Laffly, Joly and Brossard2005), but also in many groups of animals, including invertebrates (Convey Reference Convey2011). A particularly important role in the colonization of new areas is played by mites and springtails, which are frequently considered to constitute groups of pioneer organisms (Gwiazdowicz et al. Reference Gwiazdowicz, Zawieja, Olejniczak, Skubała, Gdula and Coulson2020). Moreover, they are frequently used as bioindicators of environmental change (Gulvik Reference Gulvik2007, Heink & Kowarik Reference Heink and Kowarik2010).
Factors determining the character of microarthropod communities in the Arctic have been investigated in many studies, particularly in the Svalbard archipelago, as summed up by Coulson et al. (Reference Coulson, Convey, Aakra, Aarvik, Ávila-Jiménez and Babenko2014) and Seniczak et al. (Reference Seniczak, Seniczak, Schwarzfeld, Coulson and Gwiazdowicz2020). In contrast, such research in the Antarctic has been scarce, with very few published studies. Nevertheless, some investigations have been carried out both on islands (e.g. Lynch Island, Alexander Island, Bishop Island, the Prince Edward Islands, the South Sandwich Islands, the South Orkney Islands, Livingston Island, offshore islands near Anvers Island; Usher & Edwards Reference Usher and Edwards1984, Convey & Smith Reference Convey and Smith1997, Davies et al. Reference Davies, Greenslade and Melbourne1997, Marshall et al. Reference Marshall, Gremmen, Coetzee, O'Connor, Pugh, Theron and Ueckermann1999, Convey et al. Reference Convey, Greenslade and Pugh2000, Bokhorst et al. Reference Bokhorst, Convey and Aerts2019, Potts et al. Reference Potts, Gantz, Kawarasaki, Philip, Gonthier and Law2020) and on King George Island and the continent itself, as has been extensively reviewed by Russell et al. (Reference Russell, Hohberg, Potapov, Bruckner, Otte and Christian2014).
Monitoring of environmental changes using bioindicators is essential, particularly in regions undergoing dynamic change. Examples in this respect are provided by studies in polar regions, especially the Antarctic. In 2016, a nature monitoring programme was launched focusing on mites and springtails in the vicinity of some Antarctic research stations. Such research makes it possible to 1) assess the character of species communities and the scope of biodiversity, 2) define succession processes in areas from which glaciers have retreated, including the identification of pioneering species, and 3) identify the factors (e.g. the character of the microhabitats or the place of sample collection) that determine the character of microarthropod communities.
The aim of this study was to determine the factors (e.g. the habitats covered with grasses, lichens and mosses or the place of sample collection) that influence the character of microarthropod communities on King George Island. Based on knowledge obtained so far from research in the Arctic (e.g. Gwiazdowicz et al. Reference Gwiazdowicz, Zawieja, Olejniczak, Skubała, Gdula and Coulson2020), we tested the hypothesis that habitat conditions, determined by the locality and character of the vegetation cover, play a significant role in this respect.
Materials and methods
Collection of material
The material was collected from four localities on King George Island (the South Shetland archipelago, Antarctica) in the vicinity of a research station or a refuge: Arctowski Station, Demay Refuge, Republica del Ecuador Refuge and Comandante Ferraz Station (30 samples × 4 localities = total 120 samples; Fig. 1).
1) In the vicinity of Arctowski Polish Antarctic Station, geographical coordinates 62°09'34'' S, 58°28'15'' W, sampling dates: 8 January 2016 (mosses), 11 January 2016 (grasses), 14 January 2016 (lichens)
2) In the vicinity of Demay Refuge, geographical coordinates 62°13'40'' S, 58°20'30'' W, sampling dates: 26 January 2016 (mosses, grasses), 28 January 2016 (lichens)
3) In the vicinity of Republica del Ecuador Refuge, geographical coordinates 62°07'16'' S, 58°23'42'' W, sampling dates: 16 January 2016 (lichens, mosses), 22 January 2016 (grasses)
4) In the vicinity of Comandante Ferraz Antarctic Station, geographical coordinates 62°05'00'' S, 58°23'28'' W, sampling date: 8 February 2016 (lichens, mosses, grasses)
All research plots were located in Admiralty Bay and were separated from each other by a distance of 5–10 km. The environmental (landscape) conditions (e.g. temperature, moisture, structures of soil) on all four plots were similar. Ten samples (10 × 10 cm each) were collected from each of the three types of dominant microhabitat in each plot (i.e. grasses, lichens and mosses; total 30 samples in each locality). Samples varied in thickness (mass), which was dependent on the microhabitat character. For example, samples of epilithic lichens (i.e. growing on stones) were characterized by a looser structure and lower mass compared to grass turf collected together with soil. All of the collected samples, despite their different weights, had a comparable volume of ~250 ml.
Sampling sites: 1 = Arctowski Station, 2 = Demay Refuge, 3 = Republica del Ecuador Refuge, 4 = Comandante Ferraz Antarctic Station.

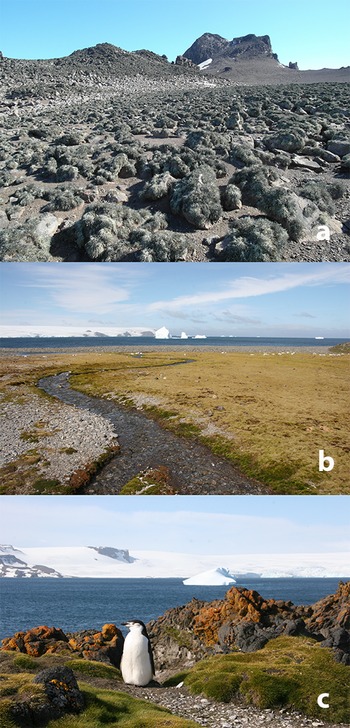
The three types of microhabitats differed considerably. Lichen communities varied in terms of their species composition, especially regarding the extent of coverage by Usnea antarctica, and they were collected only from the dry, rocky substrate characterized by a relatively low moisture content. Typically, they had no contact with soil, with the samples containing only lichen thalli without sand. Lichens covering boulders formed distinct clusters separated from one another, and therefore the surface was not uniformly covered by lichens. Mosses were sampled from ground hollows in which water was retained over extensive periods or were located in close vicinity to water flowing from large areas covered by snow or ice. Typically, the collected samples contained no soil, but frequently they included small amounts of sand. In turn, tufts of grass were collected together with roots, which were covered with soil. The dominant and frequently found species of bryophytes were Pohlia nutans and Pohlia cruda. In addition, material was collected from sites with Antarctic hair grass Deschampsia antarctica, where birds frequently stayed in the immediate vicinity of grass tufts and where traces of their presence, such as excrement, could be observed (Fig. 2).
Microhabitats from which the material was collected: a. lichens, b. mosses and c. grasses (in the vicinity of Arctowski Station; photographs: D.J. Gwiazdowicz).

Laboratory procedures
The collected samples were placed into Tullgren funnels at Arctowski Polish Antarctic Station within a few hours after sampling and extracted after 72 h in 96% ethanol, at which point the soil was completely dry. The extracted arthropods (both adults and juveniles) were classified into two groups comprising mites (Mesostigmata, Oribatida) and springtails (Collembola).
In order to identify the Mesostigmata species, permanent microslides were prepared using Hoyer's medium. All specimens were examined under a light microscope (Zeiss Axioskop 2) and identified based on the taxonomic literature (Hunter Reference Hunter1967, Jumeau & Usher Reference Jumeau and Usher1987).
The Oribatida were identified at high magnifications (100–1000×) under a light microscope (Zeiss Axioskop 2), mostly with phase contrast and differential interference contrast. Prior to examination, the cuticles were rendered transparent, and in freshly collected individuals the internal tissues were removed using concentrated lactic acid, 60% lactic acid or lactophenol. Dilute lactic acid was used for weakly sclerotized forms. Another method was used for strongly sclerotized forms and consisted of heating the samples to 60–70°C on a hot plate in lactic acid in cavity slides as temporary mounts. The clearing process was performed at room temperature over the course of several days and sometimes weeks. Oribatid mites were identified at the species level based on original species descriptions in the literature (Wallwork Reference Wallwork1965, Reference Wallwork1967, Covarrubias Reference Covarrubias1968).
A Nikon Eclipse E600 phase contrast microscope was used to identify the Collembola. The extracted specimens of springtails were cleared in Nesbitt's fluid (chloral hydrate, concentrated hydrochloric acid, distilled water) and slide-mounted in a mixed medium (distilled water, gum arabic, glycerol, chloral hydrate), generating the permanent microscopic slides necessary for taxonomic analysis. Taxonomic identification of the Collembola was based on Deharveng (Reference Deharveng1981), Greenslade (Reference Greenslade1995, Reference Greenslade2010, Reference Greenslade2018), Fanciulli et al. (Reference Fanciulli, Leo, Convey, Frati and Carapelli2018) and Carapelli et al. (Reference Carapelli, Greenslade, Nardi, Leo, Convey, Frati and Fanciulli2020).
The materials are stored in the acarological collection at Adam Mickiewicz University, Faculty of Biology, Poznań, Poland (Oribatida), Poznań University of Life Sciences, Department of Forest Entomology and Pathology (Mesostigmata) and University of Wrocław, Department of Invertebrate Biology, Evolution and Conservation (Collembola).
Statistical analysis
Statistical analyses were conducted separately for each locality (refuge or research station) and for each microhabitat (lichens, mosses, grasses). The Shannon diversity index (Shannon & Weaver Reference Shannon and Weaver1949) and Pielou's evenness index (Pielou Reference Pielou1966) were determined separately for each locality and for each microhabitat. One-way analysis of variance was carried out on these indexes (response variables) relative to the localities (explanatory variable). If statistically significant differences were found, simultaneous multiple comparisons were carried out using Tukey's method. The significance of differences between the investigated factors (localities and microhabitats, respectively) in terms of their abundance of species was analysed using permutational multivariate analysis of variance (Anderson Reference Anderson2017), applying analysis of dissimilarities (Adonis). The calculated test statistics (F) and degrees of freedom (df) for the numerator and denominator, respectively, along with empirical probabilities of significance (P) are given in the text or figures. In the case of significant differences between the levels of analysed factors (between the localities or microhabitats, respectively), a multilevel pattern analysis (Dufrêne & Legendre Reference Dufrêne and Legendre1997) was conducted, thus making it possible to distinguish between the groups and common species. In the multilevel pattern analysis, the correlation indexes (species belonging to the given locality) were calculated. Next, the significances of these indexes were calculated using permutation tests (this analysis also shows arthropod species preferences for the different microhabitats). Then, discriminant correspondence analysis (Thioulouse et al. Reference Thioulouse, Dray, Dufour, Siberchicot, Jombart and Pavoine2018) was used to present visually the differences between the analysed groups of factors.
The number of species and the number of specimens found at individual localities, with the microhabitat and the group of species (Mesostigmata, Oribatida, Collembola) taken into account, are presented in violin plots describing species variation in the investigated environments. Next, a two-way multivariate permutational analysis of variance for the occurrence of species (0 = not found, 1 = found) was applied, and if the differences proved to be significant, pairwise multiple comparisons were performed using permutational multivariate analysis of variance (Adonis), with the Bonferroni correction. If the interaction was significant, significant differences were analysed separately for each locality and separately for each microhabitat. All of the calculations were performed in the R environment using the vegan, indicspecies, ggplot2 and ade4 packages.
Results
Does the locality determine the character of microarthropod communities?
A total of 310 508 microarthropod individuals were collected (Mesostigmata = 1369, Oribatida = 500, Collembola = 308 639), which were classified into 17 species (1 Mesostigmata, 9 Oribatida, 7 Collembola). Microarthropod communities in individual localities differed in terms of both the number of species and the identified specimens. The lowest number of species was found at Arctowski Station and Demay Refuge (9 species each), with a slightly higher number found at Ecuador Refuge (11) and the highest number found at Comandante Ferraz Station (16). Moreover, the species abundance at individual localities also varied. The lowest number of microarthropods was observed at Demay Refuge (23 677), while markedly greater numbers of specimens were recorded at Ferraz Station (158 677). Cryptopygus antarcticus antarcticus Willem, 1901, was the dominant species at all of the localities, with the highest dominance index of 99.1% at Ferraz Station and lower values at Demay Refuge (96.1%), Arctowski Station (95.5%) and Ecuador Refuge (80.7%; Table I).
Species composition depending on the location.

A = number of individuals; D = dominance; F = frequency.
Species diversity was greatest at Arctowski Station and Ecuador Refuge and lowest at Demay Refuge. Similarly, the greatest species evenness was recorded at Ecuador Refuge, while the lowest species evenness was found at Demay Refuge (Fig. 3). Applying Tukey's test (the analysis of variance; indexes by locality were significant), significant differences were found between mean biodiversity indices at Arctowski Station and Demay Refuge, as well as between Demay and Ecuador refuges. The evenness indexes differed significantly between Ecuador Refuge and Ferraz Station, as well as between Ecuador and Demay refuges. The significance of the differences between localities in terms of the number and abundance of the reported species was verified (variances were homogeneous at P = 0.307). Significant differences were found between the individual stations or refuges (F = 3.4202, df = 3, 116, P = 0.001).
The Shannon diversity index (left panel) and Pielou's evenness index (right panel) at the localities. Bars represent the mean values of the indexes, while whiskers represent standard deviations. Buckles and P-values show the significance differences of Tukey's tests for simultaneous multiple comparisons. AS = Arctowski Station; ER = Ecuador Refuge; DR = Demay Refuge; FS = Ferraz Station.

In order to ascertain which species influenced diversity within a locality, multilevel pattern analysis was applied. Alaskozetes antarcticus (Michael, 1903) was a distinguishing species at Arctowski Station (significance at P = 0.001), Cryptopygus badasa (Greenslade, Reference Greenslade1995) was a distinguishing species at Demay Refuge (P = 0.004), while at Ecuador Refuge a distinguishing species was Folsomotoma octooculata (Willem, 1901) (P = 0.001). In contrast, none of the species influenced diversity at the Ferraz Station locality. In turn, one species - Hydrogamasellus racovitzai (Trouessart, 1903) - was a distinguishing species (P = 0.040) of two localities: Demay and Ecuador refuges.
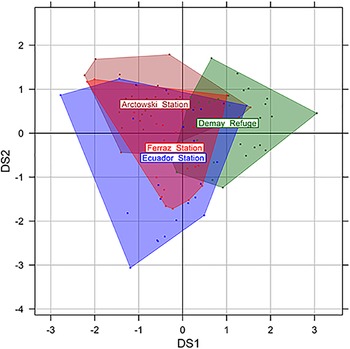
Discriminant correspondence analysis (Fig. 4) was used to illustrate the division of observations into four groups (localities). As can be seen in Fig. 4, the area established for Ferraz Station is almost completely contained within the areas of Arctowski Station and Ecuador Refuge.
The discriminant correspondence plot analysis for the localities in the system of the first two discriminant variables. Areas with different colour contain points representing a given station; brown = Arctowski Station, blue = Ecuador Refuge, green = Demay Refuge, red = Ferraz Station.

Does the microhabitat determine the character of microarthropod communities?
Microarthropod communities in individual microhabitats differed both in terms of the number of species and the number of recorded specimens. A total of 10 species of mites and springtails in lichens and mosses were recorded, as well as 16 species in grass turf. The lowest number of individuals was found among lichens (6528) and the greatest number was observed among mosses (162 697; Table II). Cryptopygus a. antarcticus was the dominant species in the microhabitats occupied by mosses (98.2%) and grasses (97.5%). In contrast, the structure of microarthropod communities in the lichen microhabitat was different. In this microhabitat, Tullbergia mixta Wahlgren, 1906 was dominant (32.2%), followed by C. a. antarcticus (27.1%). Higher dominance indices were recorded also for other species such as C. badasa (13.7%), F. octooculata (13.2%) and Friesea antarctica (Willem, 1901) (6.3%; Table II).
Species composition depending on the character of the microhabitat.

A = number of individuals; D = dominance; F = frequency.
The greatest biodiversity based on the Shannon index and the greatest evenness as shown by Pielou's index were recorded for the lichen microhabitat. In turn, the lowest diversity and the lowest evenness were observed in the moss microhabitat. All of the means, both for the diversity indexes and the evenness indexes, were statistically significantly different from each other (Tukey's test; Fig. 5).
The Shannon diversity index (left panel) and Pielou's evenness index (right panel) for microhabitats. Bars represent mean values of the indexes, while whiskers represent standard deviations. Buckles and P-values show the significance differences of Tukey's tests for simultaneous multiple comparisons.

The significance of differences between the microhabitats in terms of the number of recorded species was tested (variances were homogeneous at P = 0.139). Significant differences were found between the microhabitats (F = 17.818, df = 2, 117, P = 0.001). Multilevel pattern analysis showed that A. antarcticus (significance at P = 0.001) was a species distinguishing the grass microhabitat. In turn, for the lichen microhabitat Membranoppia (Pravoppia) loxolineata longipilosa (Covarrubias, Reference Covarrubias1968) (P = 0.000) and F. octooculata (P = 0.003) were distinguishing species, while for mosses the distinguishing species were C. badasa (P = 0.001) and C. a. antarcticus (P < 0.001). There were also two species common to grasses and lichens: H. racovitzai (P < 0.001) and F. antarctica (P = 0.020), while one species was common to lichens and mosses: T. mixta (P < 0.001).
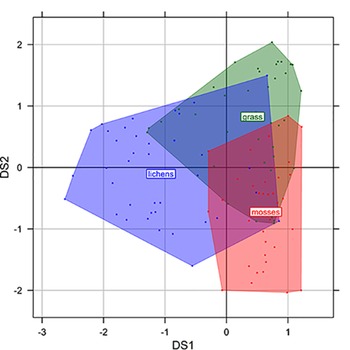
Discriminant correspondence analysis was used to illustrate the division of observations into three groups (microhabitats). Figure 6 shows marked differences between the microhabitats.
The discriminant correspondence analysis for microhabitats in the system of the first two discriminant variables. Areas with different colours contain points representing a given microhabitat; blue = lichens, green = grass, red = mosses.

What species have been recorded?
The most abundant mite species included one representative of the order Mesostigmata, H. racovitzai (1369 individuals), and one representative of oribatid mites, M. l. longipilosa (219 individuals). Representatives of Collembola were much more numerous: in the collected material the dominant species were C. a. antarcticus (299 203 individuals), C. badasa (3527 individuals) and T. mixta (2485 individuals). In turn, F. octooculata (1728 individuals) and F. antarctica (1688 individuals) were slightly less abundant. Analyses of frequency indicated some selectivity of species. Cryptopygus a. antarcticus showed the highest frequency indexes at all of the localities: 100% at Arctowski Station, Demay Refuge and Ferraz Station and 73.3% at Ecuador Refuge. Moreover, high frequency was also recorded for mesostigmatic mites H. racovitzai and other Collembola species such as F. antarctica (Table I).
Species not previously found on King George Island were also recorded: Flagrosuctobelba subcornigera (Forsslund, 1941), Liochthonius australis Covarrubias, Reference Covarrubias1968, Membranoppia (Pravoppia) ventrolaminata (Hammer, 1962) and Quadroppia (Coronoquadroppia) monstruosa Hammer, 1979 belonging to Oribatida, as well as Archisotoma brucei (Carpenter, 1907) belonging to Collembola. Four species represented by only one individual each were recorded. From the Ferraz Station locality Q. C. monstruosa, Dometorina cf. marionensis and A. brucei were found on grasses, while at the Ecuador Station locality M. P. ventrolaminata was also identified in grasses. Moreover, a very small population was also observed for Oppia sp. (3 individuals) in the grass turf at the Ferraz Station locality, as well as Friesea woyciechowskii Weiner, 1982, recorded in three samples of mosses (2 samples from Ecuador Refuge and 1 sample from Ferraz Station).
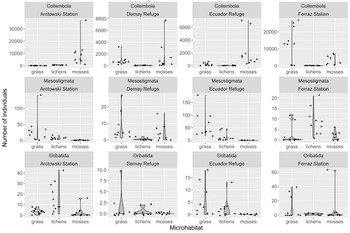
The localities and microhabitats, in terms of species groups, were divided into groups based on the number of individuals per sample and the number of species, as illustrated on the violin plots in Fig. 7, which take into consideration the individual samples (points on the plots). For Collembola (Fig. 7), the greatest number of individuals was recorded in samples collected from mosses at three localities, while at Ferraz Station it was in samples from the grass microhabitats. This is attributable to the large population size of one species, C. a. antarcticus. Mesostigmata (of which only one species was found) were observed at three localities, most abundantly in samples collected from grasses, while at the Ferraz Station locality this species was found in samples from the lichen microhabitats. Oribatida were most abundant in samples collected from grasses at two localities. However, at Demay Refuge the overall high value for abundance was attributable to the large population size of this group of species in only one of the samples. At Ferraz Station, the highest numbers of individuals were found in mosses and grasses, while at Arctowski Station the highest number was found in the samples collected from lichens (Fig. 7).
Violin plots for the numbers of individuals per sample. The points represent the samples. In the rows are the species and in the columns are the stations.

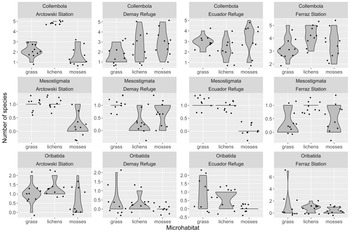
The numbers of species per sample (Fig. 8) for the Collembola were comparable in each habitat (grasses, lichens, mosses) at all of the localities. At Arctowski Station, the largest number of species was recorded in samples from the lichens, while at Demay Refuge the lowest number of species was found in samples collected from grasses. Mesostigmata (with only one species found) at three localities were identified in each of the samples collected from grasses; similarly, at three stations the species was found in all of the samples collected from lichens. This species was not recorded in samples from mosses collected at Ecuador Refuge and in only one sample from Arctowski Station. Only two Oribatida species were observed at the Arctowski Station, Demay Refuge and the Ecuador Refuge localities, while as many as seven species were identified in one sample collected from grasses at the Ferraz Station locality.
Violin plots for the numbers of species per sample. The points represent the samples. In the rows are the species and in the columns are the stations.

A significant interaction between stations and microhabitats (P = 0.001) was shown by multivariate analysis of variance, using the permutation method (Adonis), for occurrence of species (without abundance of given species). Moreover, the differences between stations and microhabitats were also significant (P = 0.001 for both of these factors). Multiple comparisons conducted for the microhabitats separately for each locality and for the localities separately within each microhabitat (due to the significance of interactions) showed that at Arctowski Station and Ecuador Refuge differences between all of the microhabitats were significant (P = 0.030). In contrast, at Demay Refuge none of the microhabitats differed significantly. At Ferraz Station, significant differences were found between the mosses and lichens (P = 0.030), while Arctowski Station and Demay Refuge differed significantly only in the case of mosses. Significant differences for samples collected from lichens were found between the Arctowski Station and Ecuador Refuge localities, the Arctowski Station and Demay Refuge localities, the Ferraz Station and Ecuador Refuge localities and the Ferraz Station and Demay Refuge localities. In the case of samples collected from grass microhabitats, the analyses indicated that the Arctowski Station and Ferraz Station localities, the Ecuador Refuge and Ferraz Station localities, the Demay Refuge and Ferraz Station localities and the Ecuador Refuge and the Demay Refuge localities differ significantly (all significant P-values were 0.030). This shows that in terms of the species composition the moss microhabitats were most similar (only differing significantly at two localities). Moreover, at Demay Refuge different microhabitats did not differ significantly in terms of the recorded species.
Discussion and conclusions
Terrestrial invertebrate communities can only develop in ice-free areas of Antarctica because edaphic species need to inhabit soil substrates, which are only found in ice-free areas. Only ~1% of the entire Antarctic continent is free of ice, but the exact area is not well known (Russell et al. Reference Russell, Hohberg, Potapov, Bruckner, Otte and Christian2014). Due to the melting of glaciers and the expansion of ice-free areas, research on soil fauna should be intensified, especially in the vicinities of research stations in the Antarctic.
Although such investigations in Antarctica have been conducted for > 120 years, there are still gaps in basic zoological knowledge. The mainstream of research includes taxonomic (descriptions of unknown species and developmental stages) and zoogeographical studies (ranges of species occurrence). There are only a few publications on ecological aspects, such as the microhabitat preferences of mites or springtails.
To date, several papers have been published concerning the invertebrate fauna on King George Island. Some of these give brief information on the occurrence of certain mite species and describe new species (Niedbała Reference Niedbała1986). Others discuss the succession of mites at the glacier forefield (Gryziak Reference Gryziak2009). An extensive review of studies conducted to date, including the new, original results on the terrestrial invertebrate fauna from terrestrial Antarctic areas, has been presented by Russel et al. (Reference Russell, Hohberg, Potapov, Bruckner, Otte and Christian2014), who provide abundant data on the ranges of selected species. In addition to the current state of knowledge contained in the literature, the present study has identified species previously not reported on King George Island, thereby contributing significant novel data to our understanding of Antarctic zoogeography. These species included F. subcornigera, M. (Pravoppia) ventrolaminata and Q. (Coronoquadroppia) monstruosa belonging to Oribatida as well as A. brucei belonging to Collembola.
A number of environmental factors that may affect the distribution of Collembola in Antarctica (soil moisture, organic matter, phosphorous content, vegetation cover, elevation and slope) have been analysed by Tilbrook (Reference Tilbrook1967), Adams et al. (Reference Adams, Bardgett, Ayres, Wall, Aislabie and Bamforth2006), Sinclair et al. (Reference Sinclair, Scott, Klok, Terblanche, Marshall, Reyers and Chown2006), Day et al. (Reference Day, Ruhland, Strauss, Park, Krieg, Krna and Bryant2009), Russell et al. (Reference Russell, Hohberg, Potapov, Bruckner, Otte and Christian2014) and Enríquez et al. (Reference Enríquez, Tejedo, Benayas, Albertos and Luciáñez2018). The results of these studies identify various factors as particularly crucial. On this basis, Enríquez et al. (Reference Enríquez, Tejedo, Benayas, Albertos and Luciáñez2018) concluded that ‘the distribution and abundance of Collembola in Antarctic localities is not directly dependent on any single factor. The environmental characteristics of each studied site will determine what factors are driving the composition and structure of this soil community.’ As is shown in the current study, the microarthropod communities of individual localities and microhabitats differed both in terms of the number of species and reported individuals. Consequently, these factors should be taken into account when studying Antarctic microarthropod communities.
Sampling sites (locality) and microhabitat diversity were evident in the character of microarthropod communities, which was reflected in the number of species and individuals. At all of the localities, C. a. antarcticus was the dominant species. Nevertheless, the multilevel pattern analysis showed that A. antarcticus was a species distinguishing Arctowski Station. For Demay Refuge it was C. badasa, while for Ecuador Refuge it was F. octooculata. No distinguishing species was found for Ferraz Station. These results indicate that the character of invertebrate communities varies and is dependent on the sampling site (locality), even if these sites are situated within one marine bay.
Different results were recorded in the material originating from various microhabitats. Cryptopygus a. antarcticus was also the dominant species in the microhabitats of mosses (98.2%) and grasses (97.5%). However, the structure of microarthropod communities in the lichen microhabitat was very different, as in that microhabitat T. mixta (32.2%) and C. a. antarcticus (27.1%) were dominant. Therefore, when analysing the current dataset it can be concluded that the nature of the microarthropod community was influenced by both the location (place of sample collection) and the microhabitat. However, when defining the hierarchy of factors, the nature of the microhabitat played a more important role, as it influenced greater species diversity.
This was particularly evident when we compared the results obtained in the vicinity of Arctowski Station with the results obtained in the same locality by Gwiazdowicz et al. (Reference Gwiazdowicz, Niedbała, Skarżyński and Zawieja2022) but for other types of microhabitats in this location, including bird nests. Although the same species of mites and springtails were recorded, their numbers were significantly different. For example, in the present study A. antarcticus was reported in numbers ranging from two individuals (lichens) to 148 (grasses). On the other hand, 5031 individuals were found in the same number of samples collected from the nests of Adélie penguins Pygoscelis adeliae (Gwiazdowicz et al. Reference Gwiazdowicz, Niedbała, Skarżyński and Zawieja2022). This indicates clear microhabitat preferences of selected species. Unfortunately, it is not always possible to explain what causes such selectivity of microhabitats, as the biology, ecology and range of the species involved are not always known. Information on the most abundant species in our study is presented below.
One species of mesostigmatic mite, H. racovitzai, was found at all four localities with a minimum frequency of 60% (Table I). This species clearly preferred the grass and lichen habitats, in which it showed a frequency of 80%. The largest number of individuals was recorded in grass turf (1023). In contrast, it did not prefer the moss microhabitat, as shown by its low abundance (59 individuals) and low frequency (3.5%; Table II). Hydrogamasellus racovitzai is a large, conspicuous mite, which has been found to be widely distributed throughout the Maritime Antarctic and has been recorded often in the sub-Antarctic (Convey & Quintana Reference Convey and Quintana1997, Convey & Smith Reference Convey and Smith1997).
Among mites belonging to Oribatida, A. antarcticus and M. l. longipilosa were found in the greatest numbers. Alaskozetes antarcticus is widely distributed in the Antarctic and sub-Antarctic region and has been recorded on, for example, the Antarctic Peninsula, the South Island of New Zealand and Antarctic islands (e.g. Adelaide, Anvers, Doumer, Greenwich, King George and Nelson; Wallwork Reference Wallwork1973, Convey & Quintana Reference Convey and Quintana1997, Starý & Block Reference Starý and Block1998, Russel et al. Reference Russell, Hohberg, Potapov, Bruckner, Otte and Christian2014).
Membranoppia l. longipilosa is an eurytopic and widely distributed species in the marine Antarctic (e.g. in the Antarctic Peninsula, South Shetland Islands, Ardley, Green, Darboux, Fauré, Anvers, Torgersen, Argentine, Livingston, King George, Danca, Nelson, Deception and Greenwich islands and Byers Peninsula (Wallwork Reference Wallwork1965, Reference Wallwork1967, Reference Wallwork1973, Buryn & Usher Reference Buryn and Usher1986, Usher & Edwards Reference Usher and Edwards1986, Pugh Reference Pugh1993, Richard et al. Reference Richard, Convey and Block1994, Starý & Block Reference Starý and Block1998).
Cryptopygus a. antarcticus was the most abundant species belonging to Collembola. Moreover, C. badasa, T. mixta, F. octooculata and F. antarctica were also numerous. Cryptopygus a. antarcticus is a eurytopic, hydrophilic and highly cold-tolerant species widely distributed in the Maritime Antarctic (including the South Shetland archipelago) that shows the greatest densities among the Antarctic Collembola (Broady Reference Broady1979, Bokhorst et al. Reference Bokhorst, Ronfort, Huiskes, Convey and Aerts2007, Schulte et al. Reference Schulte, Elnitsky, Benoit, Denlinger and Lee2008, Benoit et al. Reference Benoit, Elnitsky, Schulte, Lee and Denlinger2009, Greenslade et al. Reference Greenslade, Potapov, Russell and Convey2012, Russell et al. Reference Russell, Hohberg, Potapov, Bruckner, Otte and Christian2014, Enríquez et al. Reference Enríquez, Tejedo, Benayas, Albertos and Luciáñez2018).
Cryptopygus a. antarcticus was found at all four localities with a frequency of 100% (Table I). Moreover, it was dominant in all of them (80.7–99.1%; Table I). It clearly preferred grasses and mosses, in which it showed 100% frequency. It was collected less often in lichens (frequency 80%; Table II). This species lacks dehydration resistance (Block et al. Reference Block, Harrisson and Vannier1990), which explains its lower density in the lichen samples.
In turn, the other representative of the genus, C. badasa, was found at all of the studied localities, showing a highly variable frequency ranging from 26.7% to 73.3% (Table I). This species preferred lichens and mosses (60% frequency), while grasses were inhabited to a much lesser extent (35% frequency; Table II). Cryptopygus badasa was described from Livingston Island (the South Shetland archipelago) and then recorded from the western part of the Maritime Antarctic and South Georgia. It lives in soil and under moss and stones (Greenslade Reference Greenslade1995, Reference Greenslade2010, Russell et al. Reference Russell, Hohberg, Potapov, Bruckner, Otte and Christian2014, Enríquez et al. Reference Enríquez, Tejedo, Benayas, Albertos and Luciáñez2018).
The diversity of microarthropod communities is determined by the microhabitat selectivity of some species. Therefore, in future studies, sensors need to be used to monitor temperature and moisture content ranges throughout the year in order to precisely determine the effects of thermal and humidity conditions on invertebrate fauna. Moreover, investigations should be extended to include fungi and nematodes, for example, which may be present in the soil, since these organisms constitute the food base for the microarthropods reported in this study.
Acknowledgements
The study is dedicated to the memory of the late Prof Ziemowit Olszanowski, who helped to conduct it. The authors would like to thank Joachim Grzegorek for the construction of a portable Tullgren apparatus and Adam Latusek for his help in collecting the materials. The authors thank also Prof J.M. Behnke from the University of Nottingham (UK) for the linguistic proofreading of the text, as well as two anonymous reviewers for their feedback.
Financial support
This work was supported by the Poznan University of Life Sciences (Grant 506.217.02.00).
Competing interests
The authors declare none.
Author contributions
DJG: conceived the original idea and carried out the experiment, identified mesostigmatic mites and wrote the manuscript with the support from WN, DS, BZ; WN: identified oribatid mites; DS: identified springtails; BZ: performed statistical analyses.
Animal research (ethical approval)
The authors declare that they have not broken any rules regarding ethical animal research.