I. Introduction
Global climate change is a huge political, economic, and social challenge. One of the focal points in the context of climate change is agriculture, with its obvious implications for human health, local and global economies, and political stability. Agricultural production is largely dependent on a crop's ability tolerate and acclimate to stress. Changes in climate that lead to increased crop water use or decreases in water availability will increase the frequency and magnitude of plant water stress. This in turn requires the development of new more drought-tolerant cultivars or an increased dependence on irrigation to maintain crop productivity. Both of these strategies for addressing plant water stress present specific challenges.
In contrast to annual crops (e.g., wheat, corn, tomatoes), for which new plants are established seasonally, grapes are a perennial species. Once established, a vineyard is expected to develop and remain productive for many decades. The attributes of what constitutes a drought-tolerant cultivar are different for these two types of species. To be drought tolerant, an annual crop needs to maintain productivity for only a single season, whereas a perennial crop must tolerate and recover from stress year after year.
Accurately predicting the effects of climate change on winegrapes grown in specific geographic locations is difficult because of the complexity of both climate change and the plant's response (Ferrise et al., Reference Ferrise, Trombi, Moriondo and Bindi2015; Schultz, Reference Schultz2016; van Leeuwen and Darriet, Reference Van Leeuwen and Darriet2015). Water stress reduces berry size and yield and may lead to changes in fruit composition that either increase or decrease fruit quality, depending on the severity of the stress. The difficulties resulting from these variable responses extend to the relationships between climate and economic value (Ashenfelter and Storchmann, Reference Ashenfelter and Storchmann2016; Oczkowski, Reference Oczkowski2016) and underline the need for an extremely nuanced discussion of climate change and viticulture.
Both local and global markets tend to constrain the cultivars grown, and thus adapting to climate change through changing cultivar may not be an economically feasible option. This is why it is important to enhance the drought tolerance of existing cultivars through better management, modifying the cultivar directly, or modifying its behavior via grafting onto specific rootstocks.
This article is intended to introduce plant relations basics to the nonspecialist. It provides a basic overview of plant water use, focusing on how plant physiology is affected by water stress and laying the physiological foundation for a discussion of drought-tolerant cultivars and rootstocks.
II. Why Do Plants Need So Much Water?
Water availability is possibly the single most important factor in determining plant growth and crop productivity, and, as with most crops, grape production decreases in response to water stress (e.g., Grimes and Williams, Reference Grimes and Williams1990; Hardie and Considine, Reference Hardie and Considine1976; Matthews and Anderson, Reference Matthews and Anderson1989; Medrano et al., Reference Medrano, Escalona, Cifre, Bota and Flexas2003). Given water's importance to the plant, it is surprising that only a small percentage (~5%) is used or stored. The vast majority of the water passes directly through the plant and into the atmosphere, a process known as transpiration. But why would the plant seemingly waste so much water?
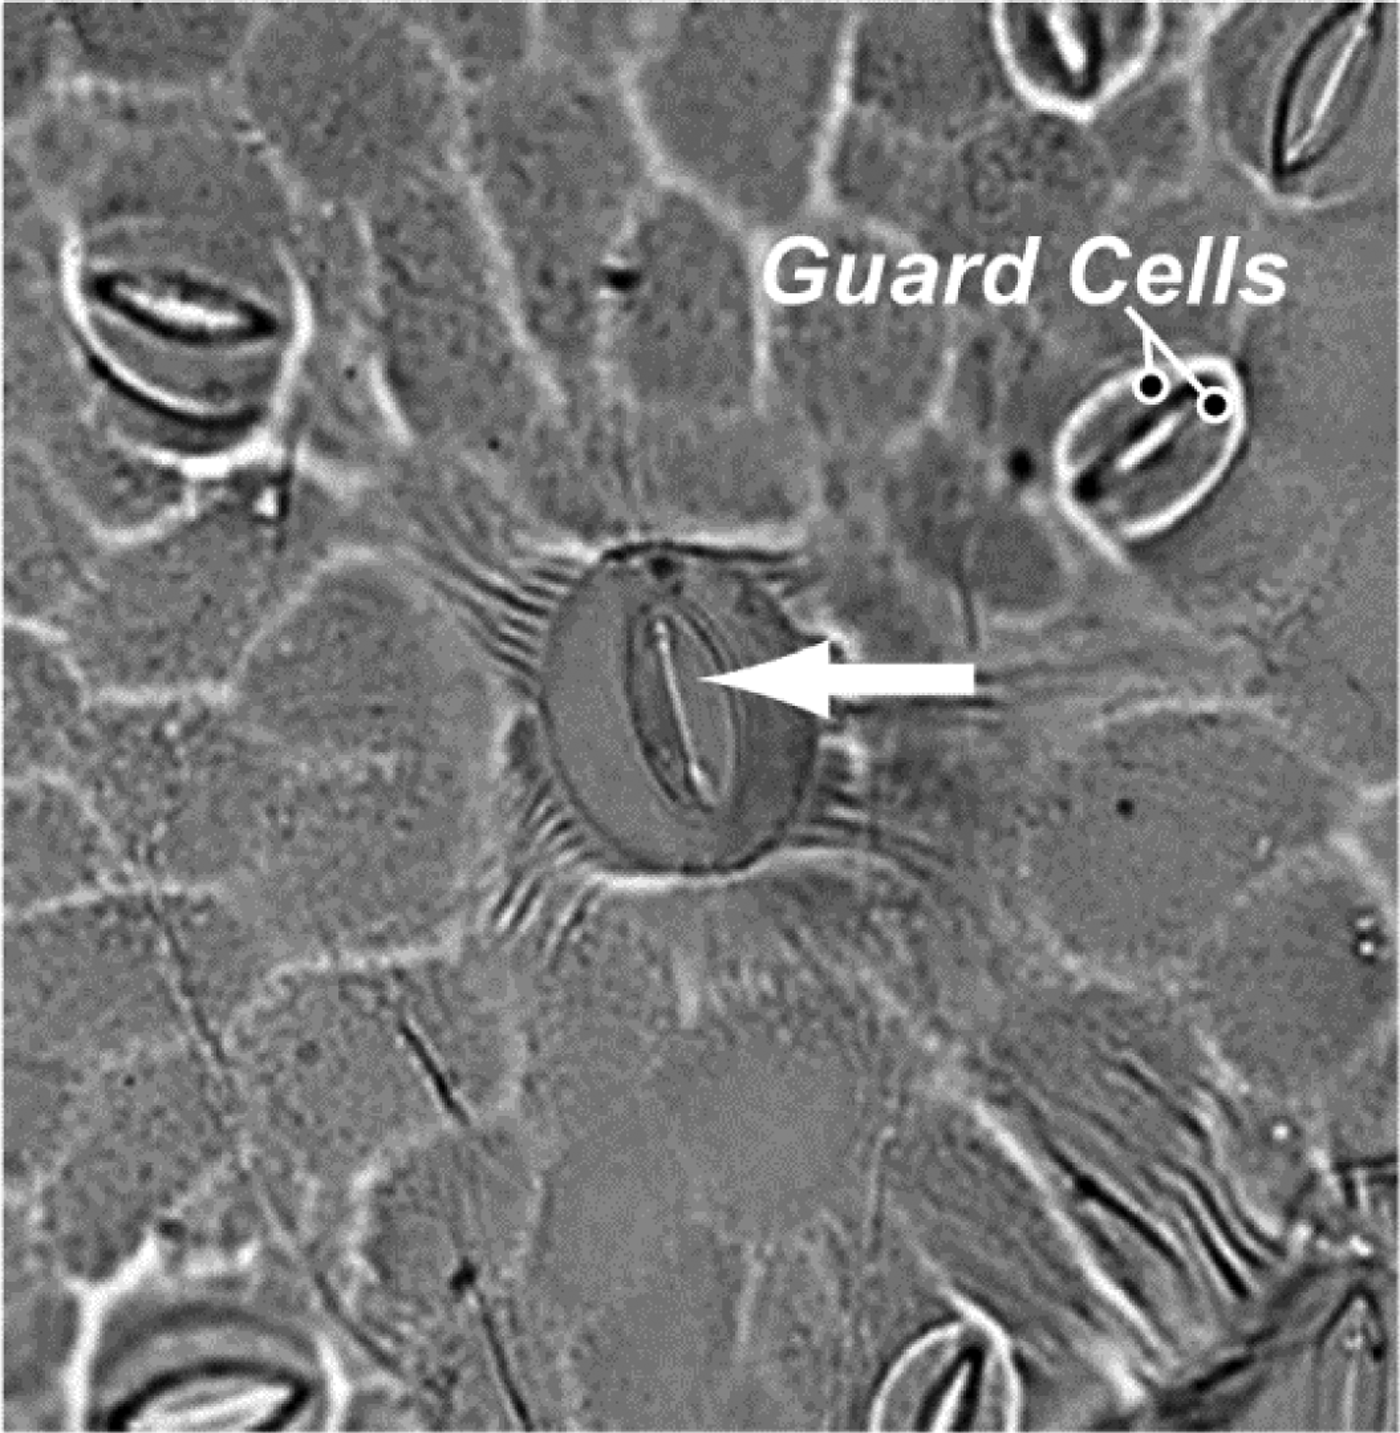
Photosynthesis is the process in which a plant captures carbon from carbon dioxide (CO2) gas and builds sugars, and although small amounts of water play an essential role in photosynthesis, it is really the plant's need to acquire CO2 that drives water loss via transpiration. Grapevines and other plants take up CO2 through tiny pores on the underside of leaves, called stomata (Figure 1). These tiny pores are formed through the organization of two adjacent cells (guard cells), and the plant has the ability to open or close each pore (Berry et al., Reference Berry, Beerling and Franks2010; Hetherington and Woodward, Reference Hetherington and Woodward2003). Under optimal conditions, these pores are completely open, which allows the plant to take up CO2 at a maximal rate. However, the pores are also an avenue for water loss. Water inside the leaf is at 100% humidity, and, combined with the fact that molecules of water diffuse somewhat faster than those of CO2, this causes the plant to lose water at a much greater rate than it takes up CO2. At times, the ratio can be greater than 1,000-fold in favor of water loss; that means that the plant loses more than 1,000 molecules of water for every molecule of CO2.
Light Microscopy Image of Grapevine Stomata

Grape vines use an enormous amount of water. In one study of table grapes in California's Central Valley, each vine used approximately 5,000–7,000 liters of water over the course of a single season (Williams and Ayars, Reference Williams and Ayars2005). This reality forms the foundation for plant water relations; for the sake of their survival and productivity, plants have to take up carbon, but transpiration results in large water losses, which, under limiting conditions, lead to water stress.
III. How Does Water Move Through Plants?
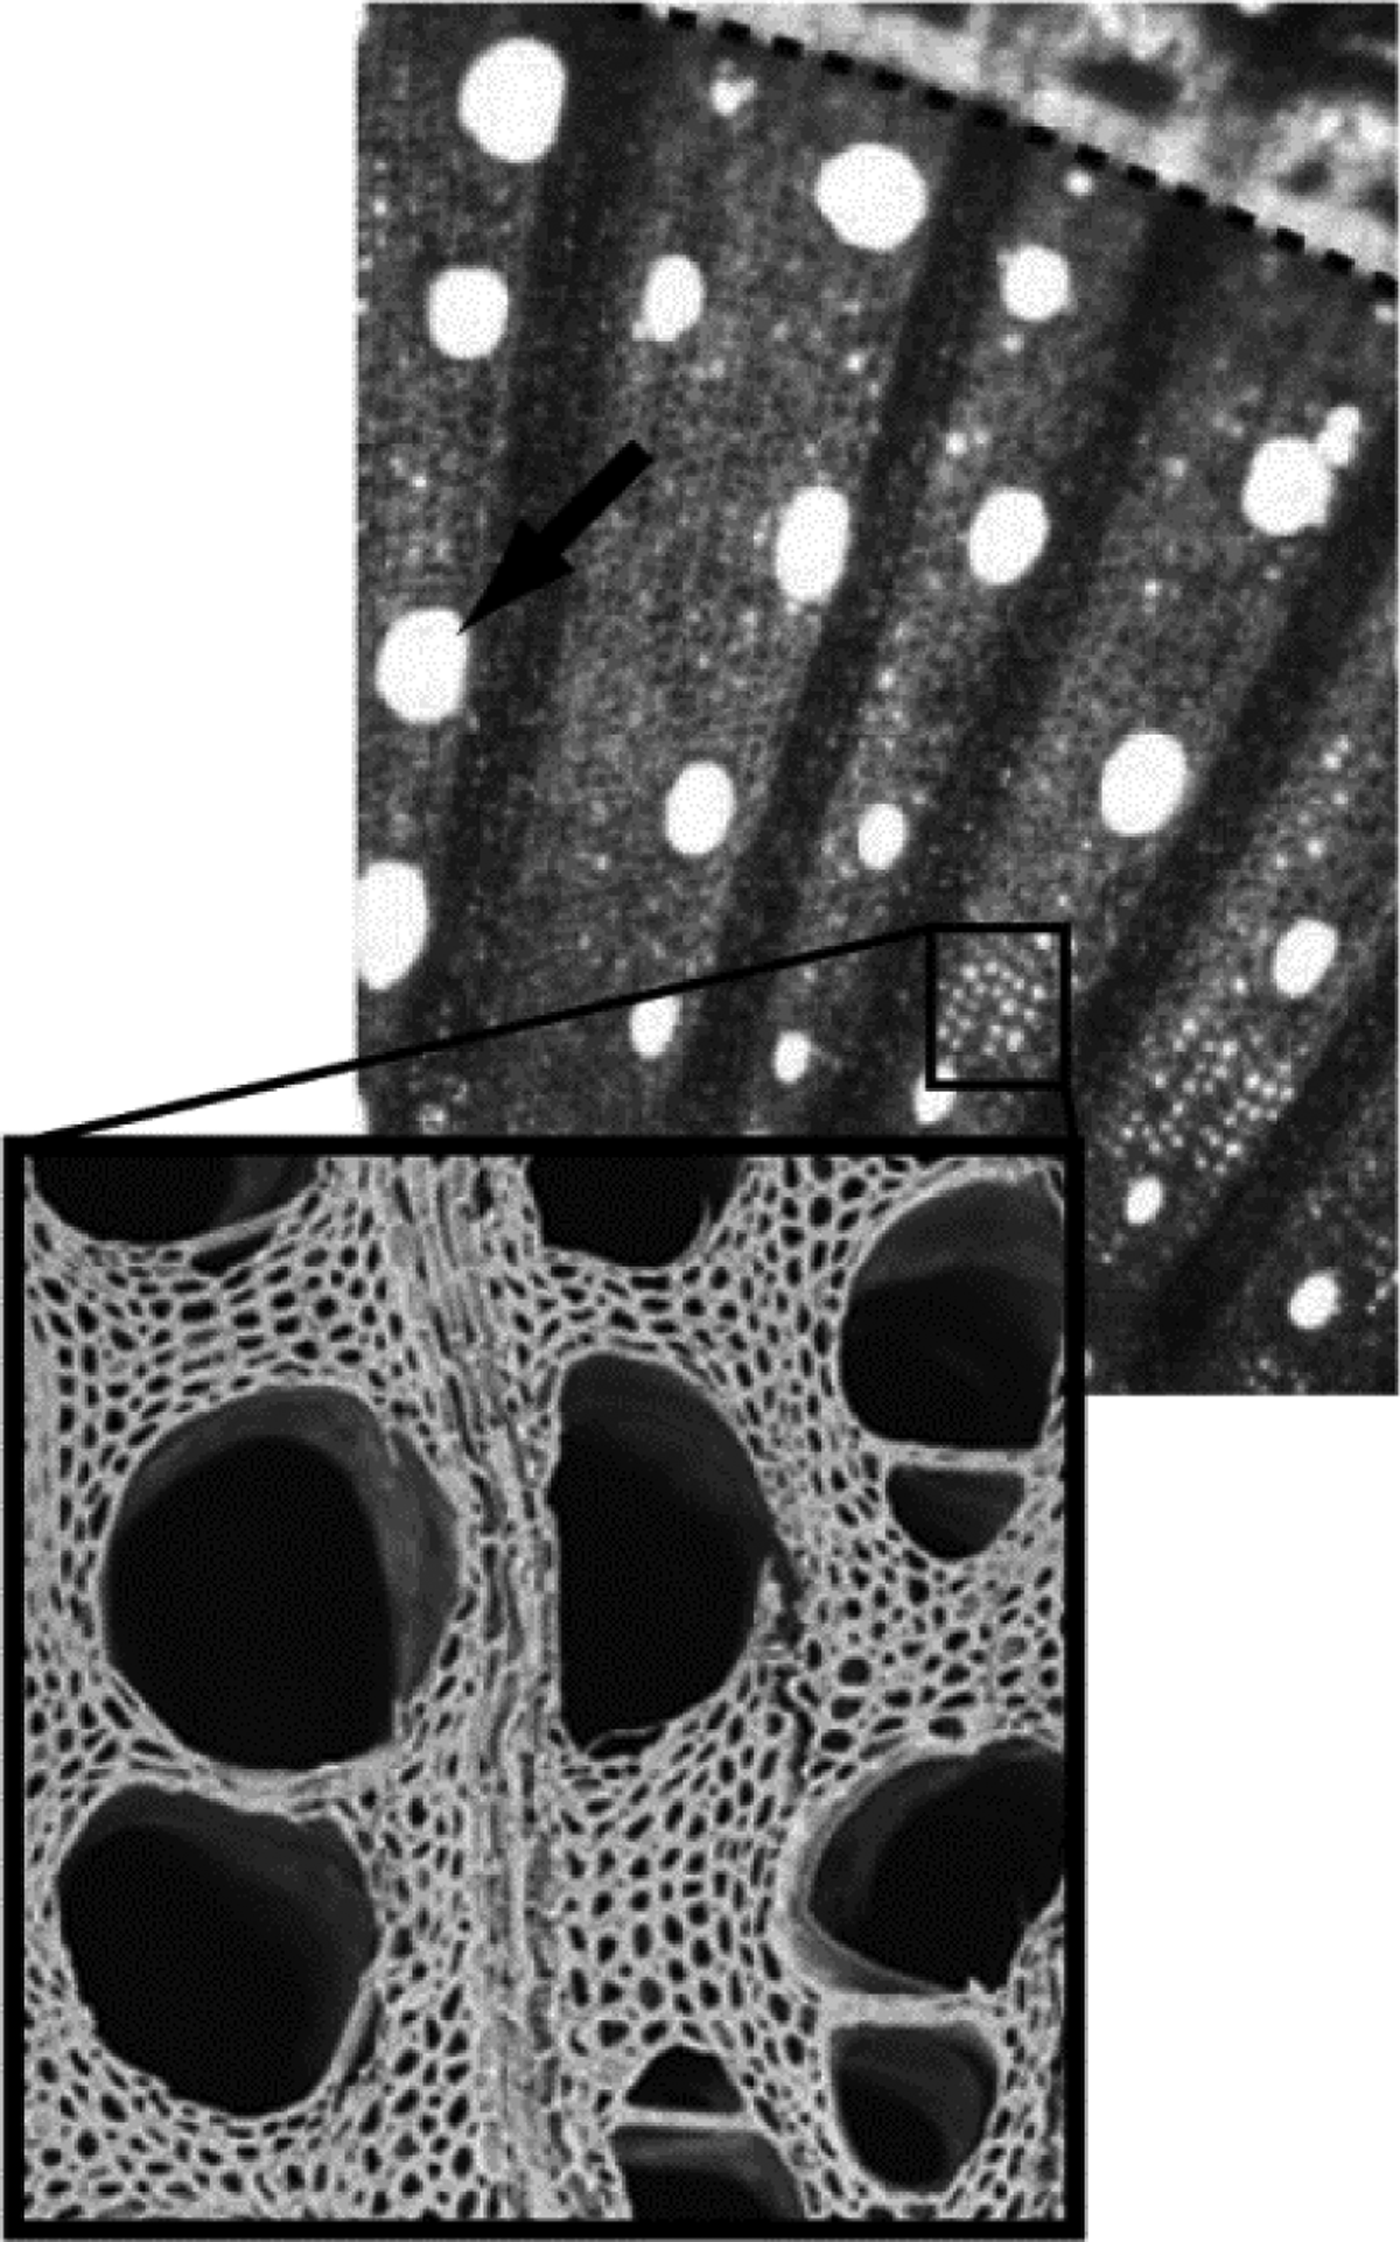
Plants have a highly integrated and complex vascular system, which consists primarily of two types of tissue (Lucas et al., Reference Lucas, Groover, Lichtenberger, Furuta, Yadav, Helariutta, He., Fukuda, Kang, Brady, Patrick, Sperry, Yoshida, López-Millán, Grusak and Kachroo2013). One is the xylem, typically made up of cells that are dead and empty at maturity and resemble a series of pipes—these pipes are referred to as xylem vessels (Figure 2). The other is phloem, a series of living cells that are connected end to end by small pores. Phloem is the tissue that transports primarily sugar throughout the plant while xylem transports water and other solutes.
Light and Scanning Electron Microscopy Images of Grapevine Xylem
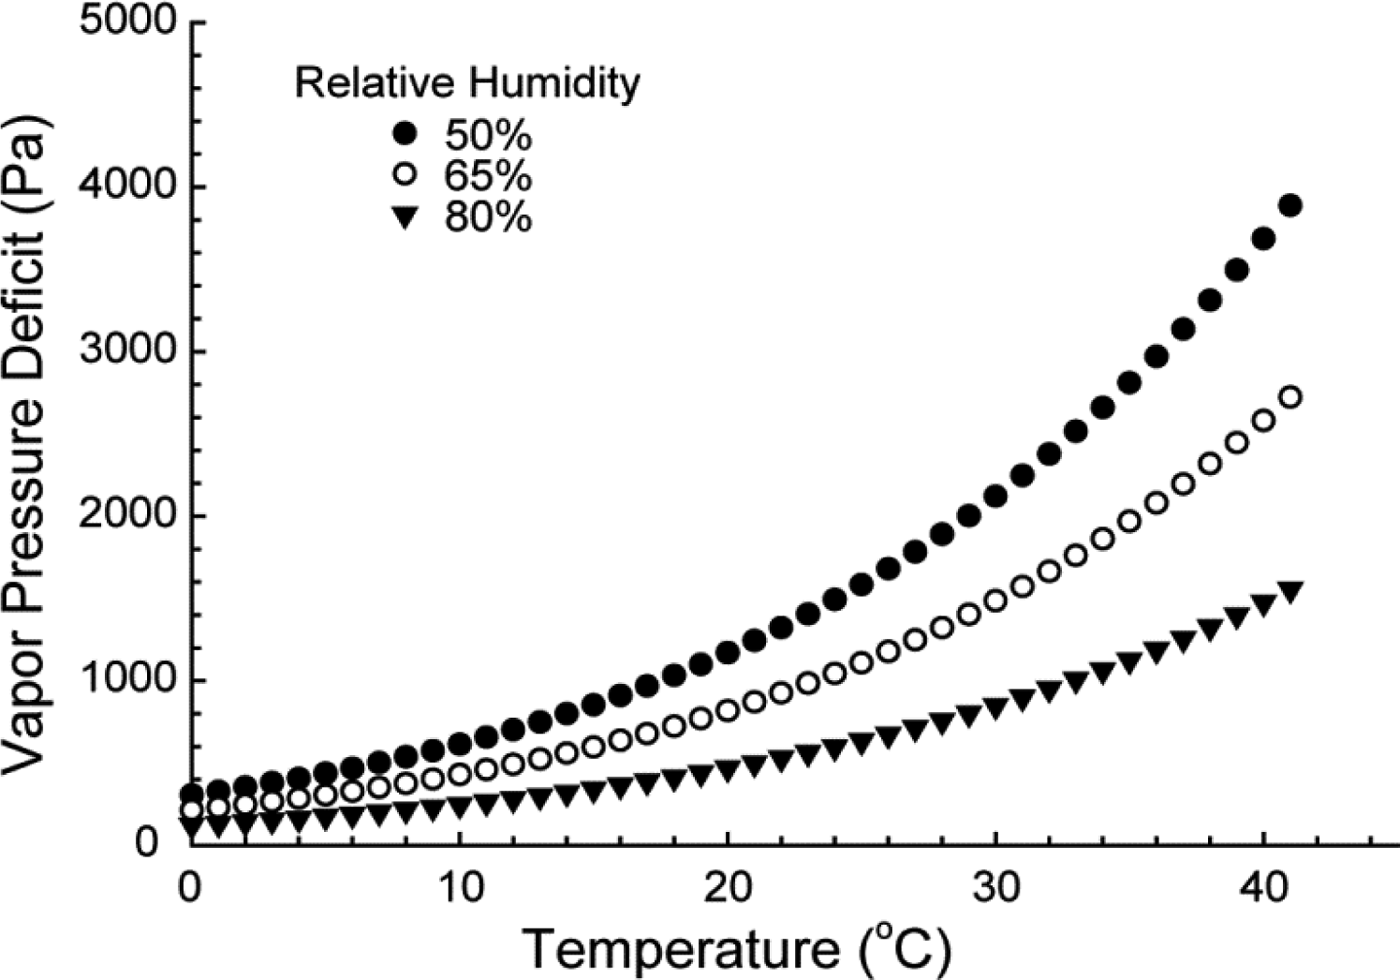
The movement of water through the plant begins with evaporation from the leaf. The vapor pressure deficit (VPD) at the leaf surface drives this evaporation. In the context of global climate change, it is important to consider that VPD is dependent on both temperature and relative humidity (Figure 3). All things being equal, any change in climate that leads to an increase in VPD will increase plant water use. The water that evaporates from the leaf must be replaced, and thus water is pulled from the leaf vasculature, through the stem, through the root, and eventually from the soil. For the majority of this journey, water is transported through xylem vessels (McElrone et al., Reference McElrone, Choat, Gambetta and Brodersen2013). The initial movement of water from the leaf vasculature through the stomata and the final movement of water from the soil into the root vasculature are the only portions of the pathway where water moves predominantly across tissue.
Examples of the Relationship Between Vapor Pressure Deficit (VPD) and Temperature at Three Different Levels of Relative Humidity
Water flow in plants is driven by pressure gradients (Boyer, Reference Boyer1985). During the day, transpiration is driven by the VPD at the leaf surface. This type of gradient is referred to as a hydrostatic pressure gradient. The most tangible example of a hydrostatic pressure gradient is the human heart, which creates positive pressure via muscle contractions that push blood through our bodies. In contrast, as a plant transpires, the VPD at the leaf surface pulls water through the plant via negative pressure (i.e., tension). This negative pressure is perpetuated through the plant because of water's cohesive quality—that is, it bonds to itself very strongly. The mechanism driving water movement through plants is referred to as the cohesion-tension mechanism for this reason.
Within the plant, other pressure gradients exist. Differences in solute concentration between cell and tissue compartments create osmotic pressure gradients, which are necessary for critical plant processes, such as cell turgor pressure and growth. An important point to remember is that osmotic pressure gradients require the presence of a “semipermeable” membrane—a membrane that is highly permeable to water but not solutes.
The sum of all the pressure gradients present is expressed as water potential (Ψ). So, saying that water flow is driven by pressure gradients is equivalent to saying that water flow is driven by differences in water potential (i.e., water potential gradients: ΔΨ) and vice versa. The tension in a plant is expressed as stem water potential (Ψwstem). The value is always a negative number expressed in units of pressure. So a value of Ψwstem = –0.1 megapascals (MPa) is the equivalent of saying that the tension in the plant is –0.1 MPa. As plants become stressed, this value becomes increasingly negative. In other words, the tension in the plant becomes greater and greater.
These pressure gradients are highly dynamic in time and space and across development. Generally, the most prominent gradient during the day is the hydrostatic gradient driving transpiration, but at night the situation changes. In the absence of transpiration, osmotic pressure gradients become dominant, and this diurnal fluctuation between these two types of gradients has profound effects on the response and recovery to water stress.
IV. What Happens Under Water Stress?
Plants have to take up carbon, but when their stomata are fully open during the day, the VPD at the leaf surface drives large water losses. When water is limited in the soil, plants become water stressed, leading to decreases in transpiration, photosynthesis, plant growth, crop yields, and, when severe, irreversible harm and death. But what exactly does this mean: what is the nature of this stress, and how does it negatively affect the growth and physiology of the plant?
In soils, water resides in tiny pores within and between soil particles (Whalley et al., Reference Whalley, Ober and Jenkins2013). The force required to pull the water from soil is a function of the size of the pores currently holding the water. In fully saturated soil, water is removed from the largest pores first, and as the soil dries, the water that remains requires more and more force to extract. As a result, the tension in the plant also increases as the soil dries, and thus Ψwstem becomes increasingly negative. This increase in the negative pressure within the plant is the physical cause of the stress.
Even at relatively mild levels of water stress, cell turgor pressure decreases (Hsiao, Reference Hsiao1973). Plant cells have internally positive pressure (i.e., turgor) because of the difference in solute concentration between the cell and its surroundings. Under water stress, the increasingly negative Ψwstem leads to water loss from cells and decreases in turgor pressure. This decrease in turgor pressure is the reason plants wilt under water stress. Cell turgor pressure not only contributes to a plant's structure, but is also essential for growth. In grapevine specifically, decreased growth is one of the earliest effects of water stress (Schultz and Matthews, Reference Schultz and Matthews1993).
As water stress worsens, the plant will begin to close its stomata. This has the positive effect of decreasing transpiration and moderating the tension in the plant, but at the cost of decreasing CO2 uptake and photosynthesis. If the stress worsens, eventually the plant will completely close its stomata, halting CO2 uptake and photosynthesis completely. The closure of stomata is both reversible and tightly controlled. Thus the plant can control the extent to which it limits transpirations in relation to the severity of the stress, and, if conditions improve, the plant can reopen its stomata to restore maximal CO2 uptake and photosynthesis.
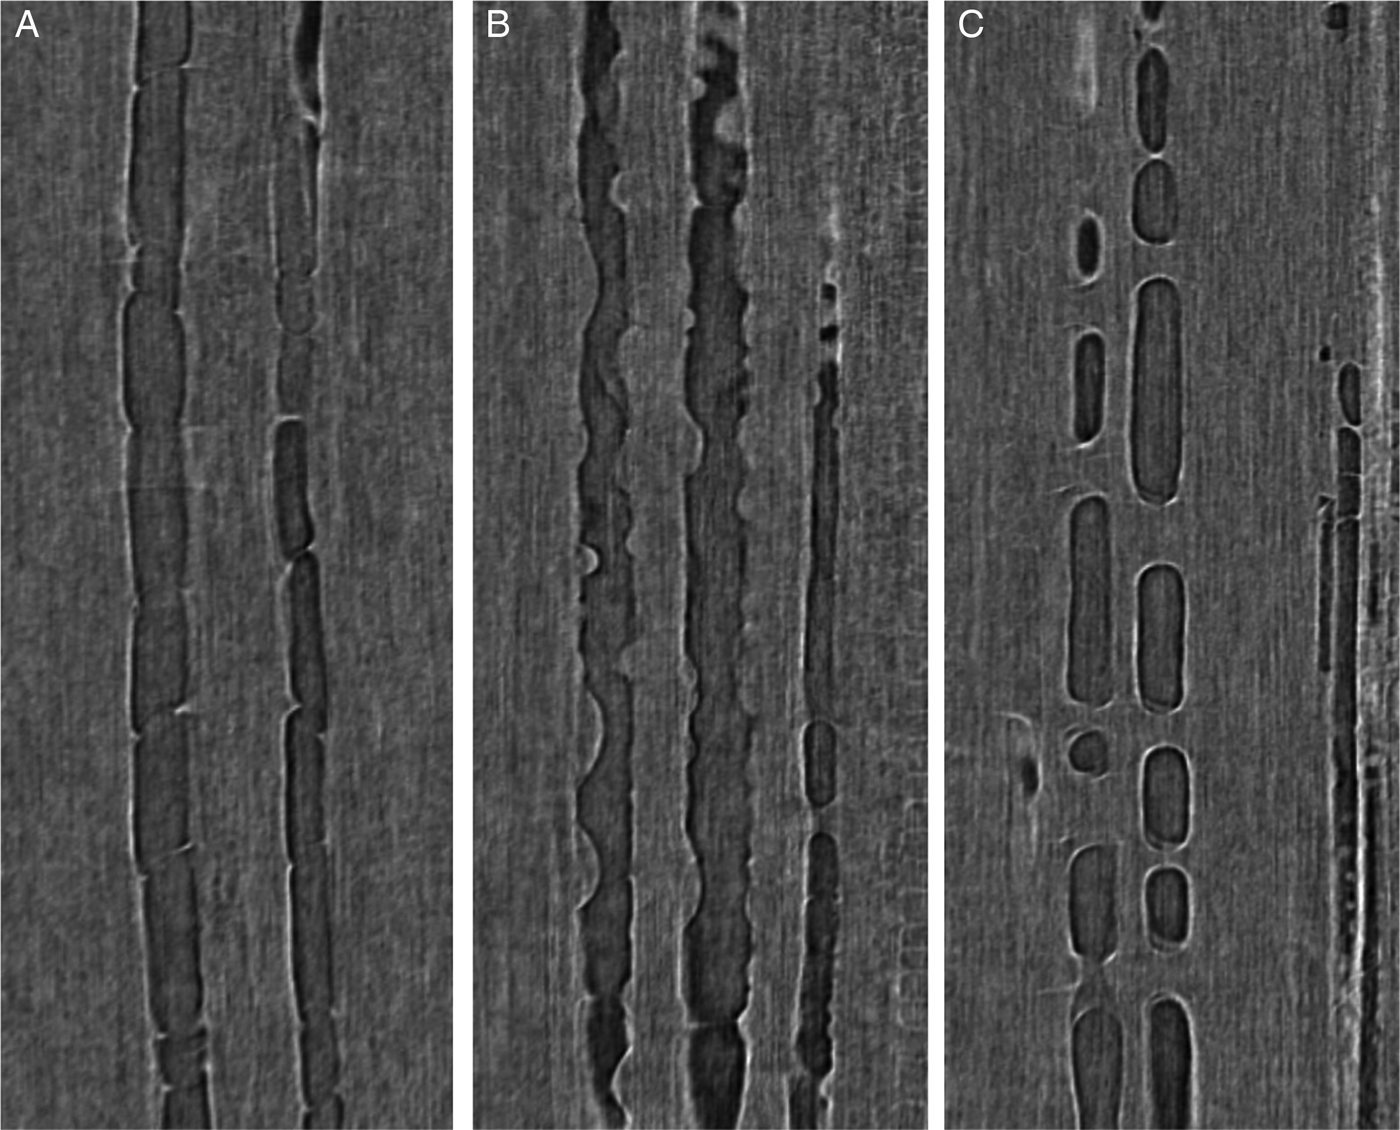
If severe levels of water stress persist, water transport through the plant can be temporarily, or permanently, disrupted. Water movement through the plant results from the cohesion of water to itself. These bonds are very strong, but, under severe water stress, the tension can become great enough to break the cohesive forces sustaining the column of water and cause what is known as cavitation (Tyree and Sperry, Reference Tyree and Sperry1989). Cavitation results in the formation of a gas bubble, or embolism, within the xylem vessel (Figure 4A). Once the vessel is filled with gas, it can no longer transport water. The decrease in a plant's ability to transport water is known as a loss of hydraulic conductivity. The extent of embolism can increase either through more cavitation or the spread of existing embolism from xylem vessel to xylem vessel. If embolism becomes extensive enough, the loss of hydraulic conductivity can approach 100%; at this point, water transport is completely disrupted. Unless it is reversed, a significant loss of hydraulic conductivity will lead to plant death (Barigah et al., Reference Barigah, Charrier, Douris, Bonhomme, Herbette, Améglio, Fichot, Brignolas and Cochard2013; Brodribb and Cochard, Reference Brodribb and Cochard2009; Brodribb et al., Reference Brodribb, Bowman, Nichols, Delzon and Burlett2010).
Observation of Xylem Embolism Repair in Vitis from in vivo 3D High-Resolution Computed Tomography Reconstructions
These are some of the major effects of water stress on grapevines. Others include premature leaf death, shoot dieback, and increased susceptibility to, and severity of, disease. These complex and varied physiological responses to water stress provide the context for developing drought-tolerant cultivars and rootstocks.
V. What Is Drought Tolerance?
With respect to global climate change, the development of new drought-tolerant cultivars and rootstocks is an obvious priority. One of the most pressing questions is what physiological traits the ideal drought-tolerant cultivar or rootstock needs to possess. As explained above, answering this question for annual crop species is relatively straight forward, but for perennial crops such as grapes, the qualities constituting drought tolerance are more complicated. Obviously, any drought-tolerant cultivar must be able to reverse the ameliorate in yield due to stress. However, one added consideration for perennial crop species is their long-term tolerance to the stress. It is not enough for a grape cultivar to sustain yields under water stress in a single season if it results in a degradation of vine performance over many seasons.
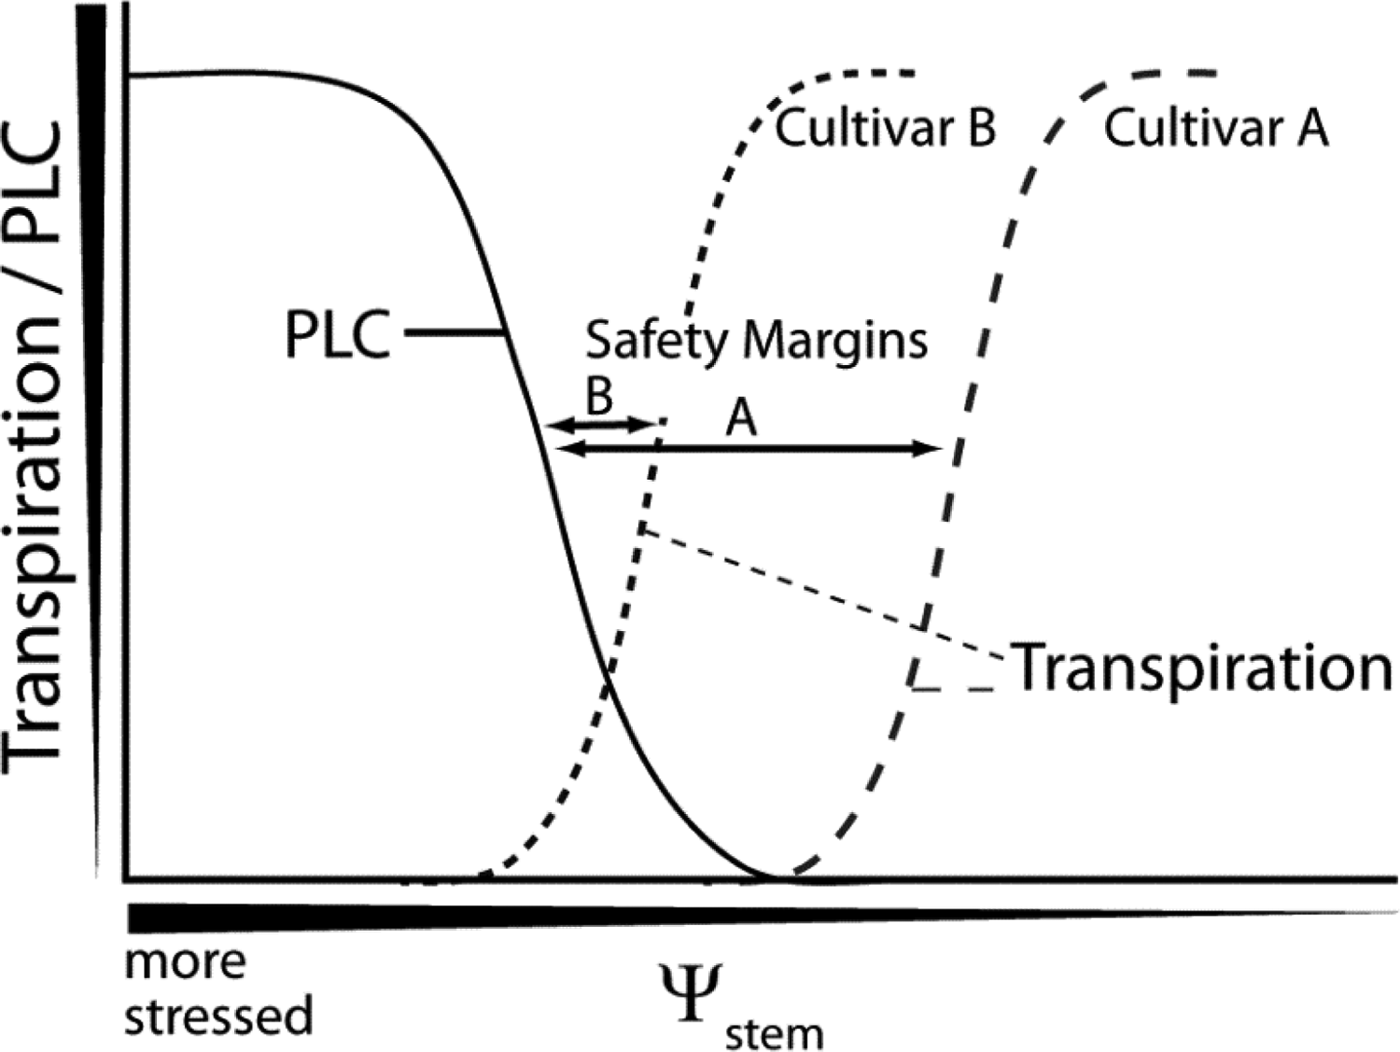
Plants close stomata and decrease transpiration in response to water stress, moderating the tensions in the plant that can result in embolism and loss of hydraulic conductivity, but at the expense of decreased photosynthesis, growth, and yields. At the same time, extensive loss of hydraulic conductivity can permanently harm or even kill the plant. So the question becomes: what is the relationship between the level of stress at which a cultivar stops transpiring, compared to the level of stress at which a cultivar suffers from a significant loss of hydraulic conductivity (Figure 5). The distance in Ψwstem between these two levels of stress is known as the “safety margin” (Delzon and Cochard, Reference Delzon and Cochard2014). Take the fictional example presented in Figure 5. Cultivar A has a very large safety margin; it decreases transpiration to zero prior to reaching a Ψwstem that results in any loss of conductivity. By contrast, cultivar B has almost no safety margin. It maintains significant transpiration even at stress levels resulting in a significant loss of hydraulic conductivity. This illustrates the trade-off associated with sustaining maximal transpiration levels even under severe stress. At the same time, perhaps the safety margin for cultivar A is too great; the cultivar decreases transpiration prematurely, thus negatively affecting production unnecessarily.
Relationship Between the Level of Stress, Transpiration, and the Loss of HydraulicConductivity
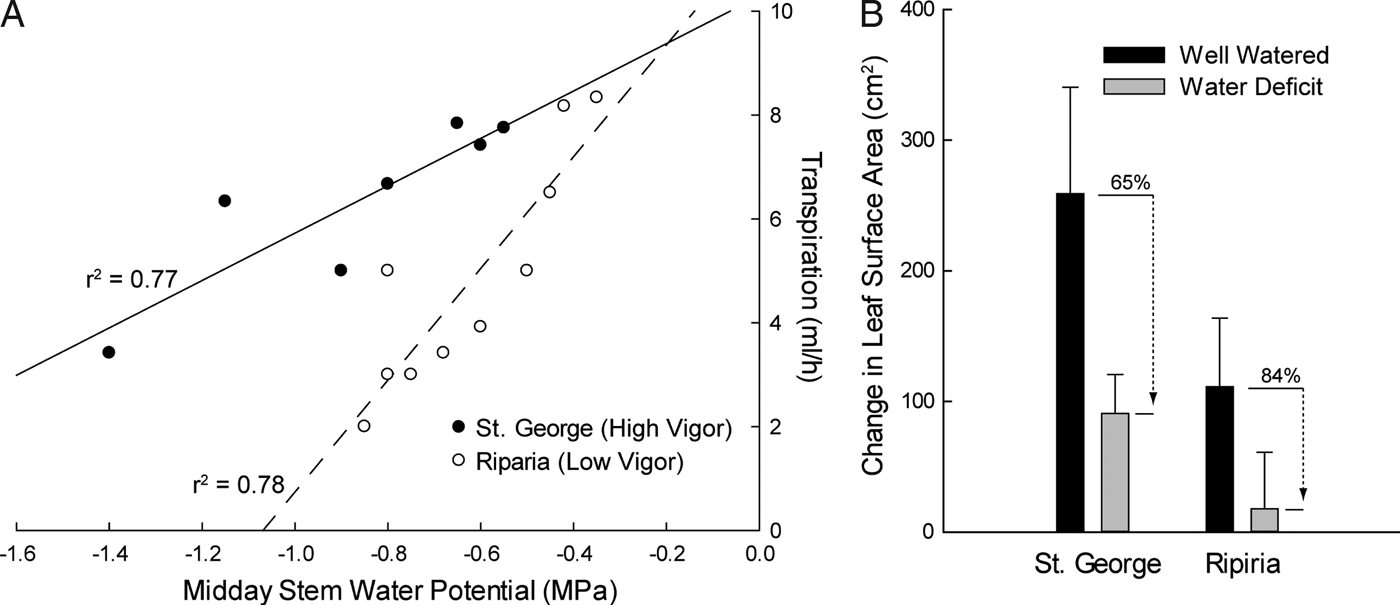
As in this example, studies in grapevine have demonstrated that particular cultivars differ in their response to water stress (Pou et al., Reference Pou, Medrano, Tomas, Martorell, Ribas-Carbo and Flexas2012; Schultz, Reference Schultz2003; Vandeleur et al., Reference Vandeleur, Mayo, Shelden, Gilliham, Kaiser and Tyerman2009). A cultivar that tends to close its stomata and decrease transpiration at mild stress levels, maintaining a more constant Ψwstem, is referred to as isohydric. In contrast, an anisohydric cultivar sustains maximal transpiration levels even under severe stress, subjecting itself to more negative Ψwstem levels. For example, different rootstock genotypes exhibit differences in transpiration as a function of stress (Figure 6A), but again decreasing transpiration can negatively affect growth (Figure 6B). One recent study on grapes investigating rootstock effects on transpiration suggests that there is a genetic basis for these differences in behavior (Marguerit et al., Reference Marguerit, Brendel, Lebon, Van Leeuwen and Ollat2012). This raises the likelihood that transpiration responses to water stress may be controlled through traditional breeding approaches or even grafting a cultivar onto a specific rootstock.
Differences in Transpiration and Growth Between Rootstock Varieties Under Stress
To some extent, being drought tolerant means maintaining transpiration under stress where there is a real danger of extensive loss of hydraulic conductivity. But what if the plant had the ability to repair itself and, to some extent, restore that lost hydraulic conductivity? This would allow the plant to maintain transpiration even if it meant sustaining some loss of hydraulic conductivity because the plant simply repaired itself. There is evidence in several perennial species, including grapes, that plants do repair themselves and restore lost hydraulic conductivity (Ameglio et al., Reference Ameglio, Decourteix, Alves, Valentin, Sakr, Julien, Petel, Guilliot and Lacointe2004; Brodersen et al., Reference Brodersen, Mcelrone, Choat, Matthews and Shackel2010; Tyree and Yang, Reference Tyree and Yang1992; Zufferey et al., Reference Zufferey, Cochard, Ameglio, Spring and Viret2011).
At times there is no transpiration, thus no tension, within the plant: diurnally at night and, for deciduous species like grape, seasonally, in the winter. At these times, the plant can actually produce positive osmotic pressure via the difference in solute concentration between the water in the soil and the root. This positive pressure is referred to as root pressure. Under this positive pressure, embolized xylem vessels can be refilled with water, restoring the function of the vessel (Figure 5). Many questions remain regarding the frequency and effectiveness of these repair mechanisms, including variability across species and cultivars. Nevertheless, recovery and repair clearly play a critical role in defining a drought-tolerant cultivar.
VI. Is Irrigation a Sustainable Solution?
Irrigation is the most straightforward solution to plant water stress, but is irrigation at a level sufficient to prevent or alleviate water stress sustainable? In areas where water is abundant, irrigation is a feasible option, but excess irrigation can lead to other problems, such as increased soil salinity. In contrast, many grape-growing regions around the globe experience periodic water limits, suggesting that irrigation may not be a sustainable solution. In 2014, drought conditions in California led to a reduction of approximately 25–35% in surface-water availability for agriculture (Howitt et al., Reference Howitt, Medellin-Azuara, MacEwan, Lund and Sumner2014). Approximately 77% of this shortfall was compensated for by groundwater at an estimated cost of almost $500 million. Using groundwater to compensate for surface-water reductions at such a magnitude is not sustainable. The Australian winegrape-growing regions have endured similar periods of extreme drought during the past decade (Murphy and Timbal, Reference Murphy and Timbal2008), resulting in decreased fruit yields and increased water costs.
It is widely recognized that a mild degree of water stress increases fruit quality, especially of red winegrape varieties, in which it increases berry flavonoid content (Kennedy et al., Reference Kennedy, Matthews and Waterhouse2002). This is why in dry regions, it is common to manage irrigation in order to induce mild degrees of water stress. In wetter regions, it may be that changes in climate that result in increased vine water stress are beneficial for fruit quality. For example, in the Bordeaux region, where irrigation is prohibited by law except during vine establishment, wine quality ratings tend to be positively associated with the degree of water stress (van Leeuwen and Darriet, Reference Van Leeuwen and Darriet2016; van Leeuwen et al., Reference Van Leeuwen, Tregoat, Choné, Bois, Pernet and Gaudillère2009). However, in the Bordeaux region, irrigation has been allowed during a few periods of extreme drought. It is still not entirely clear under what circumstances (i.e., magnitude, duration, timing) water stress ceases to benefit fruit quality and becomes detrimental.
One could foresee irrigation strategies that complement the behavior of drought-tolerant cultivars through employing irrigation only during periods of stress that have the potential to affect fruit yields or vine health seriously. Currently used irrigation strategies, such as regulated deficit irrigation, already employ a similar logic, in which grapevines are purposefully subjected to mild degrees of water stress only during periods shown to maximize increases in fruit quality while minimizing decreases in yield.
VII. Conclusion
As the global climate change becomes more severe, adapting viticulture to the changing climate will be extremely important. In areas where climate change results in higher temperatures or water scarcity, managing water stress will become a critical aspect of vineyard management. Developing drought-tolerant cultivars in the context of a perennial crop species like grapes is complex and will likely result from the integration of multiple traits and physiological processes. There may not be a perfectly drought-tolerant grape cultivar but, rather, optimal drought tolerance may result from a balance among maintaining productivity, optimizing the safety margin, and having a strong ability to recover from severe water stress.