


Every 2 years, voters go to the polls and elect individuals to represent them in American legislatures. Once elected, little constrains officeholders’ behavior, but if these representatives govern irresponsibly, they can be replaced. By providing voters opportunities to hold those in power accountable, American elections establish a fundamental connection between citizens and elites that can motivate elected officials to act in the interests of those they represent (Federalist 52).
The electoral connection underlies canonical explanations of legislative behavior, particularly in Congress (e.g., Fenno Reference Fenno1978; Mayhew Reference Mayhew1974a; Cox and McCubbins Reference Cox and McCubbins1993). Studies of American elections and accountability in turn focus on the electoral implications of congressional representation (e.g., Canes-Wrone et al. Reference Canes-Wrone, Brady and Cogan2002; Carson et al. Reference Carson, Koger, Lebo and Young2010; Jacobson Reference Jacobson1993). Most American lawmaking, however, does not occur in Washington, DC. For every law that Congress passes, state legislatures pass over a hundred (Justice Reference Justice2015). States regulate the economy, provide health care, and even shape immigration policy. Theoretically, electoral competition should pressure both national and state legislators to produce representative policies (Downs Reference Downs1957; Ferejohn Reference Ferejohn1986; Erikson, Wright, and McIver Reference Erikson, Wright and McIver1994), but Congress and state legislatures differ along many confounding dimensions, limiting the extent to which Congressional findings necessarily translate to subnational legislative bodies.
Despite state legislatures’ policymaking powers, political scientists know surprisingly little regarding the electoral consequences of state legislative representation. The most extensive analyses of a state legislator’s dyadic representation only study a single election year (Birkhead Reference Birkhead2015) or two elections in less than a third of states (Hogan Reference Hogan2004, Reference Hogan2008).Footnote 1 Each of these studies exclusively uses summary measures of legislative behavior (e.g., interest group scores), and I am unaware of existing research that investigates the electoral implications of individual roll-call votes taken in the state legislature.
To provide a more comprehensive account of accountability in American legislatures, I assemble the largest collection of district-level measures of public opinion and legislator ideology to evaluate the electoral consequences of state legislators’ ideological representation along with their individual roll-call votes. I find that some legislators have electoral incentives to represent their districts, and conditions surrounding elections, such as increased media coverage and competitive political environments, can promote levels of accountability. My findings, however, suggest state legislative incumbents pay a smaller electoral price for ideologically extreme representation than their Congressional counterparts. Focusing on the implications of individual roll-call votes, I find that, on average and in most cases, there is little relationship between voters’ opinions of legislators’ roll-call positions and vote share. While I provide evidence of accountability for some legislators under some conditions, the weak electoral connections I find between voter and legislator behavior bring into question whether key assumptions that underlie predominant theories of legislative and electoral behavior meaningfully apply to the “laboratories of democracy.” More importantly, my findings raise normative concerns about the levels of accountability in American legislatures.
HOLDING LEGISLATORS ACCOUNTABLE
American legislatures pose a dilemma common to many representative bodies. Once in office, little constrains state legislators’ behavior, introducing the risk of undesirable policymaking. Theories of elections suggest that the ballot box offers a potential solution to this moral hazard problem. The threat of being thrown out of office can create incentives for legislators to represent their constituents (Ferejohn Reference Ferejohn1986; see also Fearon Reference Fearon1999), and Downsian logic suggests that legislators who exhibit ideological moderation or cater to the median voter will receive higher vote shares, all else equal.
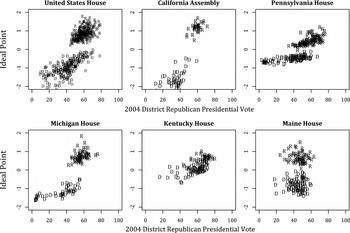
In addition to electoral pressures, party obligations, interest groups, and personal policy preferences also weigh upon legislators’ decision-making (Fenno Reference Fenno1978; Kingdon Reference Kingdon1989; Hall and Wayman Reference Hall and Wayman1990). These cross pressures are partly responsible for the findings that legislators shirk or do not always appear to represent the median voter (see Bender and Lott Reference Bender and Lott1996 for a review). The top left panel of Figure 1 illustrates an example of ideological incongruence between voters and their representatives in the U.S. House. Using ideal point estimates from 2004, this panel shows that conservative members of Congress generally represent districts that supported Bush, but many ideologically dissimilar members represent constituencies with similar political opinions, implying that at least some federal legislators are out of step with their districts.
U.S. and State House Representation

Political scientists often find that members of Congress face electoral ramifications for unrepresentative behavior. There is evidence that voters sanction their representatives for unpopular roll-call votes concerning the budget, congressional salaries, or health care (Jacobson Reference Jacobson1993; Clark Reference Clark1996; Nyhan et al. Reference Nyhan, McGhee, Sides, Masket and Greene2012) and that ideologically extreme members receive lower vote shares (Canes-Wrone, Brady, and Cogan Reference Canes-Wrone, Brady and Cogan2002; Carson et al. Reference Carson, Koger, Lebo and Young2010; Ladewig Reference Ladewig2010). While members of Congress are not punished for all votes (e.g., Bovitz and Carson Reference Bovitz and Carson2006) and finding evidence of accountability is more likely under certain political conditions (e.g., Ansolabehere, Snyder, and Stewart Reference Ansolabehere, Snyder and Stewart2001), studies of Congress generally support the proposition that some degree of district-level accountability exists at the federal level.
Similar to the patterns illustrated in the top left panel of Figure 1, the other panels of this figure suggest that many state legislators are out of step with their districts. For nearly every Republican state legislator in Maine, Michigan, and Kentucky, there is a Democrat from a district that is comparably supportive of Bush. Given findings from U.S. House elections, one may expect state legislators to face electoral consequences for poor representation. However, there are key differences in the informational and political contexts surrounding state and federal elections that can make it relatively more difficult for some voters to identify and remove unrepresentative state legislators from office.
The media, for example, can be a critical player in promoting electoral accountability (Arnold Reference Arnold2006), but state legislators get little attention from the fourth estate. State legislators receive less than a fourth of the amount of local television news coverage of Congressional elections (Kaplan, Goldstein, and Hale Reference Kaplan, Goldstein and Hale2003; see also Gierzynski and Breaux 1996), and according to the American Journalism Review and Pew Research Center, the number of full-time newspaper reporters devoted to state government has declined by over a third since 2003 (Enda, Matsa, and Boyles Reference Enda, Eva Matsa and Boyles2014). Many legislators are aware that few pay them much attention. Nicholas Carnes and coauthors asked over 1,000 state legislators if they agreed with certain statements regarding the media and voters. Only 51% agreed with the statement that the “news media generally pay close attention to elected officials’’ (Broockman et al. Reference Broockman, Carnes, Crowder-Meyer and Skovron2012). Lack of media attention is partly responsible for voters’ limited knowledge concerning state government (Songer Reference Songer1984; Patterson, Ripley, and Quinlan Reference Patterson, Ripley and Quinlan1992; Delli Carpini, Keeter, and Kennamer Reference Delli, Keeter and Kennamer1994).
Voters additionally are more likely to be informed and respond to campaign stimuli in competitive political settings (Lipsitz Reference Lipsitz2011; Fraga Reference Fraga2011; Gimpel, Kaufmann, and Pearson-Merkowitz Reference Gimpel, Kaufmann and Pearson-Merkowitz2007). Lyons, Jaeger, and Wolak (Reference Lyons, Jaeger and Wolak2013), for example, show that voters are more informed about their governor in electorally competitive states. Many state legislative districts, however, are not competitive. Bush or Kerry, for example, received at least 60% of the vote in over half of the districts in 2004. In some states, such as Wyoming or Alabama, more than 85% of legislators represented these types of safe districts. Partisan districts provide an electoral cushion for incumbents and are partly responsible for approximately 40% of incumbents avoiding major party challengers (Squire Reference Squire2000; Rogers Reference Rogers2015). Challengers are not only necessary to provide voters an opportunity to replace their incumbent but can also bring unrepresentative legislative behavior to voters’ attention (Arnold Reference Arnold1992).
Little media attention and uncompetitive political environments in addition to the institutional advantages of incumbency create unfavorable conditions for accountability in many states (Carey, Niemi, and Powell Reference Carey, Niemi, Lynda and Powell2000). However, it remains unclear the extent to which these conditions influence the relationship between representation and election outcomes. Birkhead (Reference Birkhead2015) and Hogan (Reference Hogan2008) tell us the most that we know about the electoral implications of state legislative representation but examine relatively limited sets of elections and fail to account for how certain institutions surrounding elections, such as the media, affect levels of accountability. I additionally know of no prior research that examines the electoral ramifications of specific roll-call votes, leaving political scientists with a relatively incomplete characterization of accountability in state legislatures as compared to Congress.
To provide a fuller understanding of accountability in American legislatures, I conduct two analyses that focus on legislators’ overall representation and individual roll-call votes. I first employ new data on state legislator and voter ideology from nearly every state from 2001 to 2010 to assess whether legislators who are ideologically distant from their districts receive lower vote shares. This extensive collection of district-level measures of legislator behavior and public opinion allows me to investigate how varying legislative institutions and information environments relate to levels of accountability. To examine voters’ responses to legislators’ behavior on specific issues, I use referendum election results to generate district-level measures of public opinion on 30 bills adopted by legislatures and assess whether incumbents receive greater vote shares as their district becomes more favorable to their roll-call positions. Both of these analyses test the proposition a legislator will receive fewer votes if she fails to represent her district’s preferences, and together offer the most empirically thorough investigation of district-level accountability in American legislatures.
ACCOUNTABILITY FOR IDEOLOGICAL REPRESENTATION
Spatial theories of electoral competition predict that legislators will receive lower vote shares if they do not represent their districts on a broad ideological dimension (e.g., Downs Reference Downs1957). However, when studying state legislatures, a dearth of measures that capture legislators’ and their districts’ ideologies has limited political scientists’ ability to thoroughly test this prediction. Recent advances in the estimation of public opinion (Tausanovitch and Warshaw Reference Tausanovitch and Warshaw2013) along with newly collected data on legislator behavior (Shor and McCarty Reference Shor and McCarty2011) now provide the necessary measures to better understand the extent to which elections serve as an accountability mechanism in state legislatures.
To test spatial theories’ predictions, I evaluate the relationship between election outcomes and representation where my primary independent variable of interest is the estimated ideological distance between a state legislator and her district. To measure legislator ideology, I use legislators’ ideal points developed by Shor and McCarty (Reference Shor and McCarty2011). Within these data, survey responses of state legislators who responded to Project Vote Smart’s National Political Awareness Tests bridge state specific ideal points to put ideological estimates into a common space, permitting cross-state comparisons of ideology. To capture voters’ ideology, I employ legislative district ideal points developed by Tausanovitch and Warshaw (Reference Tausanovitch and Warshaw2013). Tausanovitch and Warshaw use over 275,000 individuals’ responses to the Cooperative Congressional Election Studies and the Annenberg National Election Surveys along with multilevel regression and poststratification to estimate district-level measures of ideology for most state legislative districts across the country.
Together, Shor, McCarty, Tausanovitch, and Warshaw provide unprecedented data on legislator and district ideology, but their ideological measures are on different scales and, therefore, are not directly comparable. A measure of representation in the tradition of the delegate model, however, requires a comparison of the preferences of legislators and voters. To create comparable ideological measures, I impute new district ideal points under the general assumption that Democrat and Republican legislators on average represent their districts. Specifically, I regress Shor and McCarty’s legislator ideal points on Tausanovitch and Warshaw’s measure of constituent ideology and a party dummy using Equation 1. The party dummy accounts for the intradistrict divergence of Democrat and Republican legislators providing different representation to the same district, captured by ϕ2 in Equation 1 (McCarty, Poole, and Rosenthal Reference McCarty and Keith2009). I predict a district ideal point using estimates from Equations 1 and 2 where the final term assumes that Republicans and Democrats equally misrepresent the same district by setting λ to 0.5.Footnote 2 With this new measure of district ideology, I estimate the ideological distance between a legislator and her district by taking the absolute value of the difference between a legislator’s ideal point and her district’s imputed ideal point (Equation 3).Footnote 3
 {\fontsize{9}{11}\selectfont$$\begin{eqnarray}
&&Shor\;\text{\&}\;McCarty\;Leg.\;Ideal\;Point = \phi _0 \nonumber\\
&&\quad +\; \phi _1 [Tausanovitch\;\text{\&}\;Warshaw\;Dist.\;Ideal\;Point] \nonumber\\
&&\qquad +\; \phi _2[Republican \ Party \ Dummy] + \epsilon
\end{eqnarray}$$}
 $$\begin{eqnarray}
&&Estimated \ District \ Ideal \ Point = \phi _0\nonumber\\
&&\quad +\; \phi _1 [Tausanovitch\;\text{\&}\;Warshaw\;Dist.\;Ideal\;Point] \nonumber\\
&&\qquad +\; \lambda \phi _2
\end{eqnarray}$$
 $$\begin{eqnarray}
&&Ideological\;Distance\nonumber\\
&&\quad = |Shor\;\text{\&}\;McCarty\;Leg.\;Ideal\;Point\nonumber\\
&&\qquad - Estimated \ District \ IdealPoint|
\end{eqnarray}$$
My measure of state legislative representation aims to capture the ideological distance between a representative and her constituents and resembles those used to study representation in Congress (e.g., Rabinowitz and McDonald Reference Rabinowitz and Macdonald1989). When interpreting results, it is important readers be cognizant that my Ideological Distance metric fails to consider the position of an incumbent’s challenger and requires strong assumptions to put voters and legislators in a common ideological space (Achen Reference Achen1978; Ansolabehere, Snyder, and Stewart Reference Ansolabehere, Snyder and Stewart2001; Matsusaka Reference Matsusaka2001). Tausanovitch and Warshaw’s district ideal points are also measured with error, which likely attenuates the estimated strength of the relationship between representation and vote share.Footnote 4 However, main results are similar when substituting variables measured with less error, such as district-level demographics or presidential vote, for Tausanovitch and Warshaw’s district ideal points in Equations 1 and 2 (see Online Appendix).
For my study of electoral accountability for ideological representation, I examine state legislative elections from 2001 to 2010 in 47 states.Footnote 5 My main independent variable of interest is the Ideological Distance measure for legislators who represent single-member districts. Using this measure, I assess the extent to which increases in the ideological distance between a legislator and her district affect election outcomes. To account for nonlinear relationships, vote-share analyses include a squared measure of the Ideological Distance variable. Following studies of congressional elections, I control for district-level presidential vote (averaged over the 2004 and 2008 elections), incumbent previous vote share, difference in logged incumbent and challenger campaign contributions (FollowtheMoney.org), the incumbent’s party, affiliation with the president’s party, the state economy, freshman status, district population, and whether an election took place in the midterm.Footnote 6 Summary statistics of variables used in this and subsequent analyses are available in the Online Appendix.
My analyses also consider institutional and political conditions that vary across states. Prior work provides evidence that incumbents are more likely to be re-elected from professionalized legislatures (e.g., Carey, Niemi, and Powell Reference Carey, Niemi, Lynda and Powell2000). When studying the 2000 elections, Birkhead finds that ideologically extreme legislators face less electoral punishment in professional legislatures, as measured by Squire’s professionalism index (Squire Reference Squire2007). This index measure accounts for legislative staff, salary, and length of legislative session, but it is unclear which aspect of legislative professionalism is responsible for Birkhead’s finding concerning legislator ideology and election outcomes. Representatives with increased staff may be able to better monitor constituency opinion and identify issue areas where they can take extreme positions. Legislators with higher salaries, meanwhile, spend more time on election-related activities, such as explaining positions to constituents (Carey, Niemi, and Powell Reference Carey, Niemi, Lynda and Powell2000, Table 3). Similarly, representatives who serve in legislatures with shorter legislative sessions likely have more time to spend in their districts. To better understand which aspect of legislative professionalism is responsible for shielding extreme legislators from electoral punishment, I break down Squire’s professionalism measure into its three separate components: staff per member (Weberg Reference Weberg2016), legislator salary, and length of session (Bowen and Greene Reference Bowen and Greene2014) and interact each with my Ideological Distance measure.
Prior work offers speculation that the media influences the levels of accountability in state legislatures (Hogan Reference Hogan2008, 859–861; Birkhead Reference Birkhead2015, 60–61) but does not test this hypothesis. To remedy this shortcoming, my analyses uniquely account for the number of full-time newspaper reporters devoted to each state government, as documented by the American Journalism Review (Layton and Dorroh Reference Layton and Dorroh2002; Dorroh Reference Dorroh2009). To estimate the conditional effect the media has on accountability, I interact my Ideological Distance measure with a logged measure of the number of full-time reporters. To address the influences of competitive campaigns, I revisit Hogan’s (Reference Hogan2008) finding that increased incumbent spending advantages decrease the likelihood a legislator receives fewer votes for unresponsive behavior by creating an interaction term between an incumbent’s Ideological Distance from her district and her fundraising advantage in the given election.
To assess the levels of electoral accountability for ideological representation in state legislatures, I use a linear cross-sectional estimation with fixed effects for years and random effects for states where the dependent variable is the incumbent’s vote share in an election contested by the two major parties (Klarner et al. Reference Klarner, Berry, Carsey, Jewell, Niemi, Powell and Snyder2013). To study races without challengers, I also estimate the relationship between my Ideological Distance measure and whether an incumbent won re-election in a probit model that includes random effects for states. To further account for differences in district-level competition, I conduct separate analyses on all districts, marginal districts, and safe districts (Ansolabehere, Snyder, and Stewart Reference Ansolabehere, Snyder and Stewart2001).
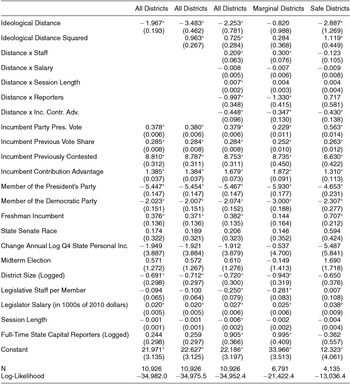
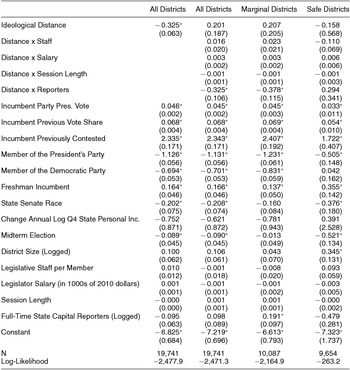
Focusing on the relationship between representation and vote share, Table 1 provides evidence that median voter theories apply to state legislative elections. Holding other independent variables at their mean values, statistical analyses in the first column suggest that a standard deviation increase in a legislator’s Ideological Distance from their district results in approximately a 0.7% decrease in predicted vote share. Estimates in the second column of this table suggest that representation’s relationship with vote share is nonlinear. When accounting for nonlinearity, a standard deviation increase in the Ideological Distance measure again results in approximately a 0.7% decrease in vote share, and a three standard deviation increase in the Ideological Distance metric translates into a 1.3% decrease in vote share.
Relationship between State Legislators’ Representation and Vote Share

*p ≤ 0.05. Standard errors in parentheses.
Relationship between state legislators’ ideological distance from their district and re-election vote share for contested incumbents who sought re-election from 2001 to 2010. Estimations include fixed effects for years and random effects for states.
To compare representation’s influence on election outcomes to that of other variables known to influence state legislative elections, a 0.7% shift in incumbent vote share is less than that associated with a $25,000 increase in legislator salary. A more substantial three standard deviation change in representation’s electoral impact (1.3%) is less than that attributable to a 4% change in district partisanship, and at the extremes, a change approximately equivalent to the full range of the Ideological Distance metric results in a 4.6% predicted decrease in vote share, which is less than that associated with a legislator being a member of the president’s party. Representation then matters for state legislators’ electoral fates, but its impact appears to be relatively small.
To situate state legislative findings within a broader American politics context, I conduct a comparable analysis of U.S. House elections from 2002 to 2010. To make ideological comparisons between Congress and state legislatures, I put U.S. House members’ ideal points in the same ideological space as state legislative ideal points, following a projection procedure similar to that employed by Shor and McCarty, where I assume that individuals’ ideal points remain constant between serving in federal and state legislatures.Footnote 7 I then conduct statistical analyses comparable to those above but only with controls common to Congress and state legislatures (e.g., district-level presidential vote but not state legislative professionalism measures, see Table A-14 for estimates).Footnote 8 When holding other variables at their observed values, I find that a standard deviation increase in the Ideological Distance measure associates with approximately a 1.1% decrease in vote share for members of the U.S. House. The severity of electoral punishments, however, appears to be less at the state level. The same change in ideological representation results in only a 0.7% decrease in vote share for state legislators, approximately a third less than that found in Congress.
The lower average effects found in state legislative elections may concern those who believe elections need to be strong mechanisms of accountability. To strengthen electoral connections, it is necessary to better understand how political conditions inhibit electoral accountability. To help provide this understanding, analyses in the third column of Table 1 include interactions between the Ideological Distance variable and measures of state legislative professionalism and media coverage.
In regard to professionalism, I find that incumbents with higher salaries are more likely to be re-elected, similar to Carey, Niemi, and Powell (Reference Carey, Niemi, Lynda and Powell2000). Legislators from professionalized legislatures with higher salaries, however, appear to receive no less electoral punishment for poor representation. Instead, legislators with larger staffs are less likely to be held accountable. For example, if every state had New Hampshire’s legislator to staff ratio (approximately 2:1), a standard deviation increase in the Ideological Distance measure results in a predicted 1.1% loss in incumbent vote share (t-statistic 7.81), but if every state had California’s legislator to staff ratio (approximately 1:17), a similar change in representation results in a 0.2% increase in vote share (t-statistic 0.52). Prior findings regarding professionalism protecting unrepresentative incumbents’ electoral margins then appear to be partly rooted in the levels of staff afforded to state legislators.
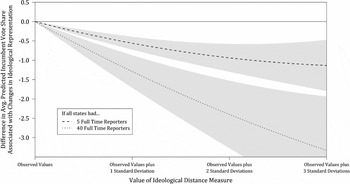
While unrepresentative California legislators seem to electorally benefit from their increased staff, the media appears to help voters hold legislators accountable in this state. In 2003, California was both the most professional legislature (Squire Reference Squire2007) and had 40 full-time newspaper reporters devoted to covering state government, more than any other state. To illustrate the estimated impact the media could have if all states had this many reporters, the dotted line in Figure 2 plots the predicted vote loss for legislators if they became more ideologically distant from their district. Under these media conditions, a standard deviation increase in the Ideological Distance measure results in a 1.3% decrease in predicted vote share, suggesting the fourth estate can help voters hold their legislators accountable (Figure 2, dotted line). Recent changes to the press corps at state capitals, however, tempers optimism in this regard. From 2003 to 2009, there were a third fewer full-time reporters devoted to state government across the country, and by 2009, half of states had five or fewer full-time reporters. When there are only five reporters in every state, the comparable vote loss falls to 0.6% (Figure 2, dashed line). The difference between the dotted and dashed lines in Figure 2 suggests the declining media coverage of state government is detrimental to the levels of accountability in American legislatures.
Impact of Representation on Vote Share under Different Levels of Media Coverage

Research on congressional elections shows that incumbents entering more competitive races need to be the most attentive to their constituents’ ideological preferences (Mayhew Reference Mayhew1974b; Ansolabehere, Snyder and Stewart Reference Ansolabehere, Snyder and Stewart2001, 138). To examine if state legislators in competitive races similarly need to be more concerned with their representation, the final two columns of Table 1 focus on “marginal” and “safe” districts, as defined by whether the incumbent’s party received less than or greater than 60% of the presidential vote.
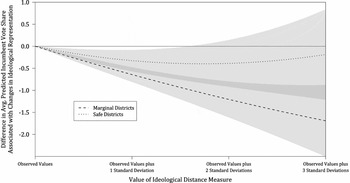
Figure 3 summarizes the average effects of representation across marginal and safe districts and plots the predicted vote loss for incumbents under different increases in the Ideological Distance measure. Recall that across all districts, a three standard deviation increase in the Ideological Distance metric resulted in a 1.3% change in vote share. When separating analyses into marginal and safe districts, this change in representation is associated with a 1.7% vote share decrease in marginal districts (Figure 3, dashed line) but only a 0.2% change in safe districts (Figure 3, dotted line). Comparisons of the final two columns of Table 1 furthermore suggest the impact of the media and legislative staff is concentrated in more marginal districts.
Impact of Representation on Vote Share in Marginal and Safe Districts

The differences illustrated by Figure 3 suggest legislators in safe districts need to be less worried about how their ideological representation might affect their re-election chances, and legislators in marginal districts have stronger motivation to run scared. All incumbents are likely concerned with their margin of victory to some degree, but the threat of being thrown out of office ultimately underlies elections’ ability to solve the moral hazard problem posed by representative government. To investigate how ideological representation relates to whether an incumbent wins or loses, Table 2 presents results from probit analyses where the dependent variable is whether an incumbent won re-election.
Relationship between State Legislators’ Representation and Incumbent Re-election

*p ≤ 0.05. Standard errors in parentheses.
Relationship between state legislators’ ideological distance from their district and likelihood of re-election for incumbents who sought re-election from 2001 to 2010. Probit estimations include random effects for states.
Analyses focusing on incumbent re-election provide further evidence that incumbents have electoral incentives to represent their districts, but these incentives again appear to be small. A standard deviation increase in the Ideological Distance metric reduces the probability an incumbent wins re-election by .008. By comparison, this change in re-election chances is less than that associated with a 5% change in district partisanship, the “sophomore surge” (Holbrook and Tidmarch Reference Holbrook and Tidmarch1991), or a legislator being a co-partisan of the president. More promising for accountability, analyses in the second column of Table 2 reaffirm that the media can have a positive role in the accountability process. Within the context of the example presented in Figure 2, if all states had 5 full-time reporters at the state house, a standard deviation increase in the Ideological Distance metric associates with a .005 decrease in the probability of re-election, but if all states had 40 reporters, the predicted decrease would be .032 (Table 2: Column 3). These are extreme changes in media coverage, but these findings suggest that voters are better equipped to hold their representatives accountable when the fourth estate pays attention to state legislators.
State legislators in more competitive seats additionally appear to have increased electoral incentive to represent their districts. When focusing on marginal districts, a standard deviation change in representation results in approximately a .018 decrease in the probability of re-election, and the media’s influence again appears concentrated in these districts (Table 2, Column 3). Legislators in marginal districts then have more reason to run scared, but there is little evidence that this is the case for legislators in safe districts. Estimates from the final column of Table 2 suggest the small vote share changes evidenced by the final column of Table 1 are not enough to meaningfully threaten the re-election hopes of approximately half of state legislative incumbents.
ACCOUNTABILITY FOR INDIVIDUAL ROLL-CALL VOTES
The prior analyses suggest many state legislators face limited electoral consequences for providing poor representation. This study of district-level accountability is the most thorough to date in terms of states and elections considered but employs summary measures of ideological representation and relies on assumptions to put the ideology of voters and legislators in a common space. Instead of evaluating how their representatives act on a broad ideological spectrum, voters may care about their representatives’ votes on key issues. As characterized by a U.S. House representative, “When you are voting right, you build up points on a cumulative basis. You can lose them on a geometric basis; you can lose all your points on one vote” (Matthews and Stimson Reference Matthews and Stimson1975, 30; quoted in Canes-Wrone, Brady, and Cogan Reference Canes-Wrone, Brady and Cogan2002). Studies of Congress repeatedly provide evidence of U.S. House members incurring electoral punishment for individual roll-call votes (e.g., Jacobson Reference Jacobson1996; Ferejohn Reference Ferejohn and Weir1998; Ansolabehere and Jones Reference Ansolabehere and Jones2010), but it remains unclear the extent to which voters similarly punish state legislators.
The lack of issue-specific public opinion measures at the state legislative district-level makes it difficult for political scientists to investigate whether roll-call decisions made by legislators are unpopular with their constituents. Some states, however, have veto-referendum elections where voters can veto legislation adopted by the legislature before it becomes a law. The results of these elections provide measures of public opinion on state legislation—and thereby legislators’ roll-call positions—on the exact bill adopted by the state legislature. Results from referenda and initiative elections have shed light on whether state legislators vote consistently with their constituents’ preferences (e.g., Gerber Reference Gerber1996b; Snyder Reference Snyder1996; Lewis and Gerber Reference Lewis and Gerber2004), but I am unaware of research that utilizes referenda to determine whether voters reward or punish state legislators for their positions on particular pieces of legislation.
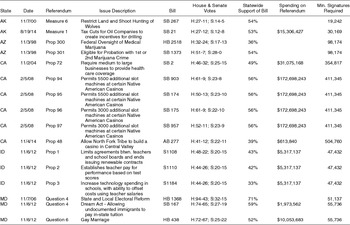
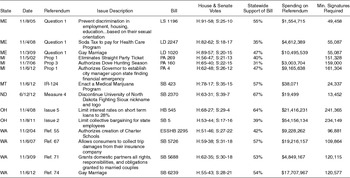
Tables 3 and 4 provide brief descriptions of 30 bills that faced veto referendum in the last 2 decades and report their levels of support in the state legislature and statewide electorate. Voters vetoed 13 of 30 considered bills, and in doing so overturned legislatures’ decisions to legalize gay marriage, expand health care, and create charter schools. The considered referenda range in prominence and attention received. The Chamber of Commerce, for example, alone spent more money supporting emergency manager reform in Michigan than was spent overall on an earlier Michigan referendum regarding hunting rights. Overall, interest groups spent at least $4 million campaigning for or against most of the considered referenda, increasing the likelihood of voter awareness of these bills compared to other pieces of legislation.
Descriptions of Veto-Referendum

Descriptions of Veto-Referendum

Veto referenda provide an excellent opportunity to evaluate whether legislators face electoral punishment for unpopular roll-call decisions, but there are limitations to using these elections to study accountability. Ten of 30 referendum elections did not occur during the November general election, and the types of voters who turnout in these elections may not reflect a district’s typical voting population. I additionally aim to include the universe of veto referendum from the last 2 decades but only examine the 11 states that make precinct-level referendum election returns readily available. Other states with veto referendum during this time period—Oregon, Massachusetts, South Dakota, and Utah—only provide county- or town-level referendum election returns, which I cannot aggregate to the state legislative district level.
Bills facing veto referendum are also not representative of all bills considered by the legislature. The increased prominence of veto-referendum bills makes finding evidence of accountability more likely, but this prominence also limits the external validity of this study. For example, supporting the notion that voters are “educated by the initiative” (Smith and Tolbert Reference Smith and Tolbert2004), over $100 million spent by California interest groups on referenda regarding slot machines in Native American casinos helped increase voter awareness of the issue by 43% in the course of a month (Field Poll. "California Poll." Questionaire. Jan. 2008), which is atypical for most state legislation. Veto referenda also frequently address controversial issues. Three of the 30 considered bills, for example, concern gay marriage, but 10% of all state legislation likely does not attract the same attention of voters as same-sex marriage.
Veto-referendum elections are also only held for adopted pieces of legislation. Therefore, I do not consider legislators’ roll calls on failed legislation. Legislators in veto-referendum states may strategically alter their roll-call decisions, knowing voters can ultimately veto legislation they pass or may decide not to pursue re-election if they realize they took an unpopular roll-call position (Gerber Reference Gerber1996a). However, incumbents who represented districts where less than 40%, 40 to 60%, and more than 60% of voters supported their roll-call position respectively sought re-election 73%, 69%, and 72% of the time, suggesting unpopular roll-call positions did not lead to more retirements. Probit analyses examining the likelihood incumbents seek re-election provide similar findings (see Online Appendix).
Across the legislation considered here, approximately 37% of roll calls cast by all legislators and those seeking re-election did not represent their district’s majority opinion. To evaluate whether unpopular roll-call votes have electoral consequences, I estimate the relationship between the level of district support for each roll call and a contested incumbent’s vote share.Footnote 9 Since voters’ opinions of roll calls and their behavior in state legislative elections may differ across issue areas, I estimate a multilevel model that allows slopes and intercepts to vary by bill in addition to a separate Ordinary Least Squares regression for each bill. A positive relationship between district support for a legislator’s position and vote share suggests legislators have an electoral incentive to cast popular roll-call votes. Analyses include controls similar to those used in the aforementioned ideological representation study. To account for multimember districts, I control for the number of candidates in the current and previous elections as well as conduct separate analyses that focus on states that only have single-member districts.
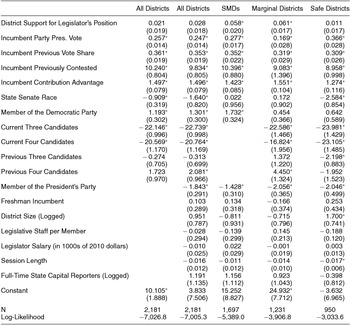
When examining legislation that faced veto referendum, findings in Table 5 suggest that there is little relationship between voters’ opinions of their representatives’ roll-call positions and election outcomes. Results in the first column of this table suggest that a standard deviation change in district opinion (approximately 13%) associates with a 0.3% change in vote share, but this change is statistically indistinguishable from zero. Findings are similar when controlling for factors such state legislative professionalism or if the incumbent was a freshman (Table 5, Column 2). When limiting analyses to states that only have single-member districts, a standard deviation change in public opinion results in a 0.7% change in incumbent vote share (Table 5, Column 3). The existence of a relationship between roll-call positions and election outcomes is encouraging for the prospects for accountably. This change in vote share, however, is again less than that associated with a 4% change in district partisanship or a legislator being a member of the president’s party within the states considered here.
Relationship between District-Level Support of Legislator’s Roll Calls and Incumbent Vote Share

Relationship between district-level support for incumbent’s roll-call vote and incumbent vote share in contested races. Analyses in the third column only include states that exclusively have single-member district elections. Analyses in the fourth and fifth columns divide races into marginal districts and safe districts. Estimations allow slopes and intercepts to vary by bill.
The small changes in vote share associated with unpopular roll-call positions furthermore appear to have few implications for most legislators’ re-election prospects. If every single-member district experienced a standard deviation shift in public opinion, the predicted probability an incumbent is re-elected increases by .01 (Table A-16, Column 3), and only 1% of considered election outcomes would likely change. In comparison to the average effects congressional roll-call votes have on election outcomes, Ansolabehere and Jones’ examination of individual voters’ opinions of 10 different roll calls finds that a standard deviation increase in a voter’s perceived agreement with their U.S. House member’s position associates with a .15 increase in the linear probability of voting for the incumbent (Ansolabehere and Jones Reference Ansolabehere and Jones2010, 592).Footnote 10
Similar to findings concerning ideological representation, analyses in Table 5 provide evidence that state legislative representation matters more for legislators’ electoral fates in marginal districts. A marginal district becoming 13% more favorable toward an incumbent’s roll-call position results in an incumbent’s predicted vote share and probability of re-election respectively to increase by 0.8% (Table 5, Column 4) and .018 (Table A-16, Column 4). In single-member, marginal districts, these changes are 1.0% and .019. Legislators in more vulnerable seats then have an electoral incentive to represent their districts, but statistical analyses from the final column of Table 5 reaffirm that legislators in more partisan districts appear to have less reason to run scared.Footnote 11
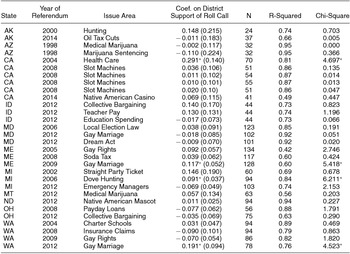
As it is critical to consider differences across districts, it is also important to recognize that some roll calls may be more important to voters than others. Even among more prominent legislation in Congress, evidence electoral connections exists concerning some but not all roll calls (Bovitz and Carson Reference Bovitz and Carson2006, Table 1). For example, in the 2006 election, members of Congress faced ramifications for their vote on the Patriot Act but not on the Central America Free Trade Agreement (Ansolabehere and Jones Reference Ansolabehere and Jones2010), and in 2010, voters rewarded their representatives for their positions on health care reform but not the stimulus package (Nyhan et al. Reference Nyhan, McGhee, Sides, Masket and Greene2012).Footnote 12 At the state legislative level, voters may similarly be more concerned with gay rights than a soda tax. To investigate the relationship between public opinion and vote share on individual bills, I estimate separate ordinary least squares regressions for each bill and report the coefficient on District Support for Legislator’s Position in the fourth column of Table 6 (full estimates available in the Online Appendix).
Relationships between District-Level Support of Legislator’s Roll Calls and Incumbent Vote Share

*p ≤ .05; standard errors in parentheses.
Relationship between district-level support for incumbent’s roll-call vote and incumbent vote share. Positive coefficients for “Coef. District Support of Roll Call” indicate that voters reward or punish legislators for their roll-call position, which appears to be the case for 4 of 30 bills examined. The final column reports the Chi-Square statistic from likelihood ratio tests comparing models that include and exclude the “District Support” variable. Full estimates are available in the Online Appendix.
Analyses of individual bills provide stronger evidence of accountability in Maine, Washington, California, and Michigan. The Maine state legislature in 2009, for example, voted to legalize gay marriage, and perhaps reflecting that state legislators frequently misperceive their constituents’ positions on this issue (Broockman and Skovron Reference Broockman and Skovron2013), most legislators voted against the majority opinion of their districts in this state. Findings in Table 6 suggest these incumbents paid an electoral price for this lack of dyadic representation. A 10% increase in district support for a Maine legislator’s roll call on gay marriage results in a predicted 1.2% increase in re-election vote share. In Washington, a similar change in favorability toward gay marriage is associated with a more substantial 1.9% increase in incumbent vote share. There is also evidence that California and Michigan voters respectively held their legislators responsible for their positions on health care and hunting rights legislation, which is encouraging for the prospect that legislators are held accountable in some states for their positions on some issues.
Despite these instances of accountability, analyses of the other 26 of 30 bills produce no statistically significant relationship between voters’ and legislators’ behavior, including on legislation concerning the same issues of gay rights, health care, and hunting in other states. Even on the issue of gay marriage in Maine and Washington, the vote-share loss associated with a standard deviation change in public opinion is less than the punishment endured by Democrats in the 2010 elections for supporting either the Affordable Care Act or Cap and Trade legislation (Nyhan et al. Reference Nyhan, McGhee, Sides, Masket and Greene2012, Table 3; see also Brady, Fiorina, and Wilkens Reference Brady, Fiorina and Wilkins2011; Jacobson Reference Jacobson2011). The findings in Table 6 suggest that although accountability for roll-call voting is not absent in state legislatures, there is little evidence of associations between a district’s support for a legislator’s roll-call positions and that legislator’s vote share for the majority of legislation considered here. Taken together with the weak average relationships presented in Table 5, the typical state legislator appears to face few electoral ramifications for his individual roll-call positions.
DISCUSSION
The aforementioned studies test fundamental theories of electoral accountability. I find that state legislators who provide poor ideological representation of their districts receive lower vote shares, and legislators in some states face electoral punishment for unpopular roll calls on some issues, such as gay marriage. However, representation seems to have less impact in state legislative elections than in Congressional elections and also matters less than a variety of other political variables known to influence election outcomes. Evidence of accountability is particularly lacking amongst state legislators who represent safe districts, and there seems to be little association between unpopular roll-call decisions and election outcomes on most legislation considered here.
While electoral connections are seemingly weak, my findings provide some evidence that state legislators have electoral incentives to represent their districts. Given how little attention the media and voters seem to pay to their state legislators, these results may surprise some. Any relationship between representation and election outcomes is almost always more encouraging for the health of democracy than no relationship, but it is important to avoid setting too low of a bar for levels of accountability based on low expectations. State legislators are responsible for important policymaking, appropriating over $800 billion in tax revenue each year and making decisions on issues ranging from the environment to the death penalty. Without sufficient incentives for representation, state legislators may be more likely to succumb to pressures from interest groups, party leadership, or follow their own personal interests rather than represent their constituents’ interests.
My analyses of state legislative elections raise important questions concerning accountability, but my study does not completely characterize the relationship between elections and representation in state legislatures. I employ the most extensive existing collection of district-level measures of legislator ideology and public opinion, but my investigation of the electoral implications of ideological representation requires strong assumptions to put voters and legislators in a common ideological space. While my analyses of whether voters punish legislators for unpopular roll calls examine public opinion on the exact bills considered by their legislators, I only study a subset of states on a limited number of issues.
From a theoretical perspective, I focus on elections as a solution to a moral hazard problem (Ferejohn Reference Ferejohn1986) instead of an adverse selection problem (Fearon Reference Fearon1999). Carefully selected legislators may still produce representative policies. Legislators furthermore do not always know which roll calls are important to voters, leading incumbents to “run scared.” However, in Carnes’ survey of state legislators, only 40% of legislators agreed with the statement that “moderate candidates and politicians win significantly more votes” and even fewer (15%) thought “voters know who in government to blame for policies they do not like,” suggesting legislators are partly aware there may be few ramifications for being out of step.
Many legislators may believe voters do not know who to blame for policymaking. Reality is that some voters do know who to hold accountable, and certain conditions surrounding elections improve the information environment for voters. Findings presented in Figure 2, for example, suggest that increased media attention to state government strengthens electoral connections, and the aforementioned analyses repeatedly provide evidence that legislators in marginal districts are more likely to be held accountable. Although my studies illustrate that accountability state legislatures is sometimes scarce, they also show the conditions under which electoral connections are most likely to be found, which I hope guides future research to determine how greater incentives for representation can be achieved in American legislatures.
Future researchers should also carefully consider how my results relate to assumptions critical to theories of American politics. Legislators’ re-election goals are often central to theories of legislative organization (e.g., Cox and McCubbins Reference Cox and McCubbins2005; Mayhew Reference Mayhew1974a; Rhode Reference Rhode1991), which have already been repeatedly tested in states (Anzia and Jackman Reference Anzia and Jackman2013; Cox, Kousser, and McCubbins Reference Cox, Kousser and McCubbins2010; Aldrich and Battista Reference Aldrich and Coleman Battista2002). The above findings imply how many state legislators achieve their re-election goals should somewhat differ from their federal counterparts. Theories of legislative behavior developed and tested in Congress then may not cleanly translate to state legislatures. While state governments offer attractive institutional variation for studies of how legislators and legislatures operate, the differences between the federal and state levels suggest that even within the subfield of American politics “American exceptionalism” perhaps applies to studying the federal government (Lipset Reference Lipset1997).
My findings have important implications for how scholars study politics, but their central message concerns accountability in state legislatures. State legislators have considerable authority over American lives. They determine who has the opportunity to vote, go to college, and even get married, and elections are the primary instrument by which citizens can exert control over those who govern them. This electoral connection can emerge through almost any state legislative contest, but electoral accountability will only meaningfully exist if there is a relationship between voters’ and legislators’ behavior, which does not appear to be the case in many state legislative elections.
SUPPLEMENTARY MATERIAL
To view supplementary material for this article, please visit https://doi.org/10.1017/S0003055417000156
Replication files can be found at https://doi.org/10.7910/DVN/TKU9WH




Comments
No Comments have been published for this article.