


1. Introduction
Étude n°1 is a solo for feedback and effects pedals created by David Caulet as part of the research-creation project Performative Notation, directed by Nicolas Bernier. This piece proposes a musical notation for effects pedals. This electronic device was originally conceived to enhance the timbre of the electric guitar, a use regularly hijacked – notably in the experimental and improvised music scene – to expand the sonic possibilities of various musical instruments. While the use of effects pedals is a relatively common practice, its notation is still underdeveloped.
This article first proposes to draw on examples of modern music notation to show some strategies deployed by composers to represent the use of effects pedals. The second section presents the various methodological stages that guide the creation of Étude n°1. Starting with showing the creative approach for sonic material creation, followed by the technical implementation of the instrument. The final section reveals the graphic proposal of the musical gestures used in Étude n°1’s score. Finally, the conclusion outlines the perspectives revealed by the creation of this piece.
2. From electric guitar to effects pedal notation
The year 1932 marks a decisive turning point in the era of guitar amplification, with George Beauchamp’s invention of the electromagnetic pickup, which ‘can be considered as the founding act of the modern electric guitar’ (Duchossoir Reference Duchossoir2016: 14). During this decade, this instrument appears in jazz, thanks to musicians such as Django Reinhardt and Charlie Christian, the latter helping to familiarise it with the wider public when he joined Benny Goodman’s orchestra in 1939 (Waschbüsch Reference WaschbWaschbüsch2016: 343). The possibilities of signal distortion offered by the use of vacuum tubes in amplifiers (Duchossoir Reference Duchossoir2016: 24), combined with the emergence of signal processing pedals – such as the DeArmond Tremolo Control, marketed in 1946 and considered the first guitar effects pedal (Wilmering et al. Reference Wilmering, Moffat, Milo and Sandler2020: 802) – gradually contributed to establishing a close link between the electric guitar and the emerging sounds of rock.
As H. Stith Bennett (Bennet & Mignon, Reference Bennet and Mignon1988) points out, rock music is mainly learned through listening, imitation, interaction with recordings and repetition, continuing the oral transmission practices typical of jazz and other traditional musics. The score, therefore, is often considered secondary in this context. Over time, musical notation has found its way into electric guitar practice, particularly in a pedagogical context. Nevertheless, the representation of usual musical features continues to rely ‘mainly on traditional, even archaic means […]’ (Laliberté Reference Laliberté2010: 4). For example, Mel Bay’s Electric Guitar Method (Vol. 1), published in 1948, focuses primarily on teaching the basic elements of musical notation (staff, pitch, rhythmic values, etc.). In this method, the only indication specific to the electric guitar concerns the use of the pick, notated using a particular symbol specifying the direction of string attack. Similarly, for its first publication on 15 April 1940, of an electric guitar solo by Charlie Christian on Flying Home (Koger et al. Reference Koger, Martin, Richardson, Sabree, Wade and de Lerma1985: 45), Down Beat Magazine used traditional notation. It was only from the 1960s that Italian tablature (Noailly Reference Noailly1988) was reintroduced, either as a supplement or a substitute for this notation. Furthermore, a lexicon is almost always included at the beginning of songbooks to explain the various symbols representing the multiple ‘elements characterizing the phrasing of the electric instrument’ (Conti Reference Conti and Arbo2014: 48), notably to transcribe bodily effects linked to the affordances offered by the instrument (bends, use of the vibrato bar, etc.), or the use of objects such as the bottleneck. These developments are evident in early pop songbooks such as The Beatles ‘A Hard Day’s Night’ Guitar Book by Ronny Lee (Reference Lee1964), which offers a guitar transcription of the famous Beatles song combining standard notation and tablature. A few years later, Guitar Player Magazine, founded in 1967, launched a series of lessons structured on the same notation principle, marking a decisive turning point in electric guitar pedagogy.
In the 1970s, composers of contemporary music began to incorporate the electric guitar into their instrumentarium. In this context, the principles of notation underwent a major evolution, becoming more complex in order to translate the composer’s intention as accurately as possible. For example, in Gérard Grisey’s piece Dérives, composed in 1973–74, the guitar was conceived as an electroacoustic instrument, bringing a corpus of specific symbols (Figure 1).
Excerpt from Dérives (bar 8, p. 17) by Gérard Grisey (Zetina Reference Zetina2023: 227; Score extracted from the thesis of Ivan Zetina) where the black circle represents a dry noise from the lowest to the highest strings.

Like emerging electronic music, where the complexity of modular synthesisers poses unique challenges for musical notation (Lecours and Bernier Reference Lecours and Bernier2024), the concern for timbral control leads composers to develop various strategies to incorporate the use of effects pedals in their works. For instance, Dérives features a textual indication ‘with distortion’ suggesting the use of an effect pedal, but without further details on its parameters. Fausto Romitelli later provides more specific instructions for the settings of effect pedals in a dedicated section of the booklet for Trash TV Trance (2002) (Figure 2).
List of effects needed for the performance of Trash TV Trance, Milan: Ricordi, score 139457, p. IV.

In the score, the composer indicates the recording, starting or stopping of a loop created with the loop sampler, using a simple symbol: an L in a circle, with two states, crossed out or not crossed (Figure 3).
Trash TV Trance composed by Fausto Romitelli, bar 157–164, Milan: Ricordi, score 139457, p. 7.

In 2021, composer Julien Malaussena proposed two types of effect pedal notation for his piece De toucher de lignes. As shown in Figure 4, a multi-effect pedal is programmed to modify the pitch of the note played by a quarter tone downwards (−50c), upwards (+50c) and one tone upwards (+200c). The changes are notated on a three-line staff (one for each pitch), using occidental notation borrowed from that used by percussion instruments. Below those staffs, a box is depicts the gradual movements over time of ‘expression’ type pedals, specifically a volume pedal and a ‘whammy pedal’, programmed to cover an interval of a fourth. In this space, notation adopts a hybrid form: a shaft and a hook indicate the temporal location of the beginning and end of the sequence; the movement of the foot is indicated by a line whose limits are given by those of the frame; finally, a representation of the minimum and maximum values of the effect used.
De toucher de lignes by composer Julien Malaussena, bar 1–5, p. 7 (This extract is published with the kind permission of de Julien Malaussena).

We find another example of recent notation for pedal in the piece Grattos of Netanya, composed by Ivan Zetina (Figure 5). The score presents two complementary symbolic elements. First, the score does not feature the traditional measure breakdown: a bar is placed above the staff, providing time indications in minutes and seconds. Next, the representation of foot movement for expression-type pedals is placed beneath the staff of traditional notation. A textual instruction, along with the lateral positioning of the foot, specifies which pedal to use (wah-wah for the right foot and volume for the left foot).
Excerpt from Grattos of Netanya composed by Ivan Zetina (This extract is published with the kind permission of Ivan Zetina).

These examples highlight some notation principles of the electric guitar and are associated with its idiosyncratic manipulation techniques. To address those manipulations, the pedals are therefore developed with two types of gestural access: 1) the control of parameters via manipulable potentiometers and 2) foot-based playing (volume, expression, switches, etc.). According to Lähdeoja, with these parameter manipulations, the ‘processing control is relegated to the body’s periphery’ (Lähdeoja Reference Lähdeoja2008: 3), while real-time parameter evolution remains difficult:
due to the lack of gestural means to control its complex environment, the electric guitar has generally remained within a fixed timbre paradigm: with the help of effects, one or more desired timbres are developed in ‘reserve’, then recalled during playing by on/off switches (Lähdeoja Reference Lähdeoja2008: 3).
Consequently, since pedals are usually used as a sound processing tool, with a secondary role of manipulation, the notation of manipulation still need investigation: ‘there is still no system of notation concerning the use of effects […]’ (Fabbri Reference Fabbri2002: 172).
Effects pedals notation is most often limited to a minimal level of sound processing or to switching (e.g., clear sound to saturated sound) with fixed, predefined settings. However, some musicians have rethought the use of effect pedals. For example, over the past few years, guitarist Julien Desprez has been developing a specific ‘pedal playing’ technique, with the intention of revisiting electric guitar playing modes.Footnote 1 This practice generates a singular aesthetic and artistic approach and develops a physical commitment that requires specific training and increases the body’s palette.Footnote 2 Musicians of the Japanese noise scene also made the use of pedals one of the core elements of their artistic practice. In this case, the pedals are often placed on a table, and the evolution of the parameters is controlled by the hands to generate the sound material (Novak Reference Novak2013).Footnote 3
The notation of the piece for effect pedals Étude n°1 was notated by drawing from the various symbols developed by composers of contemporary music, such as the absence of bar, temporal indications and gesture representation. Similar to the musicians of the noise and experimental scene, the pedal set of Étude n°1 is not considered a tool for processing the sound of an external source. It is designed to be played and manipulated and is regarded as a fully-fledged musical instrument. The musical notation of effect pedals becomes central.
3. Methodology
The first stage of the composition process for Étude n°1 involved a reflective approach to the implementation of the instrument. Indeed, the choice of effects pedals and their arrangement suggests different artistic directions, both in the development of compositional tools and in the elaboration of an aesthetic. For this piece, this research is therefore a key part of the methodology. Then, the creation of musical materials was carried out through experimentation with the instrument. This phase allows a first familiarisation with the instrument, both in terms of gestures and possible sonic materials. Strongly influenced by the notion of sequence-play, as documented notably by Annette Vande Gorne (Vande Gorne Reference Vande Gorne2017) and Bernard Parmegiani (Mion et al. Reference Mion, Nattiez and Thomas1982),Footnote 4 improvisation is then considered as a tool to test different configurations, particularly pedal combinations, parameter associations and values, in order to highlight a gesture that generates a bank of potentially usable timbres. When a configuration proves particularly interesting, the entire set of settings is recorded in writing. The notion of trial and error is an essential part of this stage (Canonne Reference Canonne2009). Indeed, it allows for a certain serendipity that sometimes reveals interesting surprises.
In a third stage, this bank of gesture–timbre pairs serves as musical material to be organised over time. During this phase, it became apparent that taking notes continuously on paper caused a loss of focus on the intended musical thread. This constraint led to a reflection on possible documentation methods. The solution was found in the recording capabilities offered by the studio. When a gesture–timbre pair seems relevant, several performances are recorded and filmed to effectively document its most developed version and thus facilitate the necessary memory recall of the parameters involved. These recording-documents (Arbo Reference Arbo, Arbo and Lephay2017),Footnote 5 witnesses of a sonic event at a given moment, serve as a reference for the final stage: the notation and formalisation of the musical score of the piece.
4. The instrumental apparatus
The instrument consists of a set of effect pedals and a computer-based signal routing matrix. The instrumental apparatus is designed to be portable and easy to set up. It is designed to be potentially adaptable: while the piece is composed with a specific set of pedals, it could be reinterpreted using a different pedal set with these core characteristics:
-
the sound source must be generated through a no-input process, and its evolution must depend on a single parameter;
-
the pedal set must include:
-
○ two different multimode filters;
-
○ two distortions;
-
○ one delay;
-
○ one delay with controllable feedback;
-
○ a loop recording pedal, with the ability to change playback speed.
-
The selection of pedals was made during a period of preliminary reflection on their sonic possibilities. The intention is to have a mix of relatively versatile tools alongside those with a more pronounced character. Additionally, each pedal had to be easily interchangeable to allow for the interpretation of the piece with a different set of pedals. Aside from the Red Panda Tensor, four common types of sound processing are prioritised: reverbs, delays, filters and distortions.
The pedals of the original set are comprising a Benidub Digital Echo, a Fairfield Unpleasant Surprise, a Red Panda Tensor, an Old Blood Noise Endeavors (OBNE) Float, a Strymon Timeline, a Death By Audio Evil Filter, a Strymon BigSky and an Electro-Harmonix (EHX) Holiest Grail.
Despite the recurrence of processing,Footnote 6 this configuration offers a wide palette of sound colours, thanks to the assertive character of each pedal and the matrix architecture of audio signal routing.
A computer-based system is hosting the routing matrix.Footnote 7 While the use of this kind of system is not usual in the effect pedals users community, the choice of this type of architecture was made for several reasons.
First of all, it offers work efficiency during the sound research period since it is not necessary to unplug the pedals to change the order of the signal path. Additionally, it allows for the creation of parallel audio paths, a process that differs from the traditional use of pedals, which are usually connected in series. Furthermore, this architecture induces a specific type of instrumental playing, particularly suited to improvisation, enabling real-time changes to quickly experiment with numerous combinations both in series and in parallel. The possibilities for timbre creation are thus easily multiplied.
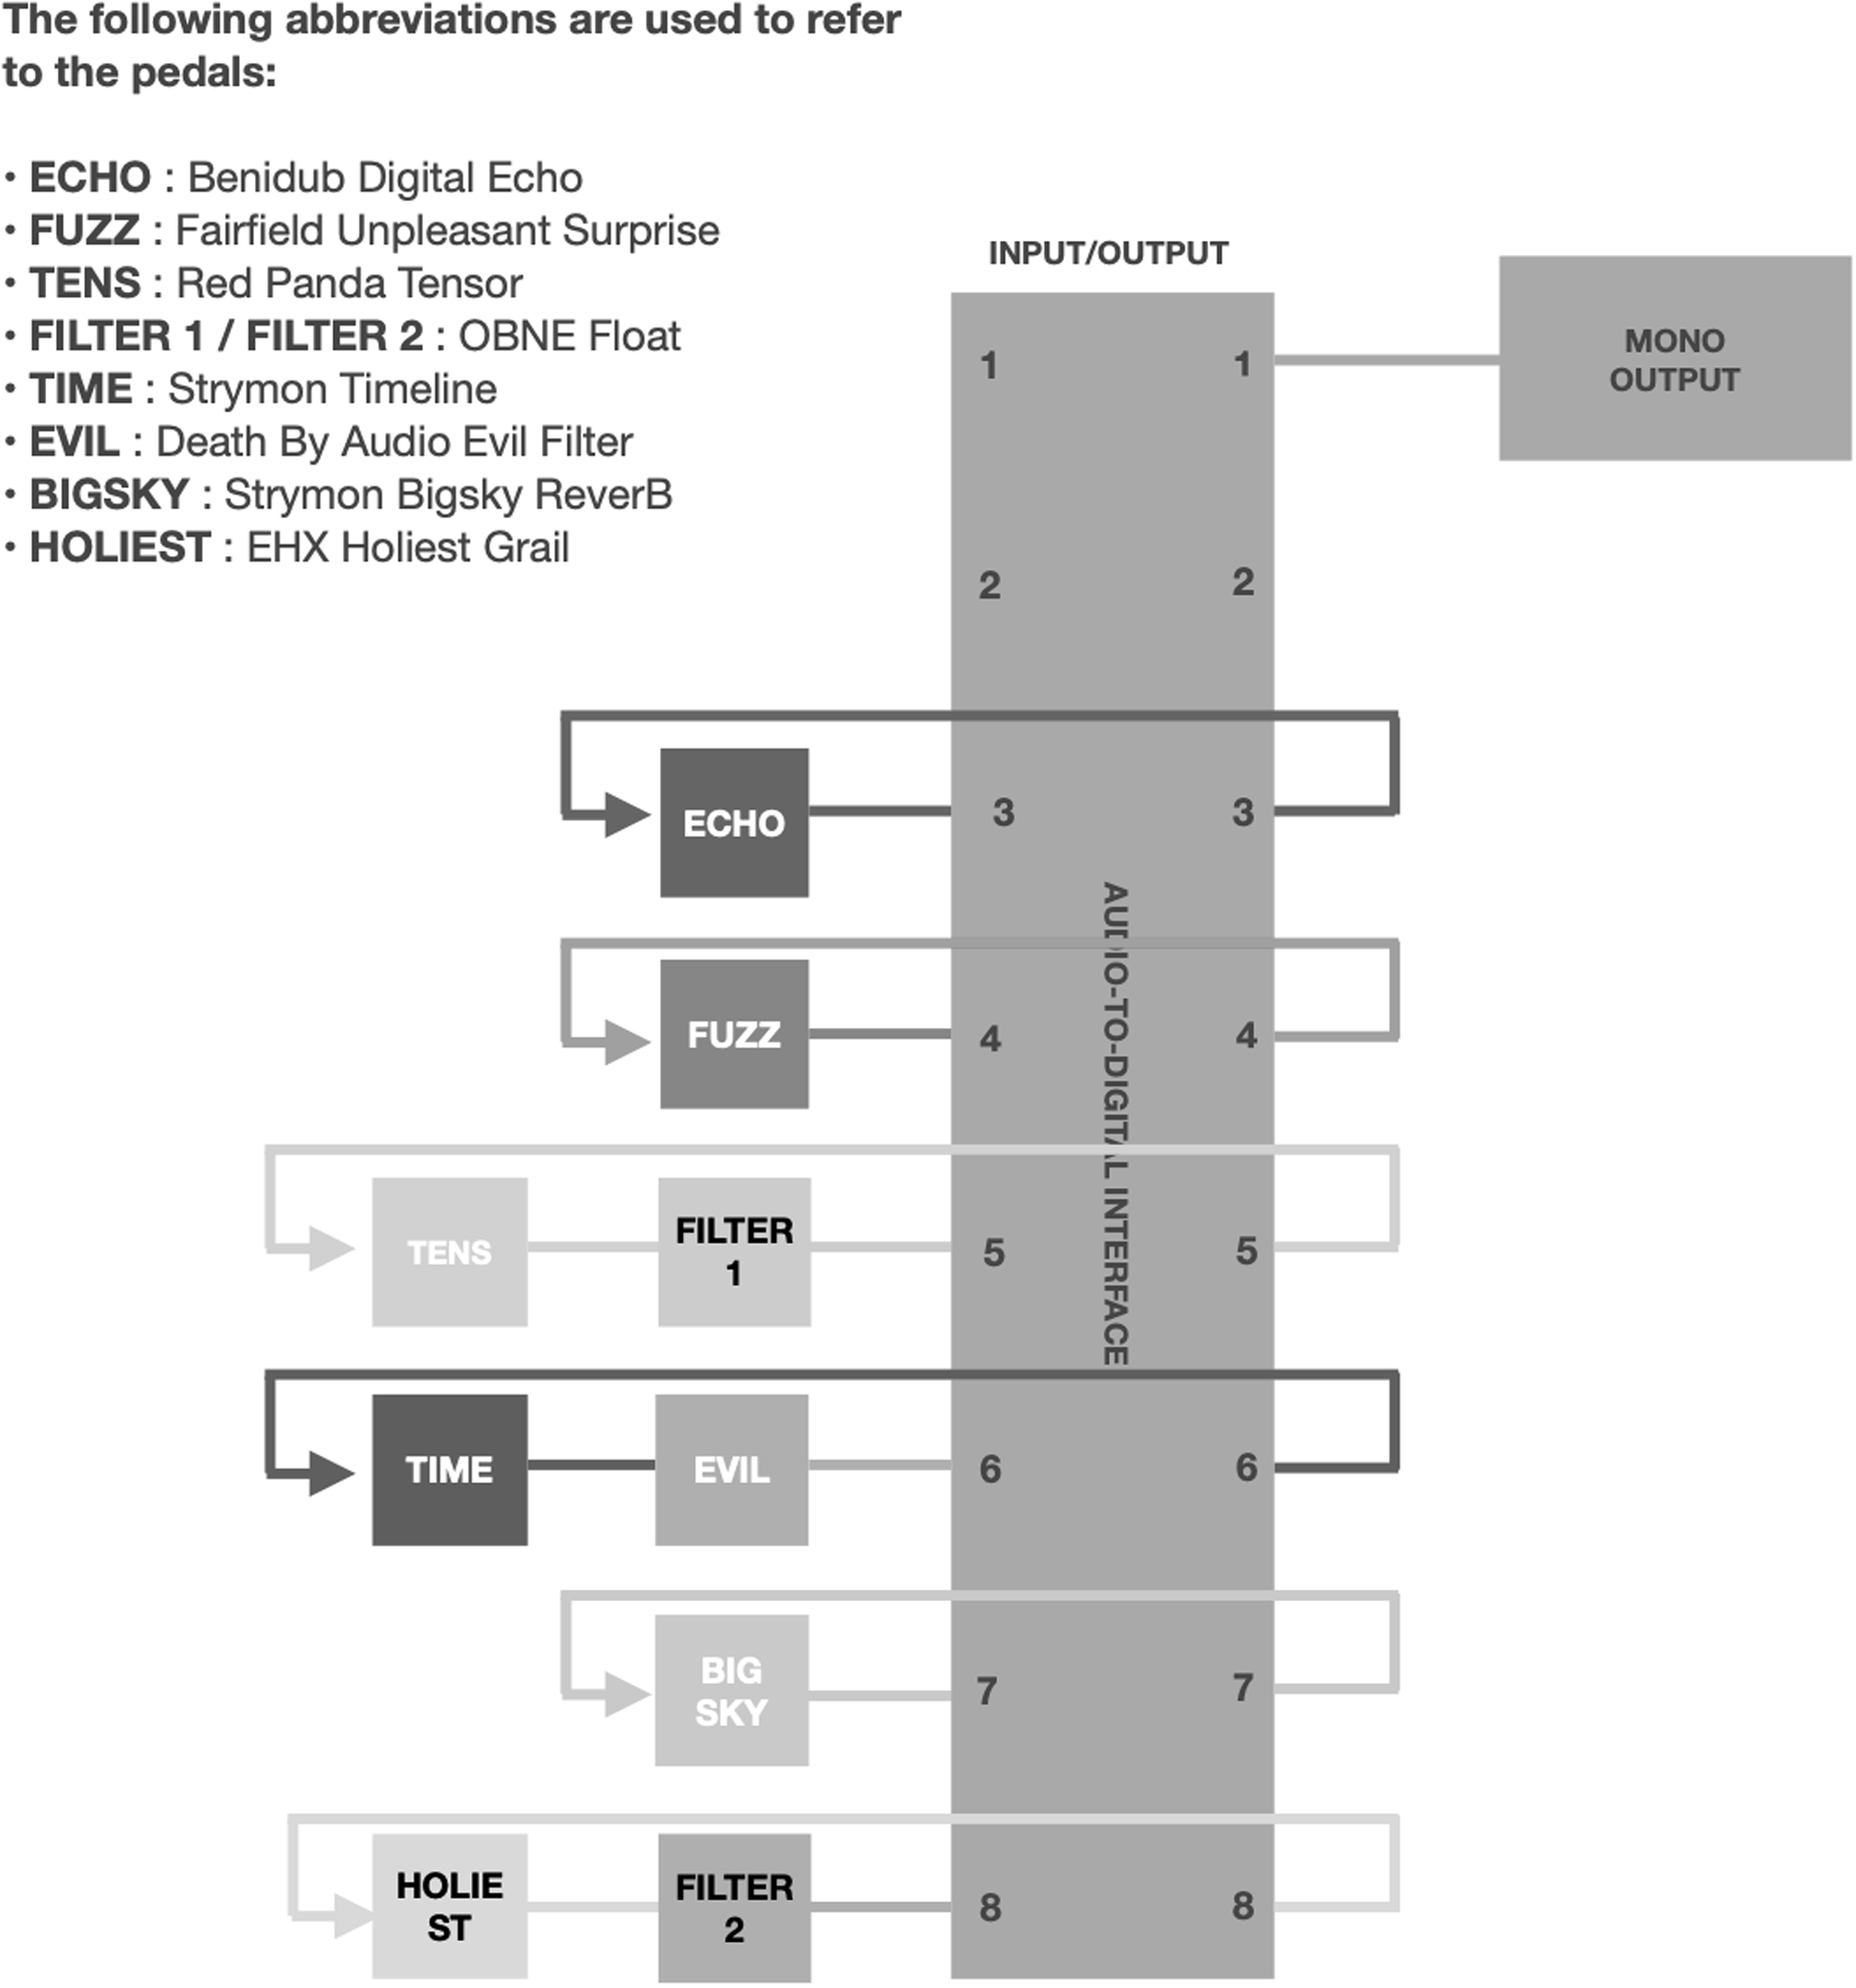
The routing matrix is first composed of an audio-to-digital interface with eight inputs and eight outputs. The outputs of the pedals are connected to the inputs of the interface with a 1/4 cable, and the inputs of the pedals are connected to the outputs of the interface following this wiring diagram (Figure 6). For example:
-
the output of the Benidub Digital Echo pedal is connected to input 3 of the audio-to-digital interface;
-
output 3 of the audio-to-digital interface is connected to the input of the Benidub Digital Echo pedal.
Pedal assembly diagram.

Typically, digital audio interfaces have eight inputs and eight outputs. For this piece, as ten pedals are used, some are connected in series. For example:
-
the output of the Strymon Timeline pedal is connected to the input of the Death By Audio Evil Filter pedal;
-
the output of the Death By Audio Evil Filter pedal is connected to input 6 of the audio-to-digital interface;
-
output 6 of the audio-to-digital interface is connected to the input of the Strymon Timeline pedal.
The function of the matrix is to route the internal audio signal of the audio-to-digital interface. It can be implemented in any computer platform capable of generating auxiliary sends. For this project, the matrix was created using Usine Hollyhock software.Footnote 8
Each of the interface’s inputs can be routed to each of its outputs (Figure 7). For example, the Benidub Digital Echo pedal is wired into input 3 of the audio-to-digital interface:
-
is always routed post-fader to the interface’s output 1 (all inputs are routed to this output, which is dedicated to the loudspeaker). In this way, the performer has control over the volume on the general output 1 of each channel;
-
can be routed pre-fader to interface outputs 4, 5, 6, 7 or 8 (output 2 is not used). In this way, the signal is routed independently of the channel volume assigned to general output 1. This allows for more complex sound configurations;Footnote 9
-
is never routed to interface output 3, to avoid potentially damaging audio feedback for the pedal (this applies to all pedal inputs with the exception of inputs and outputs 8, which is the only one to generate feedback).
Schematic diagram of matrix transmissions within the audio-to-digital interface.

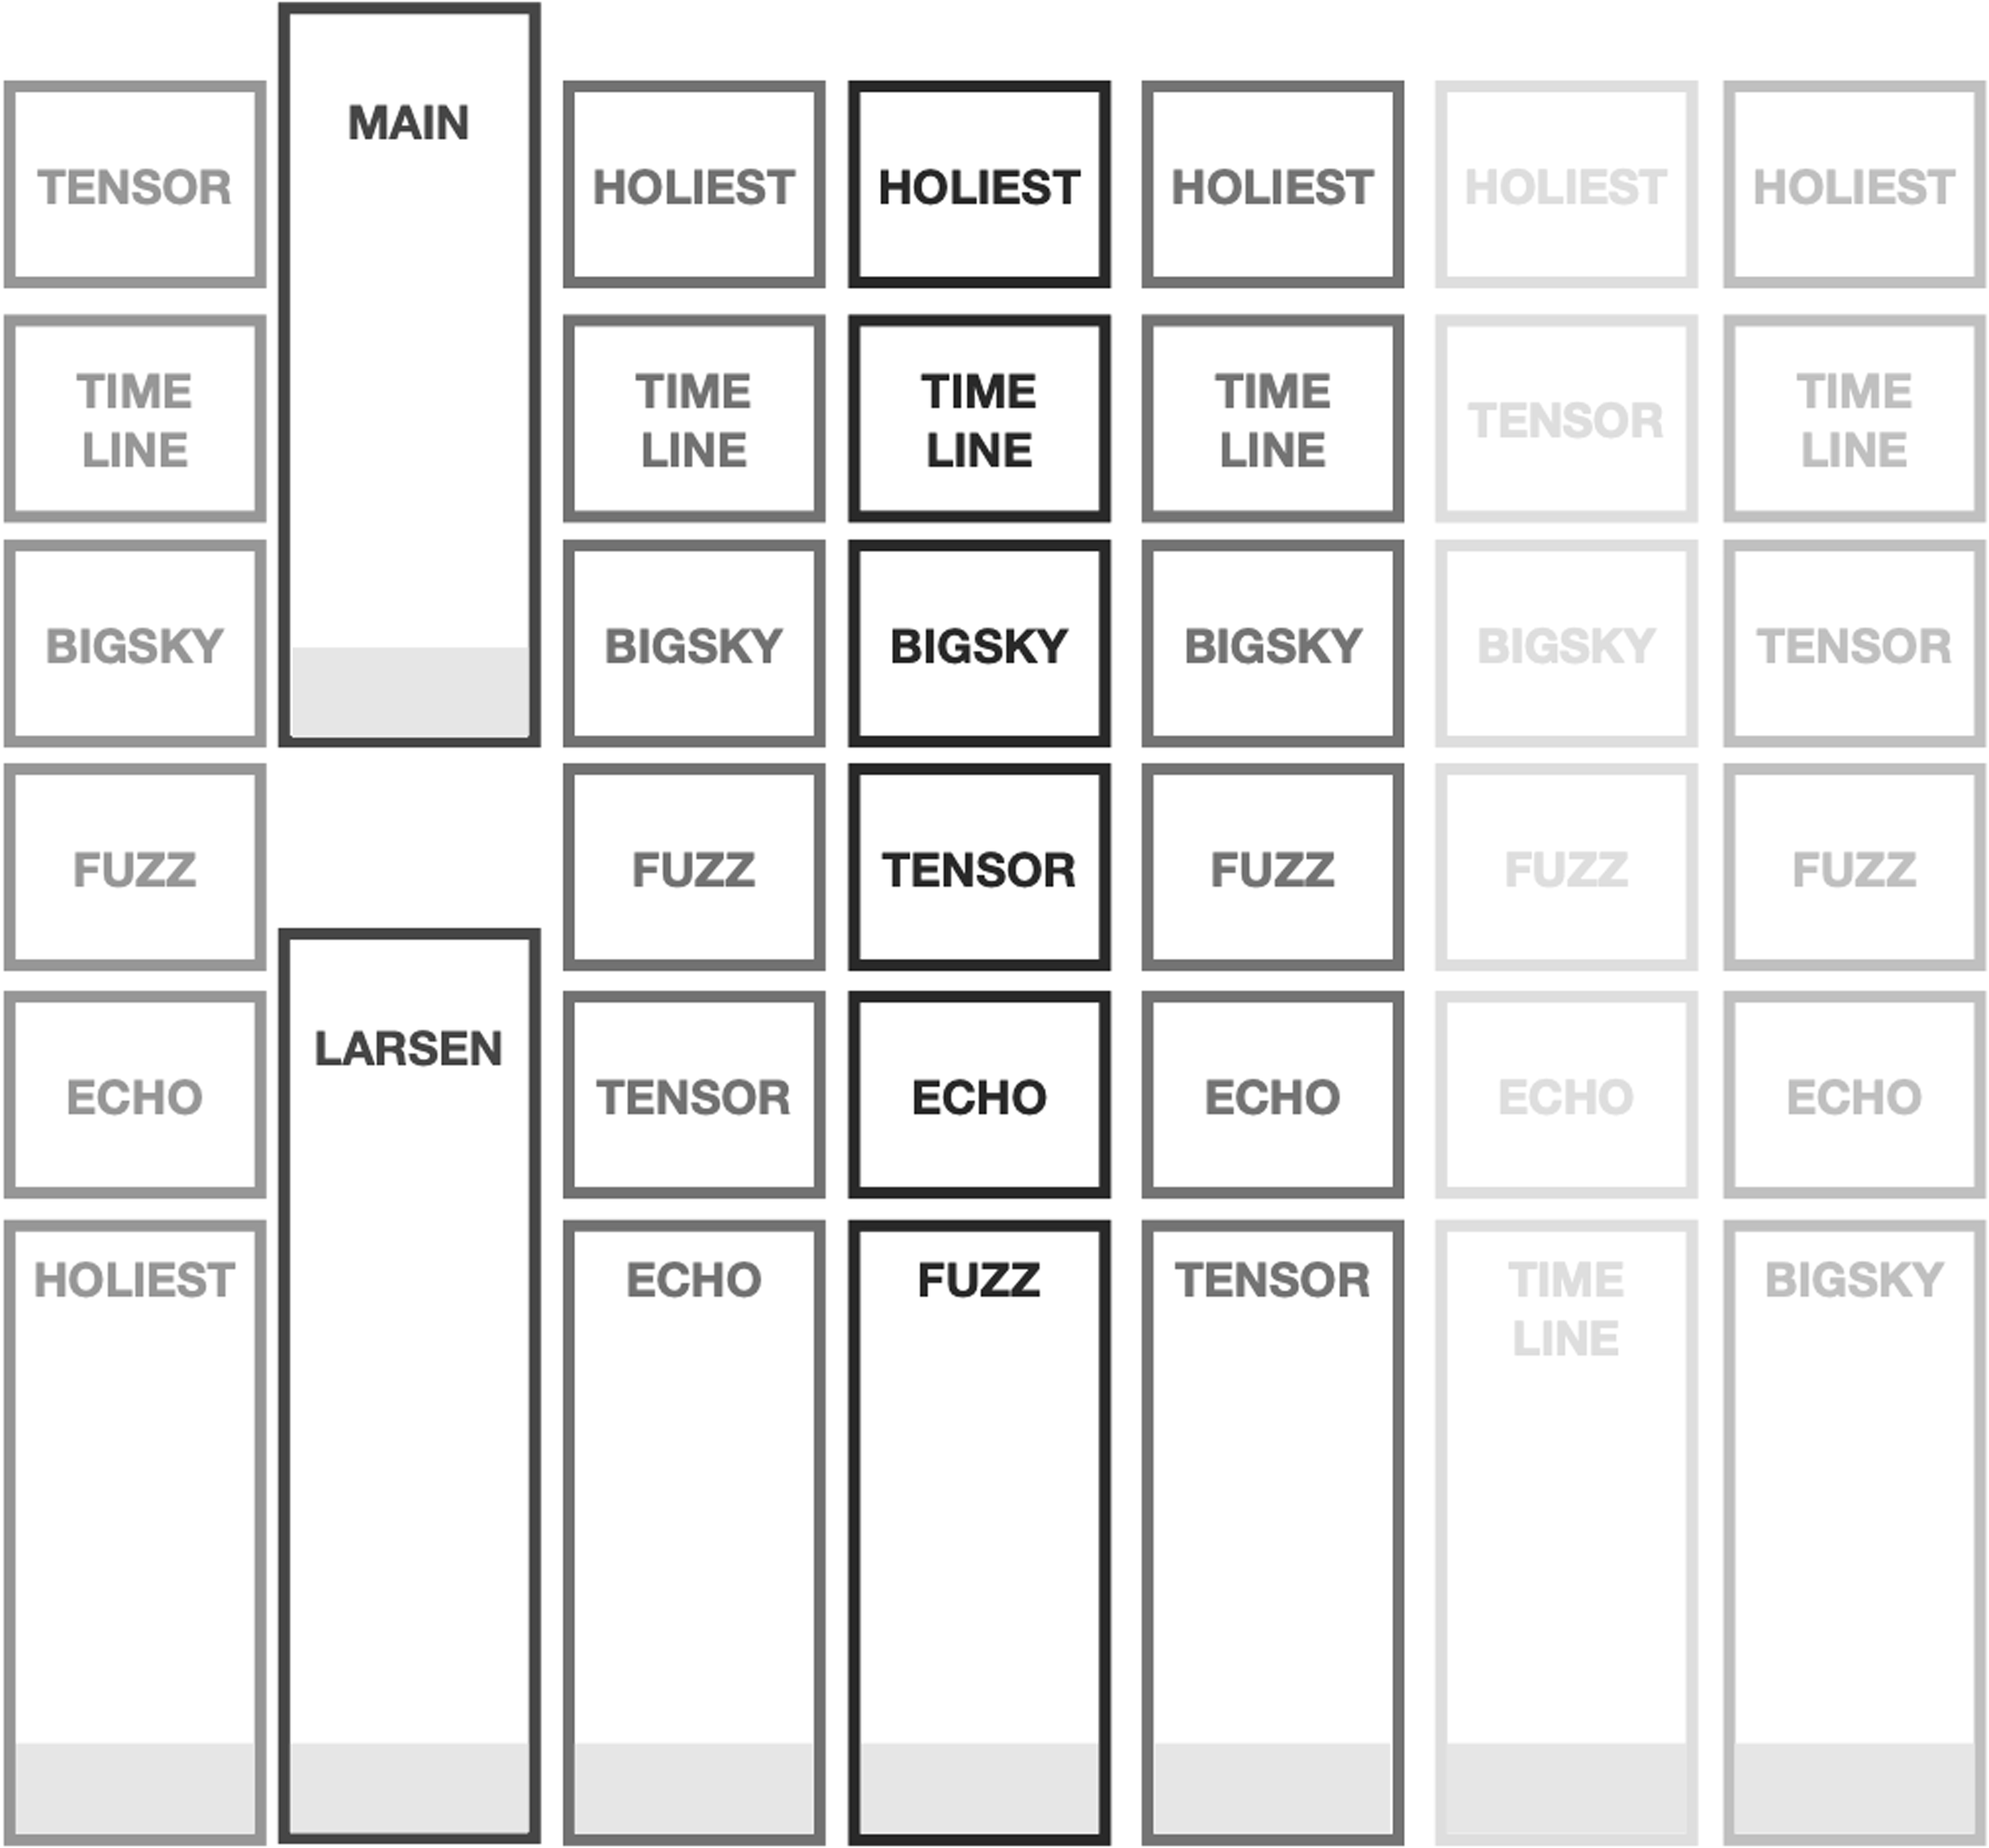
Matrix sends can be controlled by any MIDI interface. For this project, this function is assigned to the iOS application LemurFootnote 10 (Figure 8). The sends are triggered by pressing buttons located above the channels. This system links the colour of the track, which is the source of the audio signal to be routed, with the name of the pedal, the recipient of said signal. For example, when the blue ‘HOLIEST’ button above the ‘ECHO’ channel is activated, it means that the audio signal from input 3 (the output of the Benidub Digital Echo pedal) is routed to output 8 of the audio-to-digital interface (the input of the EHX Holiest Grail pedal). Additionally, the ‘LARSEN’ channel manages the audio feedback from output 8 to input 8 with a continuous gesture. This allows for fine control of the feedback generated, which is the central sonic material of Étude n°1. Finally, ‘MAIN’ is a channel that controls the overall output volume of all the channels and allows it to be adjusted according to real-time performance conditions.
Schematic of the iOS Lemur application for this project.

In this set-up, the function of the computer is to route the audio signal; it does not perform any computational sound processing. It can be replaced by a mixing desk with six auxiliary sends.
5. The notation
The score of Étude n°1 opts for graphic notation, essentially showing two elements: the evolution of parameters in time and the signal sends activation. This framework was first adopted with the intention of making the score accessible, easily decipherable and deliberately detached from traditional music notation so the piece can also be performed by non-classically trained musicians. Moreover, due to the relative imprecision of the manipulable parameters of the pedals, the instrumental gesture is difficult to reproduce exactly. With this in mind, the symbols serve an indicative purpose and deliberately leave freedom to the performer. Finally, manipulations concerning volume adjustments should rely on the musician’s sensitivity according to the conditions of presentations, like the response of the sound system, the acoustics and volume of the space.
5.1. Symbols and parameters
The graphic representation of the manipulations was created, hoping to provide the clearest possible reading. First, the colour of the symbol refers to the colour of the parameter to be manipulated on the pedal.Footnote 11 This helps facilitate the identification of the potentiometers during performance and strengthens the connection between the figure and the action it represents. The initial pedal settings page presents the entire set of colour codes and their associated parameters. Some pedals do not have prominent colours; they are primarily grey. In this case, the choice of colour was made arbitrarily (Figure 9).
Page of the default settings listing the colour codes used in the score.

Then, the representation of gestures is made through two symbols: the line and the circle. The lines represent a continuous gesture over time. Moreover, the shape of the line’s ends refers to the shape of the potentiometer being manipulated (square or round).The discontinuity of the line helps add a distinguishing mark between two parameters of the same pedal (Figure 10).
Two examples of graphical representation of the gesture.

Finally, the circles refer to a brief gesture, with a colour associated with the pedal manipulated. The pedal switches are represented by a simple circle, and the rotary potentiometers by a circle with a protrusion which indicates the position to be reached. (Figure 11).
Examples of symbols associated with a brief gesture.

5.2. Graphic structure
The symbols are arranged in space within a structure composed of two zones. First, a space delimited by an abscissa and an ordinate holds the symbols representing the movements made in a continuous gesture. Those are primarily pedal manipulation parameters with the exception of the ‘Larsen’ fader, which is represented by a specific symbol. This trapezoidal-like shape (Figure 12) provides an indicative value of the level to be reached in order to generate the feedback. The performer is free to adjust these levels according to the conditions during real-time performance.
Symbol representing the gesture that generates feedback.

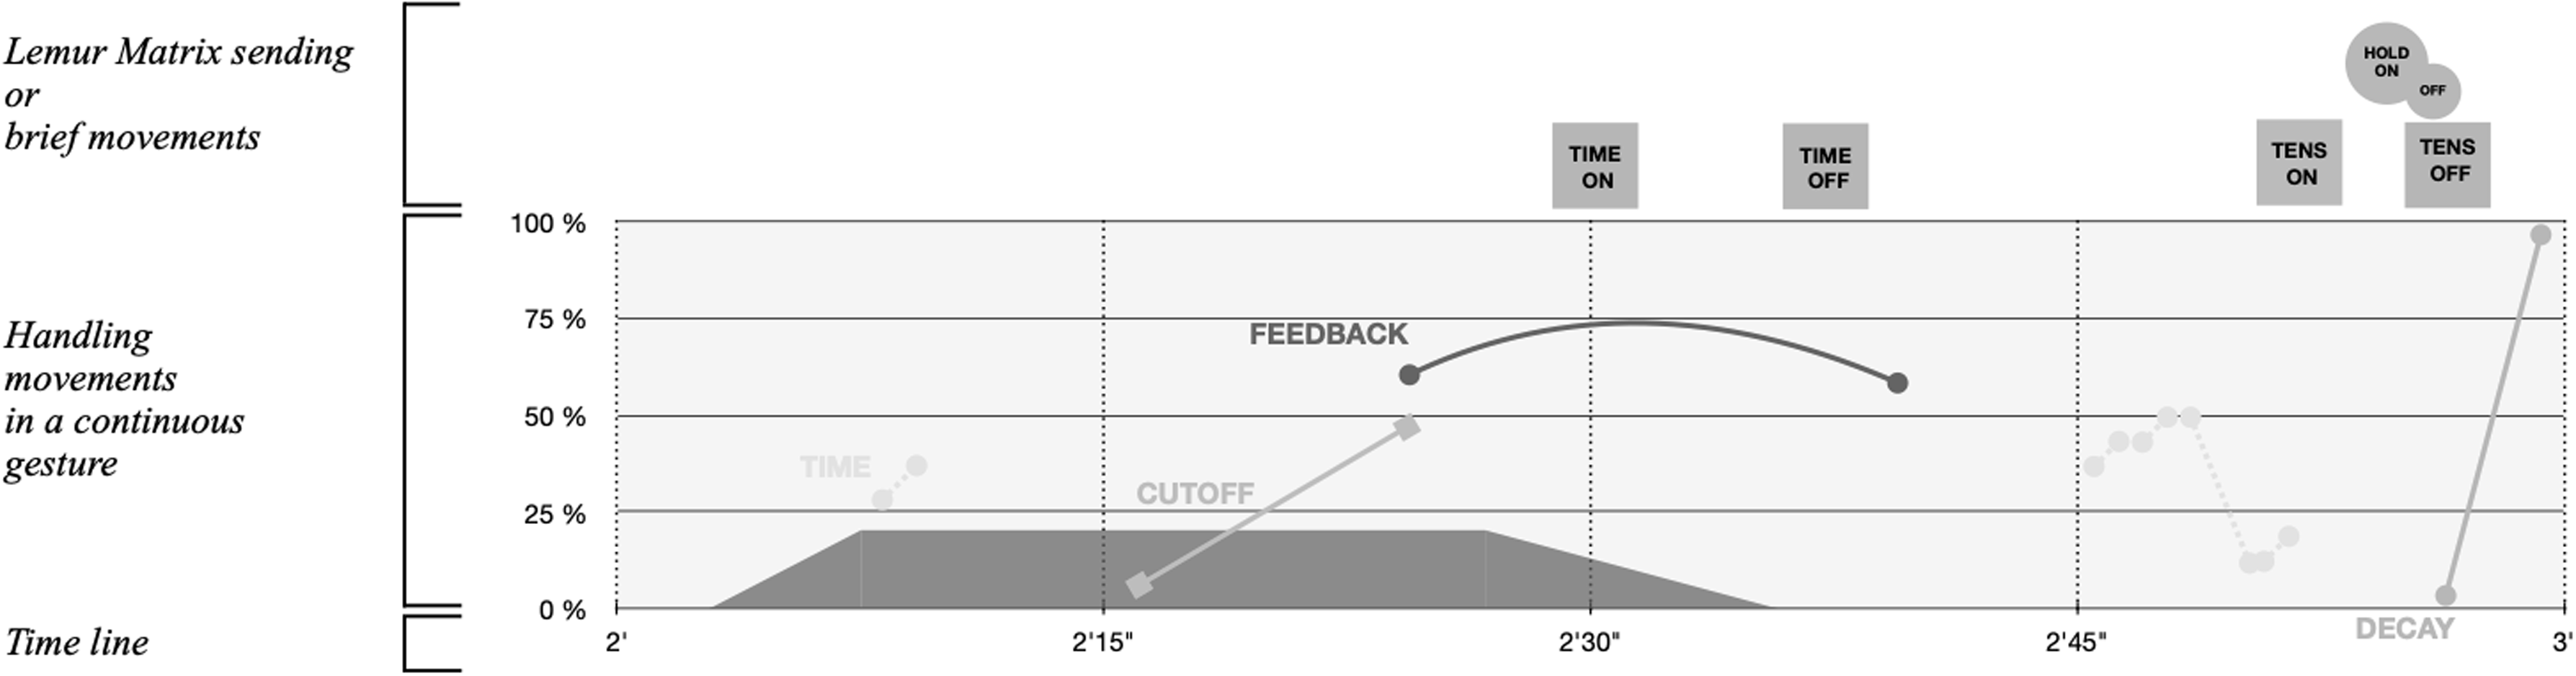
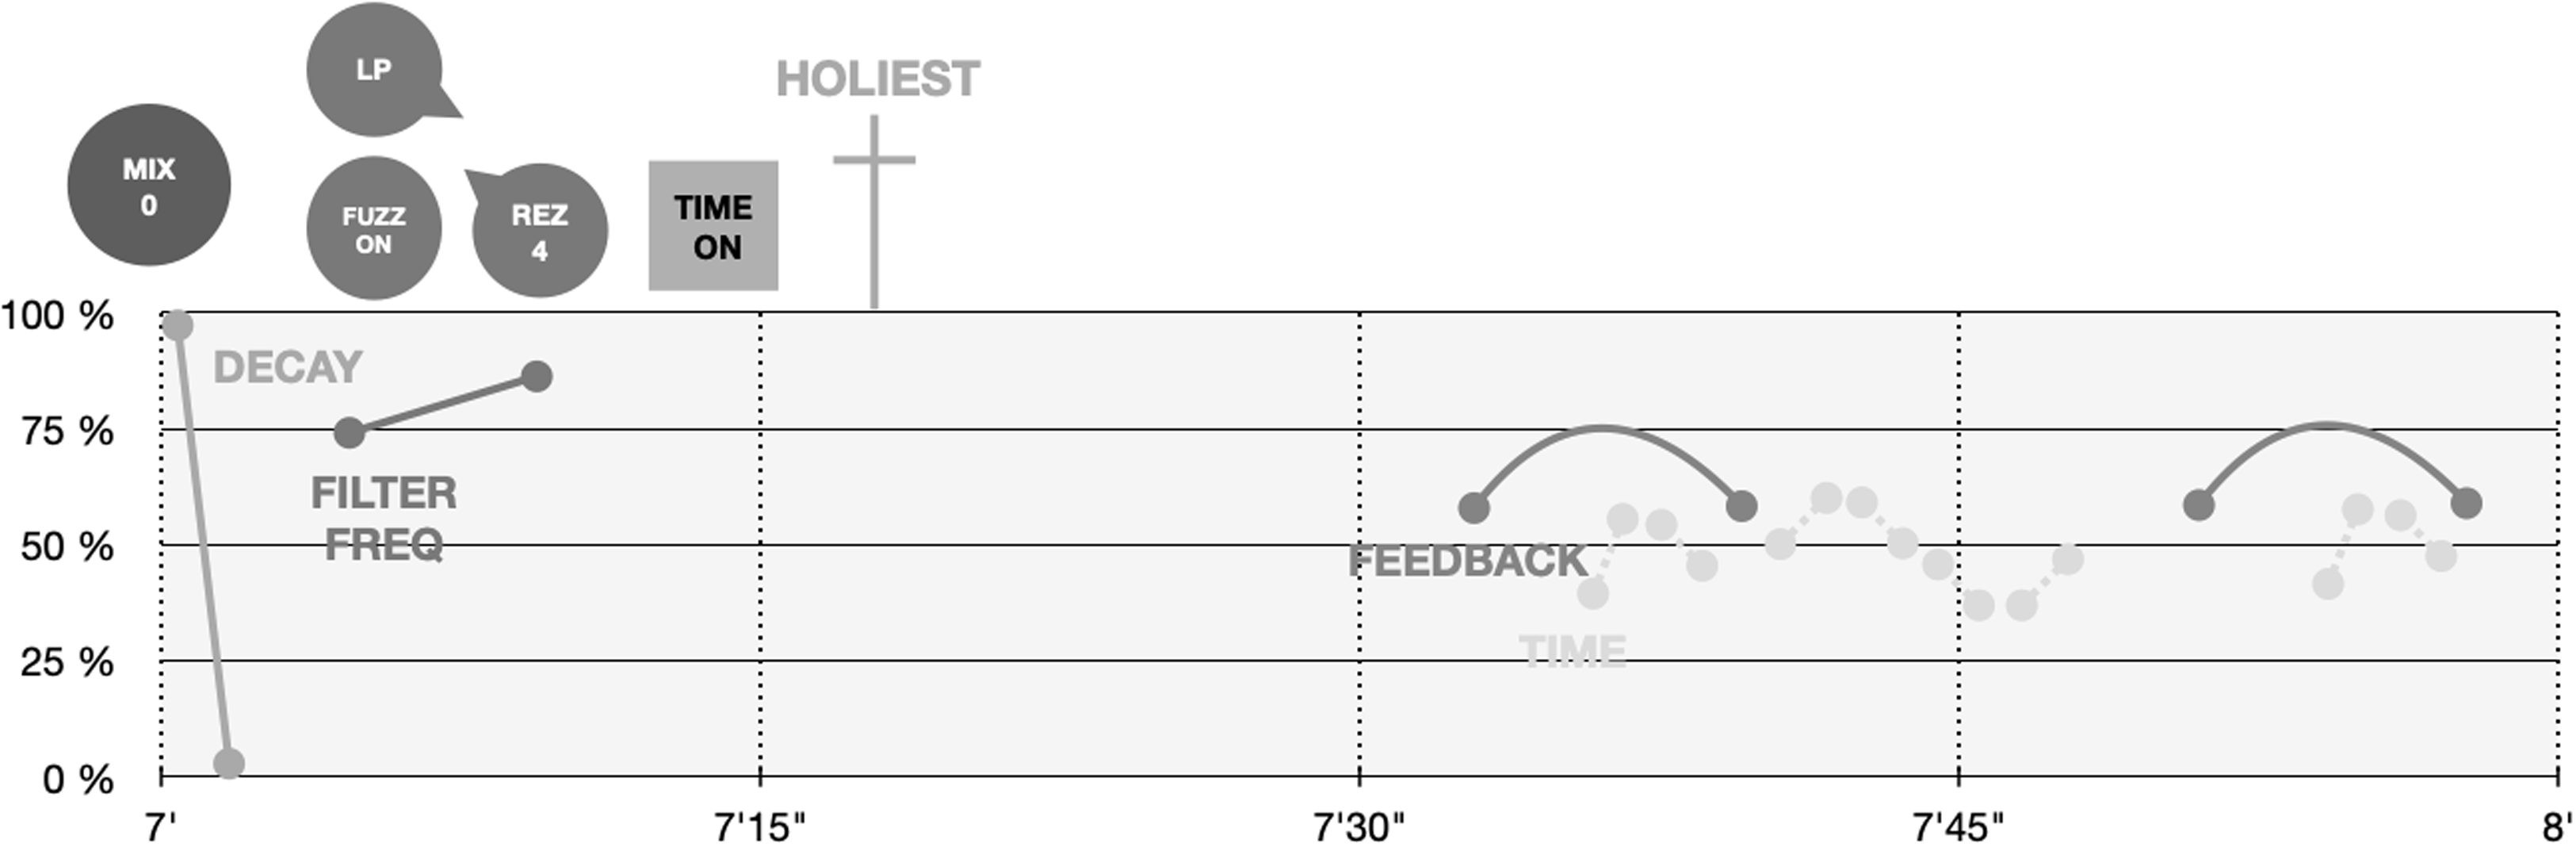
In addition to the colour code, the parameter names are regularly quoted throughout the piece to facilitate their mnemonic recall. The Y axis provides the normative value of the parameter manipulated in percentage, with 0% being the minimum value and 100% the maximum. The X axis gives time indications in minutes and seconds. For improved readability, the graph background is lightly coloured. In addition, the X axis is divided into four equal parts, delimited by lines, according to a sequential breakdown of the values represented (Figures 13 and 14).
Excerpt 1 from the score.

Excerpt 2 from the score.

The upper part of the score indicates the matrix to be performed. Their representation recalls the colour of the channel in the application, the name of the send and its status. For example, the orange ‘Time On’ symbol indicates that the Time button on the Holiest channel of the matrix must be activated.
The matrix architecture allows the pedals to remain engaged at all times. Additionally, some parameters can change radically, for instance, between two sections. Necessary changes (‘bypass’, ‘on’, or a new value, for example) are noted here, with the circle symbol associated with a brief gesture.
The volumes, controlled by the Lemur faders, are left the interpreter’s discretion depending on the location, technical constraints, or their intentions. Where a particular action is required, the indicative value of Lemur faders is shown as in Figure 15.
Representation of Lemur fader forced changes.

6. Evaluation of the Set-up
At the time we write these lines, only one performance of the piece has been carried out by electronic music performer and composer Rémy Jannelle, using the same set of pedals for shaping the sonic materials that compose Étude n°1. Footnote 12 With the aim of evaluating the relevance of the score, it was entrusted to the performer with no instructions other than those contained in the document. This performance revealed that the compositional intent and the sonic result are quite close, with the timbral differences between the initial version by David Caulet and the interpretation being the result of the freedom given to the performer by the score.
Then, the initial feedback from Jannelle highlighted that the matrix architecture for routing the audio signal, and especially its implementation, could prove problematic. Indeed, to create this matrix, the composer used tools familiar to him but not necessarily common.Footnote 13 Consequently, to ensure better portability and to offer the piece to performers under optimal conditions, it will be implemented on several more common platforms, such as Ableton Live or Max8. This work will be complemented by the search for a more generic MIDI control solution.
Finally, thanks to the performer, certain details in the notation and indications have been improved to make the score clearer. It was notably specified in the booklet that the temporal notation of sound events remains indicative, and that volume settings are left to the performer’s discretion.
The piece is composed with the intention of being offered to various musicians. One perspective will be to interpret it with a different set of instruments, left to the musician’s free choice, in order to evaluate the effectiveness of the notation as well as the relevance of the approach, aiming not to fix the choice of pedals to be used.
7. Conclusion
Étude n°1 is a piece whose score is part of an approach to representing effect pedal gestures. The decision to adopt this type of graphic notation, which only transcribes time and the evolution of parameters, also stems from a reflection on the thorny issue of timbre notation (Smalley Reference Smalley1997; Traube Reference Traube2015). There are several reasons that led to the exclusion of this representation during the creation of the score. First, the feedback, the primary sonic material around which the piece is built, has a relatively unpredictable character. Indeed, the timbral quality of this material is necessarily dependent on the equipment that generates it.
Then there are several ways of looking at his relationship with the notion of the work and the score. Étude n°1 is composed within an approach inspired by improvisation. This practice establishes real-time performance as a creative process in its own right. In this sense, the score is considered as a support for the work that is embodied in the performance, rather than as the work itself. This principle suggests the assumption that each interpretation can yield different sonorities, depending on the equipment used, the playing conditions and the performer, and can thus potentially offer a reading that generates a new version of the piece.
Étude n°1 is a composition whose musical notation is specifically dedicated to the use of effects pedals. As its name suggests, this composition presents an initial proposal for strategies to represent the musical gesture dedicated to effect pedals, with the aim of real-time interpretation of electronic music. The experimentation phase revealed that the implemented instrument provided the possibility of generating a wide range of sonic materials. A final perspective, therefore, is to explore this capacity and to envisage the creation of a corpus of work that will invite the evolution and enrichment of the principles of the performative notation principles.