



%20--%3e%3c!DOCTYPE%20svg%20PUBLIC%20'-//W3C//DTD%20SVG%201.0//EN'%20'http://www.w3.org/TR/2001/REC-SVG-20010904/DTD/svg10.dtd'%3e%3csvg%20version='1.0'%20id='Layer_1'%20xmlns='http://www.w3.org/2000/svg'%20xmlns:xlink='http://www.w3.org/1999/xlink'%20x='0px'%20y='0px'%20width='64px'%20height='64px'%20viewBox='5.5%20-3.5%2064%2064'%20enable-background='new%205.5%20-3.5%2064%2064'%20xml:space='preserve'%3e%3cg%3e%3ccircle%20fill='%23FFFFFF'%20fill-opacity='0'%20cx='37.785'%20cy='28.501'%20r='28.836'/%3e%3cpath%20fill='%23595959'%20d='M37.441-3.5c8.951,0,16.572,3.125,22.857,9.372c3.008,3.009,5.295,6.448,6.857,10.314%20c1.561,3.867,2.344,7.971,2.344,12.314c0,4.381-0.773,8.486-2.314,12.313c-1.543,3.828-3.82,7.21-6.828,10.143%20c-3.123,3.085-6.666,5.448-10.629,7.086c-3.961,1.638-8.057,2.457-12.285,2.457s-8.276-0.808-12.143-2.429%20c-3.866-1.618-7.333-3.961-10.4-7.027c-3.067-3.066-5.4-6.524-7-10.372S5.5,32.767,5.5,28.5c0-4.229,0.809-8.295,2.428-12.2%20c1.619-3.905,3.972-7.4,7.057-10.486C21.08-0.394,28.565-3.5,37.441-3.5z%20M37.557,2.272c-7.314,0-13.467,2.553-18.458,7.657%20c-2.515,2.553-4.448,5.419-5.8,8.6c-1.354,3.181-2.029,6.505-2.029,9.972c0,3.429,0.675,6.734,2.029,9.913%20c1.353,3.183,3.285,6.021,5.8,8.516c2.514,2.496,5.351,4.399,8.515,5.715c3.161,1.314,6.476,1.971,9.943,1.971%20c3.428,0,6.75-0.665,9.973-1.999c3.219-1.335,6.121-3.257,8.713-5.771c4.99-4.876,7.484-10.99,7.484-18.344%20c0-3.543-0.648-6.895-1.943-10.057c-1.293-3.162-3.18-5.98-5.654-8.458C50.984,4.844,44.795,2.272,37.557,2.272z%20M37.156,23.187%20l-4.287,2.229c-0.458-0.951-1.019-1.619-1.685-2c-0.667-0.38-1.286-0.571-1.858-0.571c-2.856,0-4.286,1.885-4.286,5.657%20c0,1.714,0.362,3.084,1.085,4.113c0.724,1.029,1.791,1.544,3.201,1.544c1.867,0,3.181-0.915,3.944-2.743l3.942,2%20c-0.838,1.563-2,2.791-3.486,3.686c-1.484,0.896-3.123,1.343-4.914,1.343c-2.857,0-5.163-0.875-6.915-2.629%20c-1.752-1.752-2.628-4.19-2.628-7.313c0-3.048,0.886-5.466,2.657-7.257c1.771-1.79,4.009-2.686,6.715-2.686%20C32.604,18.558,35.441,20.101,37.156,23.187z%20M55.613,23.187l-4.229,2.229c-0.457-0.951-1.02-1.619-1.686-2%20c-0.668-0.38-1.307-0.571-1.914-0.571c-2.857,0-4.287,1.885-4.287,5.657c0,1.714,0.363,3.084,1.086,4.113%20c0.723,1.029,1.789,1.544,3.201,1.544c1.865,0,3.18-0.915,3.941-2.743l4,2c-0.875,1.563-2.057,2.791-3.541,3.686%20c-1.486,0.896-3.105,1.343-4.857,1.343c-2.896,0-5.209-0.875-6.941-2.629c-1.736-1.752-2.602-4.19-2.602-7.313%20c0-3.048,0.885-5.466,2.658-7.257c1.77-1.79,4.008-2.686,6.713-2.686C51.117,18.558,53.938,20.101,55.613,23.187z'/%3e%3c/g%3e%3c/svg%3e)
%20--%3e%3c!DOCTYPE%20svg%20PUBLIC%20'-//W3C//DTD%20SVG%201.0//EN'%20'http://www.w3.org/TR/2001/REC-SVG-20010904/DTD/svg10.dtd'%3e%3csvg%20version='1.0'%20id='Layer_1'%20xmlns='http://www.w3.org/2000/svg'%20xmlns:xlink='http://www.w3.org/1999/xlink'%20x='0px'%20y='0px'%20width='64px'%20height='64px'%20viewBox='5.5%20-3.5%2064%2064'%20enable-background='new%205.5%20-3.5%2064%2064'%20xml:space='preserve'%3e%3cg%3e%3ccircle%20fill='%23FFFFFF'%20fill-opacity='0'%20cx='37.637'%20cy='28.806'%20r='28.276'/%3e%3cg%3e%3cpath%20fill='%23595959'%20d='M37.443-3.5c8.988,0,16.57,3.085,22.742,9.257C66.393,11.967,69.5,19.548,69.5,28.5c0,8.991-3.049,16.476-9.145,22.456%20C53.879,57.319,46.242,60.5,37.443,60.5c-8.649,0-16.153-3.144-22.514-9.43C8.644,44.784,5.5,37.262,5.5,28.5%20c0-8.761,3.144-16.342,9.429-22.742C21.101-0.415,28.604-3.5,37.443-3.5z%20M37.557,2.272c-7.276,0-13.428,2.553-18.457,7.657%20c-5.22,5.334-7.829,11.525-7.829,18.572c0,7.086,2.59,13.22,7.77,18.398c5.181,5.182,11.352,7.771,18.514,7.771%20c7.123,0,13.334-2.607,18.629-7.828c5.029-4.838,7.543-10.952,7.543-18.343c0-7.276-2.553-13.465-7.656-18.571%20C50.967,4.824,44.795,2.272,37.557,2.272z%20M46.129,20.557v13.085h-3.656v15.542h-9.944V33.643h-3.656V20.557%20c0-0.572,0.2-1.057,0.599-1.457c0.401-0.399,0.887-0.6,1.457-0.6h13.144c0.533,0,1.01,0.2,1.428,0.6%20C45.918,19.5,46.129,19.986,46.129,20.557z%20M33.042,12.329c0-3.008,1.485-4.514,4.458-4.514s4.457,1.504,4.457,4.514%20c0,2.971-1.486,4.457-4.457,4.457S33.042,15.3,33.042,12.329z'/%3e%3c/g%3e%3c/g%3e%3c/svg%3e)
%20--%3e%3c!DOCTYPE%20svg%20PUBLIC%20'-//W3C//DTD%20SVG%201.0//EN'%20'http://www.w3.org/TR/2001/REC-SVG-20010904/DTD/svg10.dtd'%3e%3csvg%20version='1.0'%20id='Layer_1'%20xmlns='http://www.w3.org/2000/svg'%20xmlns:xlink='http://www.w3.org/1999/xlink'%20x='0px'%20y='0px'%20width='64px'%20height='64px'%20viewBox='5.5%20-3.5%2064%2064'%20enable-background='new%205.5%20-3.5%2064%2064'%20xml:space='preserve'%3e%3cg%3e%3ccircle%20fill='%23FFFFFF'%20fill-opacity='0'%20cx='36.924'%20cy='28.403'%20r='28.895'/%3e%3cpath%20fill='%23595959'%20d='M37.442-3.5c8.99,0,16.571,3.085,22.743,9.256C66.393,11.928,69.5,19.509,69.5,28.5c0,8.992-3.048,16.476-9.145,22.458%20C53.88,57.32,46.241,60.5,37.442,60.5c-8.686,0-16.19-3.162-22.513-9.485C8.644,44.728,5.5,37.225,5.5,28.5%20c0-8.762,3.144-16.343,9.429-22.743C21.1-0.414,28.604-3.5,37.442-3.5z%20M12.7,19.872c-0.952,2.628-1.429,5.505-1.429,8.629%20c0,7.086,2.59,13.22,7.77,18.4c5.219,5.144,11.391,7.715,18.514,7.715c7.201,0,13.409-2.608,18.63-7.829%20c1.867-1.79,3.332-3.657,4.398-5.602l-12.056-5.371c-0.421,2.02-1.439,3.667-3.057,4.942c-1.622,1.276-3.535,2.011-5.744,2.2%20v4.915h-3.714v-4.915c-3.543-0.036-6.782-1.312-9.714-3.827l4.4-4.457c2.094,1.942,4.476,2.913,7.143,2.913%20c1.104,0,2.048-0.246,2.83-0.743c0.78-0.494,1.172-1.312,1.172-2.457c0-0.801-0.287-1.448-0.858-1.943l-3.085-1.315l-3.771-1.715%20l-5.086-2.229L12.7,19.872z%20M37.557,2.214c-7.276,0-13.428,2.571-18.457,7.714c-1.258,1.258-2.439,2.686-3.543,4.287L27.786,19.7%20c0.533-1.676,1.542-3.019,3.029-4.028c1.484-1.009,3.218-1.571,5.2-1.686V9.071h3.715v4.915c2.934,0.153,5.6,1.143,8,2.971%20l-4.172,4.286c-1.793-1.257-3.619-1.885-5.486-1.885c-0.991,0-1.876,0.191-2.656,0.571c-0.781,0.381-1.172,1.029-1.172,1.943%20c0,0.267,0.095,0.533,0.285,0.8l4.057,1.83l2.8,1.257l5.144,2.285l16.397,7.314c0.535-2.248,0.801-4.533,0.801-6.857%20c0-7.353-2.552-13.543-7.656-18.573C51.005,4.785,44.831,2.214,37.557,2.214z'/%3e%3c/g%3e%3c/svg%3e)
%20--%3e%3c!DOCTYPE%20svg%20PUBLIC%20'-//W3C//DTD%20SVG%201.0//EN'%20'http://www.w3.org/TR/2001/REC-SVG-20010904/DTD/svg10.dtd'%3e%3csvg%20version='1.0'%20id='Layer_1'%20xmlns='http://www.w3.org/2000/svg'%20xmlns:xlink='http://www.w3.org/1999/xlink'%20x='0px'%20y='0px'%20width='64px'%20height='64px'%20viewBox='5.5%20-3.5%2064%2064'%20enable-background='new%205.5%20-3.5%2064%2064'%20xml:space='preserve'%3e%3cg%3e%3ccircle%20fill='%23FFFFFF'%20fill-opacity='0'%20cx='36.944'%20cy='28.631'%20r='29.105'/%3e%3cg%3e%3cpath%20fill='%23595959'%20d='M37.443-3.5c8.951,0,16.531,3.105,22.742,9.315C66.393,11.987,69.5,19.548,69.5,28.5c0,8.954-3.049,16.457-9.145,22.514%20C53.918,57.338,46.279,60.5,37.443,60.5c-8.649,0-16.153-3.143-22.514-9.429C8.644,44.786,5.5,37.264,5.5,28.501%20c0-8.723,3.144-16.285,9.429-22.685C21.138-0.395,28.643-3.5,37.443-3.5z%20M37.557,2.272c-7.276,0-13.428,2.572-18.457,7.715%20c-5.22,5.296-7.829,11.467-7.829,18.513c0,7.125,2.59,13.257,7.77,18.4c5.181,5.182,11.352,7.771,18.514,7.771%20c7.123,0,13.334-2.609,18.629-7.828c5.029-4.876,7.543-10.99,7.543-18.343c0-7.313-2.553-13.485-7.656-18.513%20C51.004,4.842,44.832,2.272,37.557,2.272z%20M23.271,23.985c0.609-3.924,2.189-6.962,4.742-9.114%20c2.552-2.152,5.656-3.228,9.314-3.228c5.027,0,9.029,1.62,12,4.856c2.971,3.238,4.457,7.391,4.457,12.457%20c0,4.915-1.543,9-4.627,12.256c-3.088,3.256-7.086,4.886-12.002,4.886c-3.619,0-6.743-1.085-9.371-3.257%20c-2.629-2.172-4.209-5.257-4.743-9.257H31.1c0.19,3.886,2.533,5.829,7.029,5.829c2.246,0,4.057-0.972,5.428-2.914%20c1.373-1.942,2.059-4.534,2.059-7.771c0-3.391-0.629-5.971-1.885-7.743c-1.258-1.771-3.066-2.657-5.43-2.657%20c-4.268,0-6.667,1.885-7.2,5.656h2.343l-6.342,6.343l-6.343-6.343L23.271,23.985L23.271,23.985z'/%3e%3c/g%3e%3c/g%3e%3c/svg%3e)
Introduction
Lassa fever, caused by Lassa mammarenavirus, remains a persistent and high-severity zoonotic threat across West Africa, with Nigeria consistently serving as the global epicentre of annual case burden [Reference Balogun, Akande and Hamer1–3]. Although approximately 80% of infections remain asymptomatic, the clinical progression in symptomatic patients frequently leads to multi-organ haemorrhagic fever, with hospital-based case fatality rate (CFR) ranging from 14% to 31% in Nigeria and reaching up to 69% in neighbouring Sierra Leone [Reference Duvignaud4–Reference Dalhat6]. This wide variance in mortality suggests that the disease’s impact is mediated not only by viral virulence but also by the timeliness of clinical intervention and the robustness of local healthcare responses. Within this context, this study proposes the Reporting Completeness Index (RCI) as a quantitative measure of ‘surveillance sensitivity’ – a fundamental evaluative attribute defined by the Centres for Disease Control and Prevention (CDC) as the proportion of total health events in a population successfully captured by a monitoring system [7].
Official surveillance figures are widely recognized as representing only a fraction of the true epidemiological burden, creating a significant ‘ascertainment gap’ in national statistics. Recent secondary analyses of Nigerian surveillance records reveal that laboratory-confirmed cases account for a mere 14.1% of reported suspected infections, despite evidence that transmission is now occurring year-round across nearly 95% of the country [Reference Abbah8]. Furthermore, back-calculation models estimate that across endemic West Africa, only 58% to 63% of expected severe cases are actually reported to national authorities [Reference Simons9]. This implies that passive case-finding protocols, constrained by limited diagnostic access and health-seeking barriers, effectively act as a bottleneck that systematically omits mild or community-level infections [Reference Gibb10, Reference McCormick11]. While prior studies have quantified this gap cross-sectionally, there is a critical need to examine whether reporting completeness has evolved longitudinally as Nigeria’s surveillance infrastructure has modernized.
Since 2018, Nigeria has undergone a fundamental transformation in its infectious disease surveillance architecture, shifting from a reactive, fragmented system to a proactive, digitally integrated framework. This modernization aligns with the WHO Global Strategy on Digital Health 2020–2025, which prioritizes the establishment of interoperable disease-monitoring ecosystems [12]. Key investments by the Nigeria Centre for Disease Control and Prevention (NCDC) include the launch of a National Lassa Fever Incident Management System, a five-fold expansion of the network of certified diagnostic laboratories, and the nationwide deployment of the Surveillance Outbreak Response Management and Analysis System (SORMAS) from 2019 [13–16]. These technological and institutional shifts, representing the most significant overhaul of Nigerian surveillance since the 2014 Ebola response, were specifically designed to enable real-time, multidirectional data sharing among field officers and diagnostic hubs [Reference Ogaji and Brisibe17]. Despite the scale of these investments, no study has yet quantified their specific effect on Lassa fever–reporting completeness within a rigorous longitudinal analytical framework.
This article provides an empirical quantification of these surveillance gains by proposing the RCI as a transparent and annually recomputable metric of system performance. The study applies non-parametric trend statistics, Monte Carlo uncertainty propagation, and change-point detection to characterize the RCI trajectory in Nigeria from 2012 to 2025. Furthermore, the national findings are cross-checked for consistency using independent state-level case series from Edo and Ondo States, which together represent approximately 61% of the national confirmed burden during the NCDC era. By using reported deaths as an anchor for back-calculation, this methodology overcomes the inherent limitations of case-counting and provides a more representative view of system sensitivity over time. Ultimately, this analysis addresses persistent methodological gaps in the literature by testing five different CFR assumptions and accounting for temporal autocorrelation, thereby providing a diagnostic tool for monitoring surveillance performance in resource-limited endemic settings.
Methods
Data sources
Three data sources were used. The primary national surveillance dataset comprised weekly Lassa fever situation reports published by the NCDC, covering epidemiological Week 1 of 2020 through Week 52 of 2025 (complete year;
$ n=312 $
 weekly observations). The dataset was extracted into a structured comma-separated values (CSV) file containing national counts of suspected cases, confirmed cases, probable cases, and deaths.
Annual national data for 2012–2019 were obtained from the validated multi-country Lassa fever surveillance dataset compiled by Simons [Reference Simons9], which integrates information from ProMED-mail, NCDC reports, and peer-reviewed publications. Only records corresponding to Nigeria at the national level (region = ‘all’) were retained. For overlapping years (2020–2022), NCDC surveillance data were used as the primary source to ensure consistency with the weekly reporting system. Simons compilation and the NCDC situation reports both apply the WHO/NCDC-standard Lassa fever case classification (suspected, probable, and confirmed), and confirmed status in both sources requires laboratory confirmation (RT-PCR or equivalent); we are not aware of a formal change to this case definition over 2012–2025. However, reporting procedures were not static: the pre-2018 era relied on ad hoc situation reports and ProMED-mail compilation, whereas the post-2019 era used the standardized weekly SORMAS-integrated NCDC pipeline. We cannot fully rule out that this procedural shift, rather than case-definition change per se, contributed to the step increase in reported cases; this is acknowledged as a limitation of combining pre- and post-2019 data sources (Section ‘Limitations and future directions’). State-level weekly confirmed-case series for Edo and Ondo States (2018–2025) were provided by collaborating investigators and were used for state-level consistency analyses (Section ‘State-level consistency analysis’). State-level mortality data for Edo and Ondo States (2018–2022) were obtained from the Simons dataset. Because these states contributed to the epidemiological evidence base underlying the reference case-fatality rate (CFR), these analyses should be interpreted as consistency checks rather than fully independent validation.
The weekly surveillance dataset underwent quality-control checks prior to analysis. No missing values were identified in the core count variables. The logical constraint confirmed cases
$ \le $
 suspected cases was satisfied for all 312 weekly observations. Additional checks confirmed non-negative counts for all surveillance indicators.
Reporting completeness index (RCI)
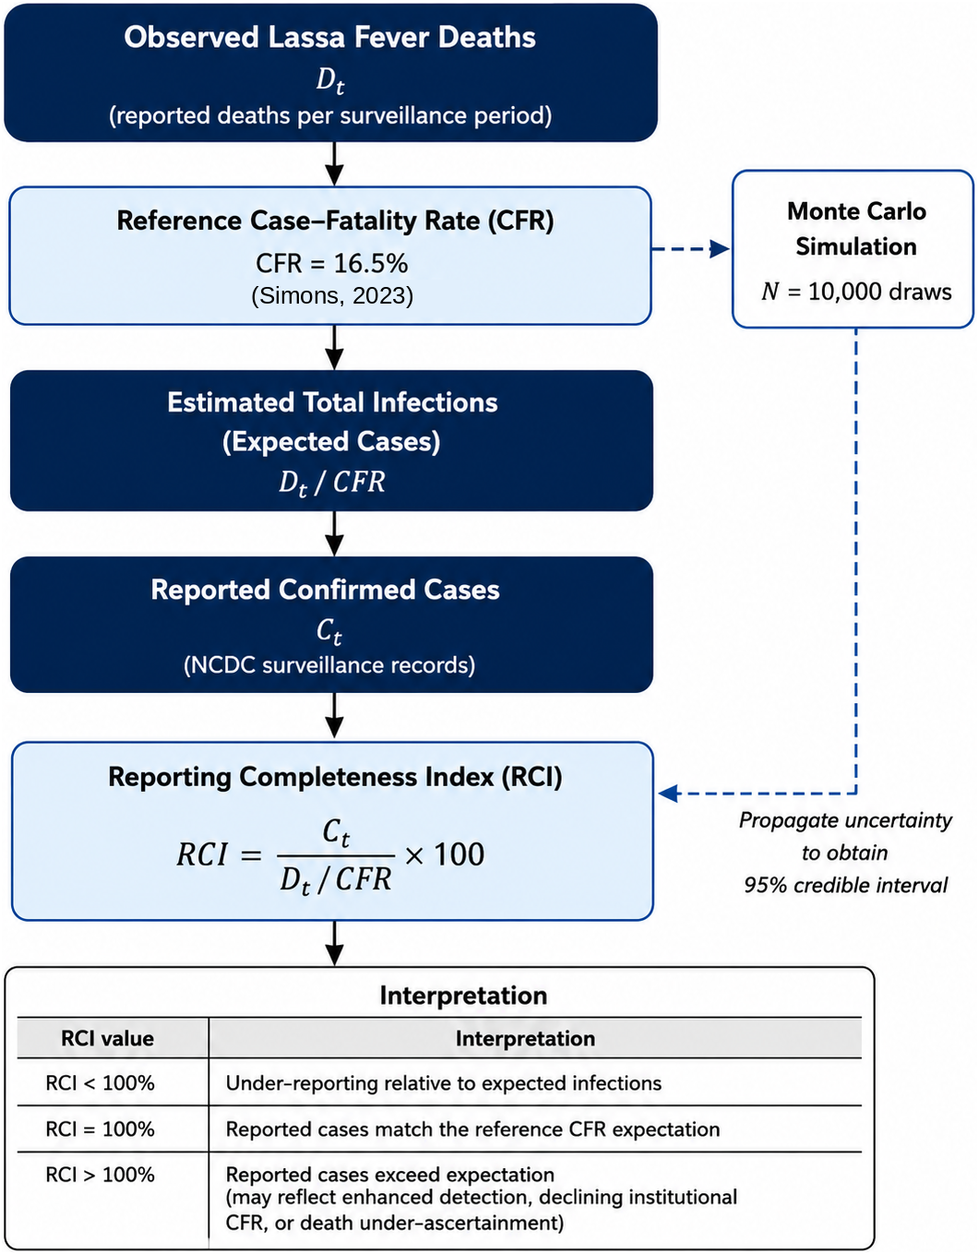
The methodology for the RCI adopts a pathogen-based incidence approach, employing ‘multiplication factors’ to link observed health outcomes (mortality) to estimated infections. This technique is foundational to burden estimation in settings characterized by significant under-ascertainment [Reference Kretzschmar18]. The conceptual framework for the RCI calculation, including the propagation of uncertainty through Monte Carlo simulation, is illustrated in Figure 1.
Conceptual framework of the Reporting Completeness Index (RCI). Observed deaths are back calculated using a reference case-fatality rate (CFR) to estimate expected infections, which are then compared with reported confirmed cases to derive the RCI. Uncertainty is propagated through Monte Carlo simulation ((N = 10,000)).

Figure 1. Long description
A vertical flowchart with a side simulation box and a bottom interpretation table detailing the RCI framework: 1. Observed Lassa Fever Deaths (Dt): Reported deaths per period. 2. Reference Case–Fatality Rate (CFR): 16.5% (Simons , 2023). 3. Estimated Total Infections (Expected Cases): Dt / CFR. 4. Reported Confirmed Cases (Ct): NCDC records. 5. Reporting Completeness Index (RCI): (Ct / (Dt / CFR)) * 100. Monte Carlo Simulation Box: N = 10,000 draws to obtain 95% credible intervals. Interpretation Table: RCI < 100% indicates under-reporting; RCI = 100% matches CFR expectation; RCI > 100% indicates reported cases exceed expectation.
The RCI for year
$ t $
 is defined as:

where
$ {C}_t $
 is the number of reported confirmed cases in year
$ t $
 ,
$ {D}_t $
 is the number of reported deaths, and
$ {CFR}_{ref} $
 is a reference CFR. Under this formulation,
$ {D}_t/{CFR}_{ref} $
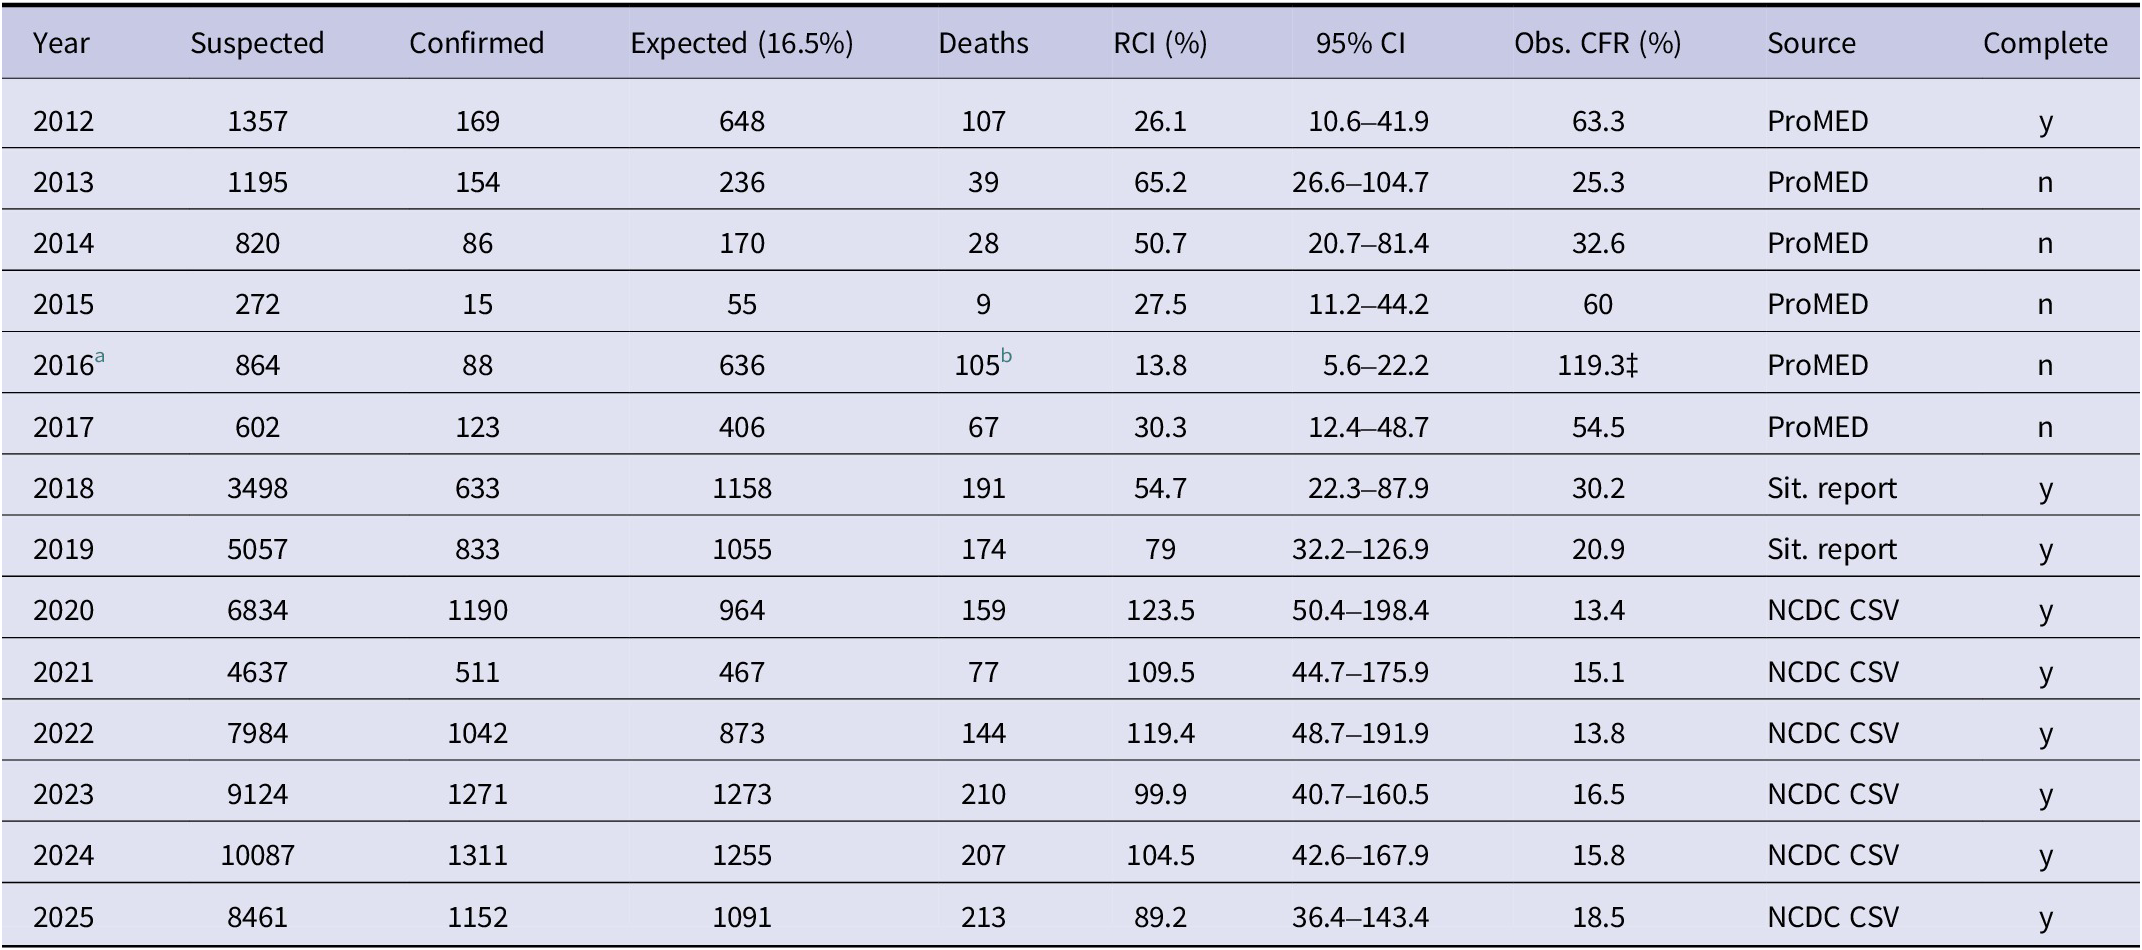
 estimates the number of cases that would be expected to produce the observed death count. An RCI of 100% indicates that reported cases match expectations under the reference CFR; values below 100% indicate underreporting relative to the reference mortality scenario. For example, in 2012, reported deaths (D = 107) imply an expected case count of 107/0.165 ≈ 648 under the reference CFR; with 169 confirmed cases actually reported, RCI2012 = (169/648) × 100 = 26.1%, indicating that only about a quarter of the cases expected from the observed mortality were captured by surveillance that year.
Interpretation caveat
An RCI exceeding 100% does not demonstrate complete case ascertainment. It indicates that reported cases exceed those expected under the reference CFR assumption. This can arise from (i) improved surveillance detecting mild cases with low fatality risk, (ii) a true decline in institutional CFR owing to earlier diagnosis or better treatment, (iii) incomplete death ascertainment at the denominator, or (iv) some combination. These alternative explanations are addressed in Section ‘Interpretation of RCI values above 100%’.
The reference CFR of 16.5% (SD 5.0%) was taken from Simons (2023) Method 3, which used confirmed cases and deaths from Edo and Ondo States between 2017 and 2021, the highest-quality surveillance data available for Nigeria, in which deaths are reliably linked to laboratory-confirmed cases [Reference Simons9]. This is the most conservative (lowest) of the three Simon’s CFR estimates. We recognize that holding
$ {CFR}_{ref} $
 fixed at 16.5% across the full 2012–2025 window is a simplifying assumption: the value was itself estimated from 2017 to 2021 Edo/Ondo data and may not perfectly represent earlier years or other states. We consider this acceptable for two reasons. First, the primary claim of this study is the direction and existence of the reporting-completeness trend, not the precise absolute level of RCI in any single year. A fixed reference CFR does not bias trend or change-point estimates unless the true CFR itself trended over time in a way that mimics the detected 2019 break. Second, the five-scenario sensitivity analysis (10–25%; Tables 1, 3) shows that the qualitative conclusion that statistically significant post-2019 improvement holds under every tested CFR assumption, even though the absolute RCI level shifts accordingly. The fixed-CFR assumption is therefore best understood as a scaling choice rather than a source of directional bias.
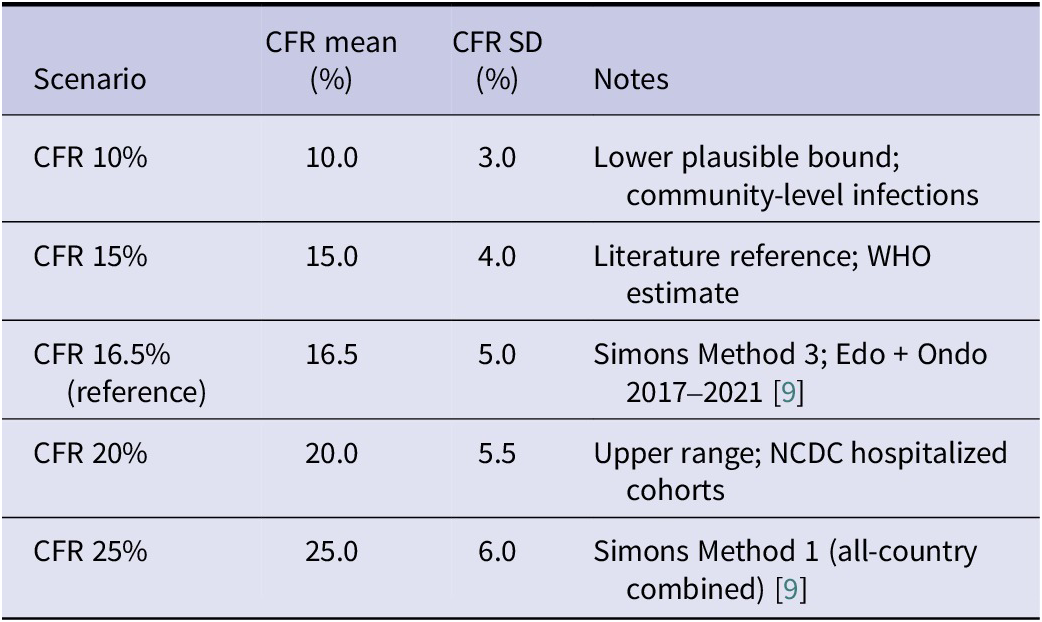
CFR assumptions used in sensitivity analysis. Reference scenario in bold

Table 1. Long description
Table 1 summarizes case-fatality rate (CFR) assumptions used in sensitivity analysis, including mean, standard deviation (SD), and notes across five scenarios: 1. CFR 10%: Mean 10.0%, SD 3.0%, Lower plausible bound; community-level infections. 2. CFR 15%: Mean 15.0%, SD 4.0%, Literature reference; WHO estimate. 3. CFR 16.5% (Reference scenario): Mean 16.5%, SD 5.0%, Simons Method 3; Edo + Ondo 2017–2021 [11]. 4. CFR 20%: Mean 20.0%, SD 5.5%, Upper range; NCDC hospitalized cohorts. 5. CFR 25%: Mean 25.0%, SD 6.0%, Simons Method 1 (all-country combined) [Reference Simons[9]].
CFR sensitivity analysis
A primary concern for any death-based back-calculation is the assumption that CFR is constant over time and across settings. We addressed this in two ways. First, a formal sensitivity analysis was conducted under five alternative CFR assumptions: 10%, 15%, 16.5% (reference), 20%, and 25%, each with corresponding uncertainty parameters (Table 1). Second, we tested whether the observed CFR (computed from reported deaths and confirmed cases in each year) exhibited a significant temporal trend using Mann–Kendall and Spearman rank tests, treating a significant CFR decline as evidence that RCI trends may partly reflect changing clinical outcomes rather than solely surveillance improvement (see Section ‘Observed CFR trend: Confound assessment’).
Monte Carlo uncertainty propagation
As depicted in Figure 1 procedural flow, uncertainty in the reference CFR was propagated via Monte Carlo simulation (N = 10,000 draws) using a truncated normal distribution:

where
$ \mu $
 and
$ {\sigma}^2 $
 denote the mean and variance of the assumed CFR distribution.

where
$ RC{I}_{t,k} $
 is the
$ k- $
 th Monte Carlo estimate of reporting completeness for year
$ \mathrm{t} $
 .
The 2.5th and 97.5th percentiles of the resulting distribution of RCI values were taken as 95% credible intervals. This was applied to all five CFR scenarios. All simulations used random seed 42.
Trend analysis and change-point detection
Trend tests
The annual RCI series was short (
$ n=14 $
 ) and its distribution could not be assumed to be normal; non-parametric methods were adopted as the primary analytical approach. The Mann–Kendall test was used to evaluate the null hypothesis of no monotonic trend. Spearman’s rank correlation coefficient was calculated to quantify the strength and direction of the association between year and RCI. Prior to trend analysis, the 2016 observation was identified as an outlier using the Grubbs test and a robust z score criterion. It was therefore excluded from subsequent analyses. The data quality issues underlying this exclusion are detailed in the Section ‘Results’. For comparative purposes, parametric ordinary least squares (OLS) regression was also computed, with year centred to improve numerical stability. A second degree polynomial fit was computed as well.

where
$ {y}_j $
 and
$ {y}_j $
 are observations at times
$ j $
 and
$ i $
 , respectively. A 95% confidence interval (CI) was derived from 5000 bootstrap resamples drawn with replacement from the n = 13 observations; the 2.5th and 97.5th percentiles of the resulting slope distribution were taken as the CI bounds (Supplementary Methods S1).
Change-point detection
Binary segmentation with a sum of squares (L2) cost function calculated within each segment was applied to detect a mean shift in the annual RCI series, excluding 2016. Each candidate split was evaluated by an F-test (H₀: no mean shift, α = 0.05) with degrees of freedom (1, n - 2). A minimum segment length of three observations was required (Supplementary Methods S2).This procedure is equivalent to the Pruned Exact Linear Time (PELT) method with an L2 cost function and likelihood ratio testing for mean shifts under a normal model [Reference Killick, Fearnhead and Eckley19]. Uncertainty in the breakpoint location was assessed separately from the existence of the break itself. To do this, 1000 bootstrap resamples were used to construct a 95% CI on the breakpoint index. The F test result and the bootstrap CI are reported as separate quantities.
Outlier detection
The two-sided Grubbs test and robust z-score were applied to both the annual RCI series and the observed CFR series. The Grubbs’ Test statistic is given by
$ G=\frac{|{x}_i-\overline{x}|}{s} $
 ,
where
 ,
$ \overline{x} $
 , and
$ s $
 are the suspected outliers, the sample mean, and the sample standard deviation, respectively. The significance was assessed using a two-tailed test at
$ \alpha =0.05. $
 The z-score is given by
$ {z}_i=0.6745\frac{x_{i- median(x)}}{MAD} $
 , where MAD = median
$ \left(|{x}_i- median(x)|\right) $
 . Values satisfying
$ \mid {z}_i\mid <3.5 $
 were considered potential outliers. An observation was classified as anomalous if flagged by either method; flagged years are retained in descriptive tables but excluded from trend estimation.
State-level consistency analysis
Annual confirmed-case totals for Edo and Ondo States were computed from the weekly state series. State-level RCI was calculated where deaths data were available (2018–2022); 2023–2025 state death data were not available at the time of analysis. The combined share of Edo and Ondo case counts in the national annual total was computed for 2020–2025 to contextualize the representativeness of these states for the national signal.
Random Forest modelling of weekly case counts
The transition from traditional statistical adjustments to integrated machine learning (ML) frameworks represents the current standard for addressing inherent under-ascertainment in tropical infectious disease surveillance [Reference Wang20]. Consequently, an ensemble Random Forest model was built to characterize predictors of weekly confirmed case counts (target: confirmed cases per week). This ML approach was selected for its ability to manage the multidimensionality and complex spatiotemporal interactions characteristic of the national Lassa fever surveillance dataset [Reference Junaid21].
Features included epidemiological week, year, a lag-1 autoregressive term, a lag-2 autoregressive term, a 4-week lagged rolling mean, suspected cases, lagged suspected cases, probable cases, lagged deaths, a 4-week rolling CFR, test positivity rate (confirmed/suspected), and weekly Ondo and Edo State case counts as external caseload indicators (p = 13 features; n = 308 complete-case weekly observations after lag construction). Hyperparameters (500 trees, maximum depth 10, minimum 4 observations per leaf,
$ \sqrt{p} $
 features per split) were fixed prior to fitting; no data-adaptive tuning was performed. Full rationale is given in (Supplementary Methods S3).
Cross-validation
Because the weekly observations exhibit strong temporal autocorrelation (lag-1,
$ r=0.90 $
 ), an expanding-window TimeSeries Split (sklearn v1.8, five folds) was used as the primary cross-validation scheme. Each fold’s test set was chronologically after its training set, preventing future-data leakage. A shuffled five-fold K-fold CV was also computed and reported as an optimistic upper bound for direct comparison with prior literature; the gap between the two schemes quantifies the effect of temporal leakage. Permutation importance (20 repeats) was used for feature attribution in preference to mean decrease in impurity, which can be inflated for high-cardinality features. The Random Forest analysis is exploratory and hypothesis-generating rather than a validated predictive or causal model. Hyperparameters were fixed a priori without tuning, and the model was used to characterize correlates of weekly case volume, not to generate out-of-sample forecasts or to establish causal drivers of surveillance completeness. The RCI trend analysis (Sections ‘Monte Carlo uncertainty propagation’–‘Trend analysis and change-point detection’) remains the primary analytical basis for this study’s conclusions.
Statistical software
All analyses were conducted in Python 3.9 (numpy 2.4, pandas 3.0, scipy 1.17, scikit-learn 1.8, matplotlib 3.10). Random seed 42 was used throughout. The fully reproducible code is deposited at GitHub repository (https://github.com/tadema00/lassa-rci-nigeria). All input data files are included in the repository.
Results
Descriptive summary (2012–2025)
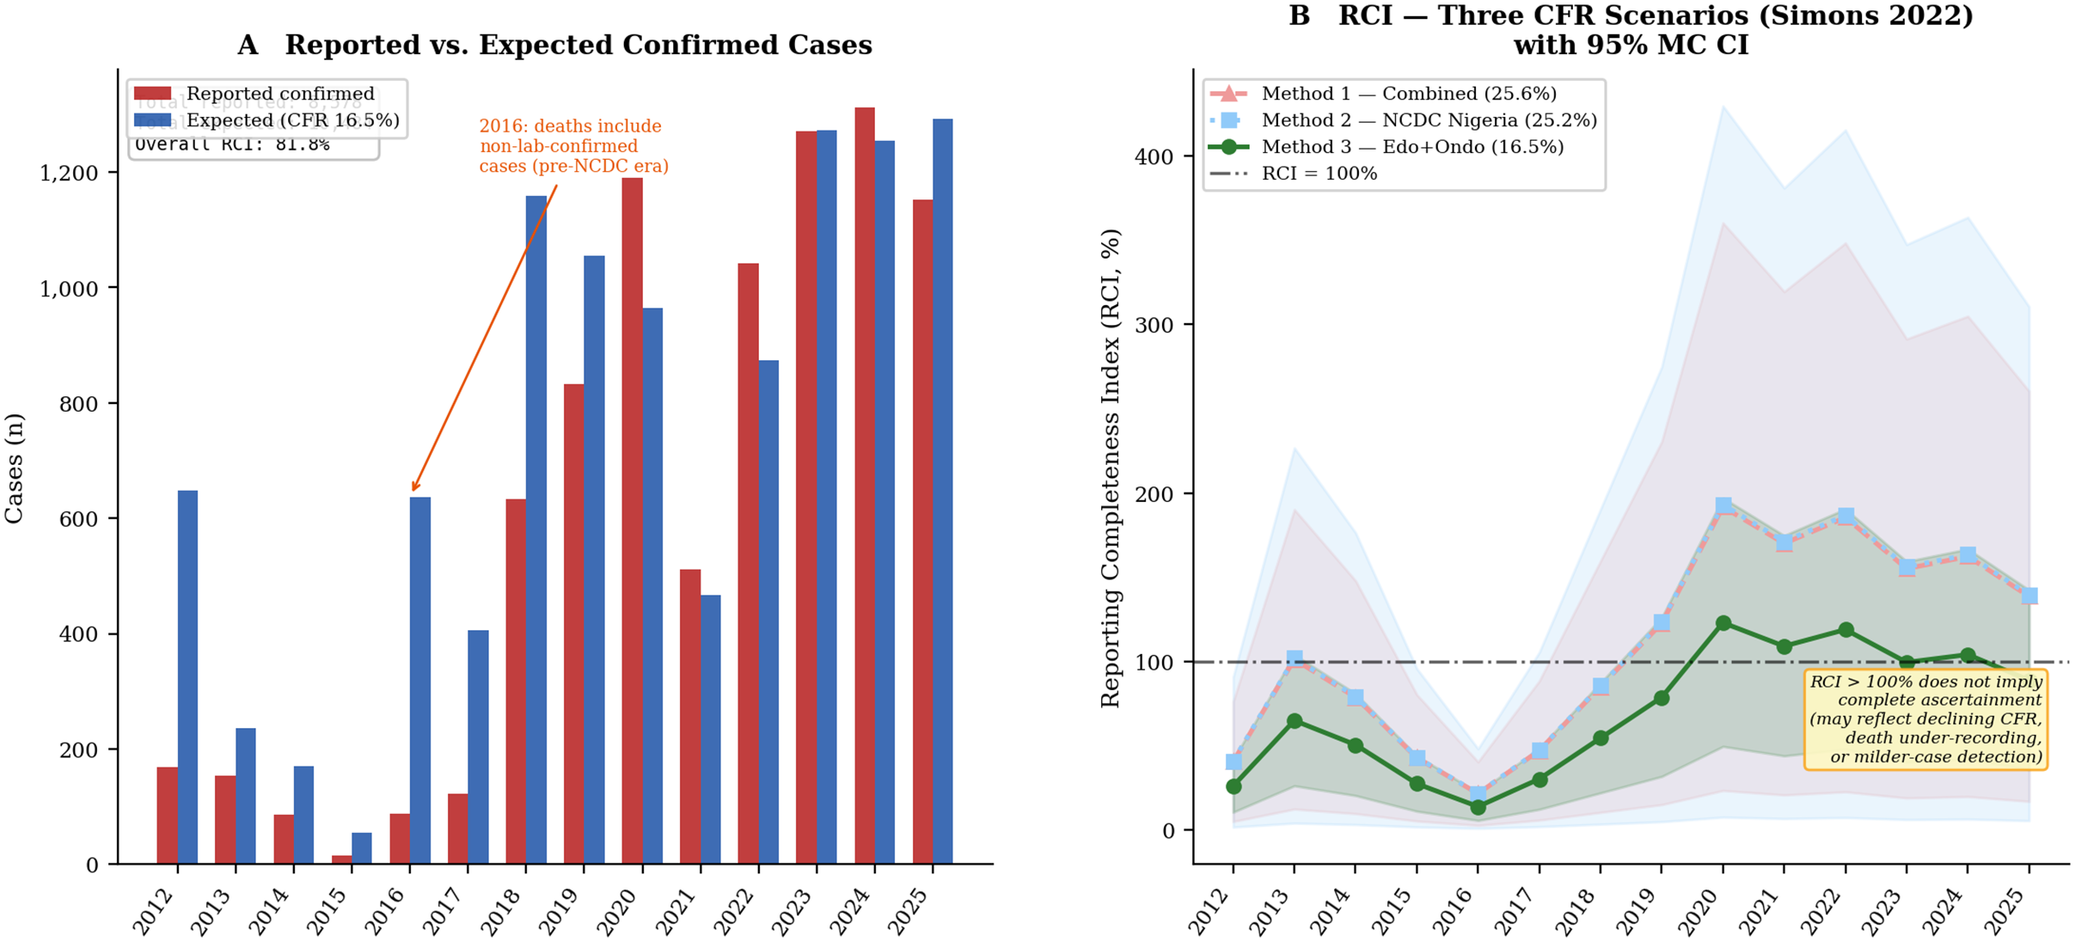
Across the 14 year study period, 8578 confirmed Lassa fever cases and 1730 deaths were reported nationally, out of 60792 suspected cases, representing an overall test positivity of 14.1% (Figure 2a, Supplementary Table S1). Table 2 presents the full annual surveillance series, including the most contemporary figures extracted from recent NCDC epidemiological updates [22].
Reported versus expected confirmed Lassa fever cases (Panel A) and Reporting Completeness Index under three CFR scenarios (Panel B), Nigeria 2012–2025. Panel A: bars show annual reported confirmed cases and expected cases computed as deaths / 0.165 (CFR 16.5%, reference scenario). Panel B: RCI trajectories under Simons (2022) Methods 1–3 with 95% Monte Carlo credible intervals (N = 10,000). The annotation on Panel B notes that RCI > 100% does not imply complete ascertainment (see Section ‘Interpretation of RCI values above 100%’). Year 2016 is annotated to indicate that deaths exceeded confirmed cases under the pre-NCDC reporting convention.

Figure 2. Long description
Figure 2 shows Lassa fever surveillance trends in Nigeria (2012–2025). Panel A (Reported vs. Expected Cases): Grouped bar chart comparing annual reported cases (red) and expected cases at 16.5% CFR (blue). Overall RCI is 81.8%. Prior to 2018, expected cases exceeded reported cases; 2016 deaths included non-lab confirmed cases (pre-NCDC). From 2018 to 2025, cases surged above 800 annually. Panel B (RCI Three CFR Scenarios with 95% MC CI): Line chart showing RCI trajectories. Method 1 (25.6%) and Method 2 (25.2%) exceed 100% after 2018, peaking near 200%. Method 3 (16.5%) ranges from ~15% to ~120%. Annotation highlights that RCI > 100% does not imply complete ascertainment.
Annual Lassa fever surveillance data, Nigeria 2012–2025. RCI computed under reference CFR of 16.5%; 95% CI from Monte Carlo simulation (N = 10000). Expected cases = deaths / 0.165

Table 2. Long description
Table 2 shows annual Lassa fever surveillance in Nigeria (2012–2025) at reference CFR 16.5% (Suspected/Confirmed/Expected/Deaths/RCI%/Obs.CFR%): 2012 (1357/169/648/107/26.1/63.3), 2013 (1195/154/236/39/65.2/25.3), 2014 (820/86/170/28/50.7/32.6), 2015 (272/15/55/9/27.5/60.0), 2016 (864/88/636/105/13.8/119.3, outlier), 2017 (602/123/406/67/30.3/54.5), 2018 (3498/633/1158/191/54.7/30.2), 2019 (5057/833/1055/174/79.0/20.9), 2020 (6834/1190/964/159/123.5/13.4), 2021 (4637/511/467/77/109.5/15.1), 2022 (7984/1042/873/144/119.4/13.8), 2023 (9124/1271/1273/210/99.9/16.5), 2024 (10087/1311/1255/207/104.5/15.8), 2025 (8461/1152/1091/213/89.2/18.5). Note: 2016 was a Grubbs outlier due to pre-NCDC non-lab confirmed deaths.
a 2016: Grubbs outlier (G = 2.81, critical 2.51; robust z = 7.49); excluded from trend analyses.
b 2016: deaths included probable/suspected cases not restricted to lab-confirmed infections (pre-NCDC reporting convention).
A pronounced step change in surveillance volume is visible from 2018 onward (between 2012 and 2017); a median of 105 confirmed cases per year were reported (range 15–169). From 2018 to 2025, the median rose to 1116 (range 511–1311), reflecting a significant expansion in national surveillance capacity (Figure 4a).
The observed CFR varied widely over time (Table 2, Supplementary Table S1), ranging from 13.4% in 2020 to 119.3% in 2016 (Figure 3b). The 2016 anomaly, in which reported deaths (n = 105) substantially exceeded confirmed cases (n = 88), is attributable to the pre-NCDC reporting convention under which Lassa-attributable deaths were recorded among probable and clinically suspected cases without requiring laboratory confirmation. This is not a data error but a definitional shift in the denominator population [Reference McCormick11, Reference Umeozuru15].
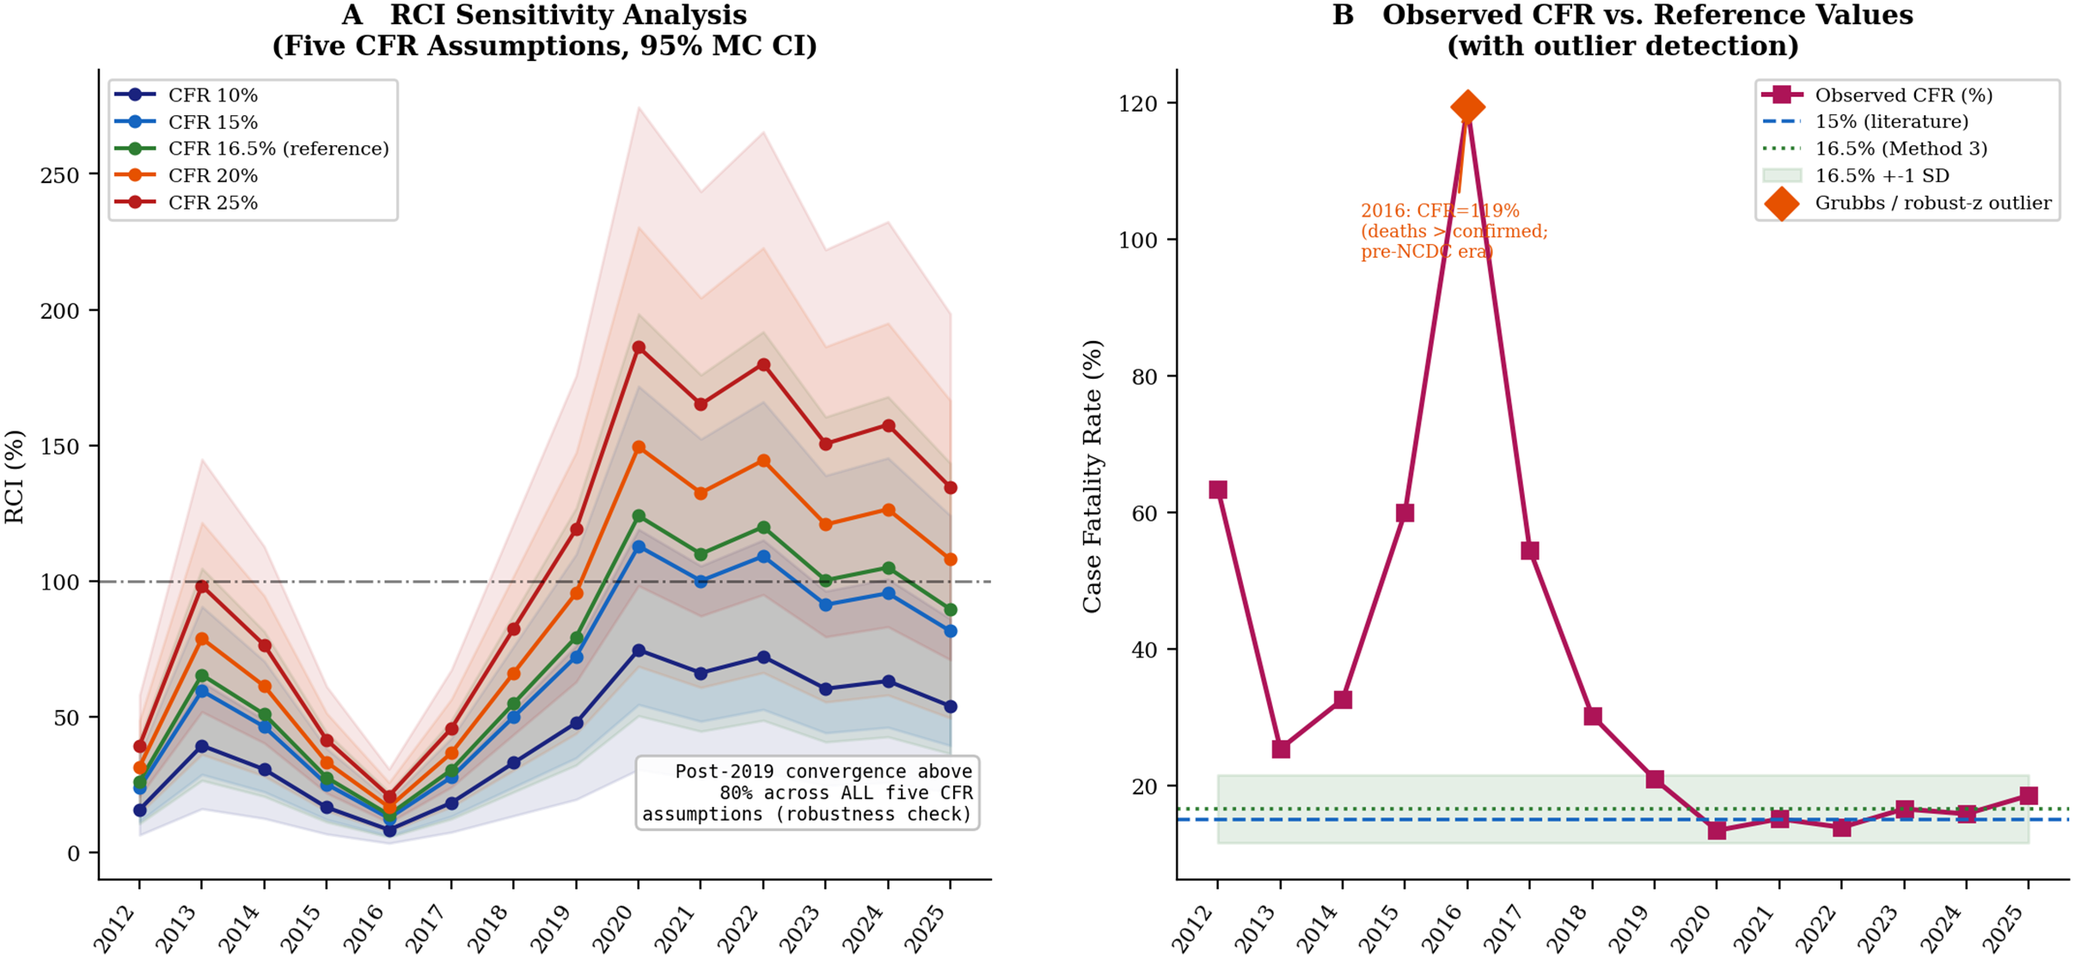
CFR sensitivity analysis (Panel A) and observed CFR trends (Panel B), Nigeria 2012–2025. Panel A: RCI trajectories under five CFR assumptions (10–25%) with 95% Monte Carlo CI; vertical shading indicates the post-2019 period. Panel B: observed CFR by year (deaths/confirmed × 100) with reference lines at 15% (WHO literature estimate) and 16.5% (Simons Method 3 reference) and Grubbs/robust z-score outlier marker for 2016.

Figure 3. Long description
Figure 3 illustrates CFR sensitivity analysis and observed CFR trends in Nigeria (2012–2025). Panel A (RCI Sensitivity Analysis): Shows RCI trajectories across five CFR assumptions (10%, 15%, 16.5% reference, 20%, 25%) with 95% Monte Carlo credible intervals. Lower assumed CFR yields lower RCI curves, while higher assumed CFR yields higher RCI curves. An annotation highlights post-2019 convergence above 80% across all five CFR assumptions as a robustness check. A horizontal reference line marks RCI = 100%. Panel B (Observed CFR vs. Reference Values): A line graph of annual observed CFR (purple line with square markers). Reference lines are shown at 15% (WHO literature) and 16.5% (Method 3 reference) with a ± 1 SD shaded band. An orange diamond highlights 2016 as a Grubbs/robust z-score outlier where observed CFR reached 119% due to deaths exceeding confirmed cases in the pre-NCDC era. From 2020 to 2025, observed CFR stabilized around 13%–18%, aligning closely with reference values.
The year 2016 was identified as an outlier by both the Grubbs test (G = 2.81, critical value 2.51 at α = 0.05) and the robust z score (z = 7.49 for the CFR series, threshold 3.5). It was therefore excluded from all trend analyses, while being retained in descriptive tables and appropriately annotated in the time series plots (Figures 2b, 3b).
Observed CFR trend: Confound assessment
The observed CFR declined significantly over the study period (Mann–Kendall τ = −0.50, p = 0.014), falling from a median of 49.9% in 2012–2018 (excluding 2016) to a median of 15.3% in 2020–2024 (Figure 3b). This recent median of 15.3% is consistent with clinical findings from prospective cohort studies in Nigeria, which estimated institutional CFRs among hospitalized patients between 14% and 19% [Reference Duvignaud4]. This alignment suggests that our reference CFR of 16.5% provides a realistic, evidence-based parameter for back-calculation (Figures 1, 3b).
The observed decline predates the introduction of ribavirin as standard of care and is consistent with surveillance improvements: as case detection improves, the proportion of mild-to-moderate cases in the confirmed pool increases, mathematically reducing the observed CFR [Reference Simons9]. Consequently, part of the upward RCI trend necessarily reflects a declining institutional CFR rather than solely surveillance expansion. This confounding is addressed by the CFR sensitivity analysis (Figure 3a) and discussed further in Section ‘Interpretation of RCI values above 100%’.
National RCI trajectory
Figure 2a shows reported versus expected confirmed cases and the RCI trajectory under three Simon’s (2023) CFR methods with 95% Monte Carlo credible intervals (Figure 2b, Supplementary Table S1). Table 2 reports annual point estimates and 95% CIs under the reference CFR (16.5%). RCI rose from 26.1% in 2012 (95% CI: 10.6–41.9%) to 104.5% in 2024 (95% CI: 42.6–167.9%), following a significant upward trend (Figure 4a). The pre-2019 mean RCI (2012–2018, excluding 2016) was 42.4%, compared with a post-2019 mean (2019–2025) of 103.6%, representing a mean shift of 61.2 percentage points (Figure 4a). (Note that RCI values above 100% do not indicate more than complete case ascertainment; see the interpretation caveat in Section ‘Reporting completeness index (RCI)’ and the fuller discussion in Section ‘Interpretation of RCI values’.)
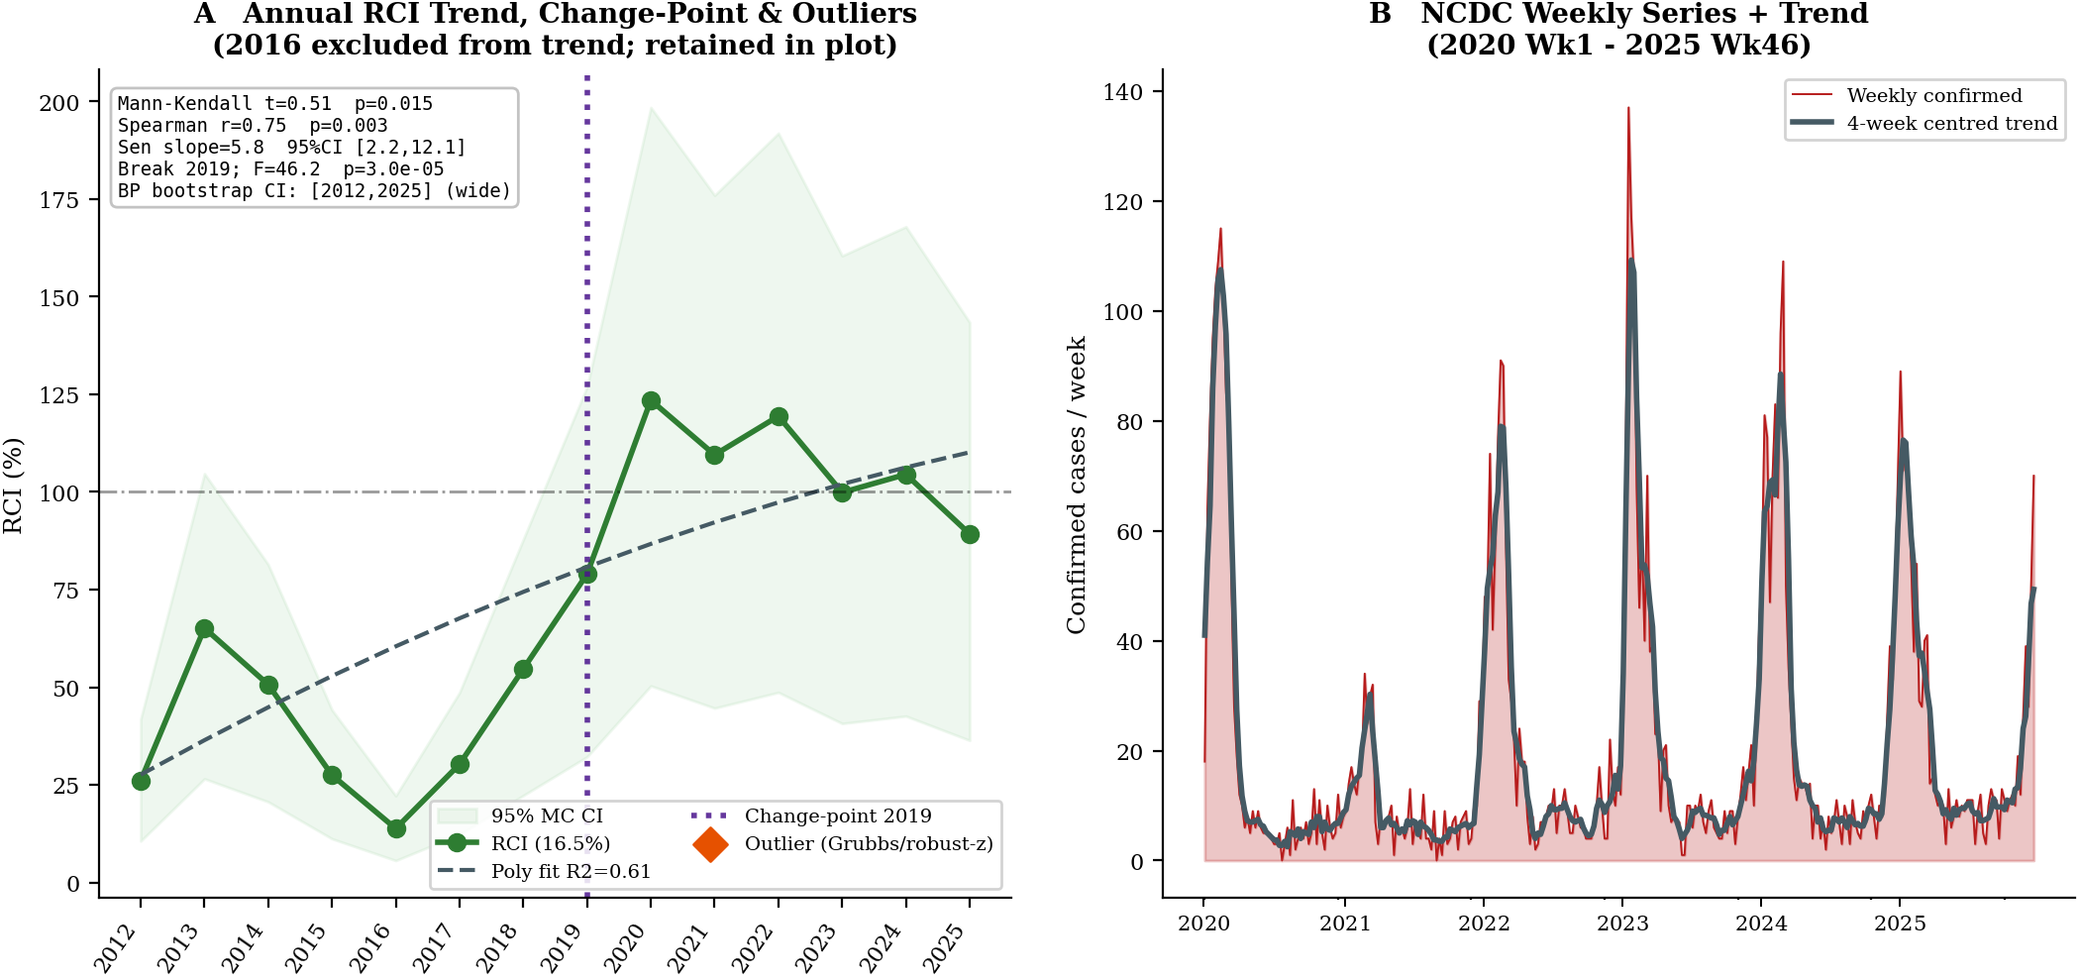
Annual RCI trend with change-point and national weekly surveillance series. Panel A: annual RCI (reference CFR 16.5%) with 95% Monte Carlo CI (shaded), polynomial trend fit (dashed), change-point at 2019 (dotted vertical line), and outlier markers. Statistical summary inset reports Mann–Kendall τ, Spearman ρ, Sen’s slope [95% CI], and F-test result with bootstrap CI note. Panel B: national weekly confirmed cases (2020 Week 1–2025 Week 52, complete) with 4-week centred moving-average trend.

Figure 4. Long description
Figure 4 details annual RCI trend dynamics and weekly Lassa fever surveillance in Nigeria. Panel A (Annual RCI Trend, Change-Point & Outliers): Shows annual RCI from 2012 to 2025 (green line with points) with 95% Monte Carlo CI shading. A dashed trend line shows linear/polynomial progression (R2 = 0.61). A vertical dotted line marks a significant structural change-point in 2019 (F = 46.2, p = 3.0e-05). Inset statistics report positive trend metrics: Mann–Kendall τ = 0.51 (p = 0.015), Spearman r = 0.75 (p = 0.003), and Sen slope = 5.8 (95% CI [2.2, 12.1]). RCI increased from ~25% in 2012 to over 100% post-2019. Panel B (NCDC Weekly Series + Trend): Shows weekly confirmed cases (red line) and 4-week centred moving average (dark gray line) from 2020 Week 1 to 2025. Displays strong annual seasonality with sharp recurring epidemic peaks between 80 and 140 cases per week in early months, returning to low baseline levels (~5–15 cases/week) mid-year.
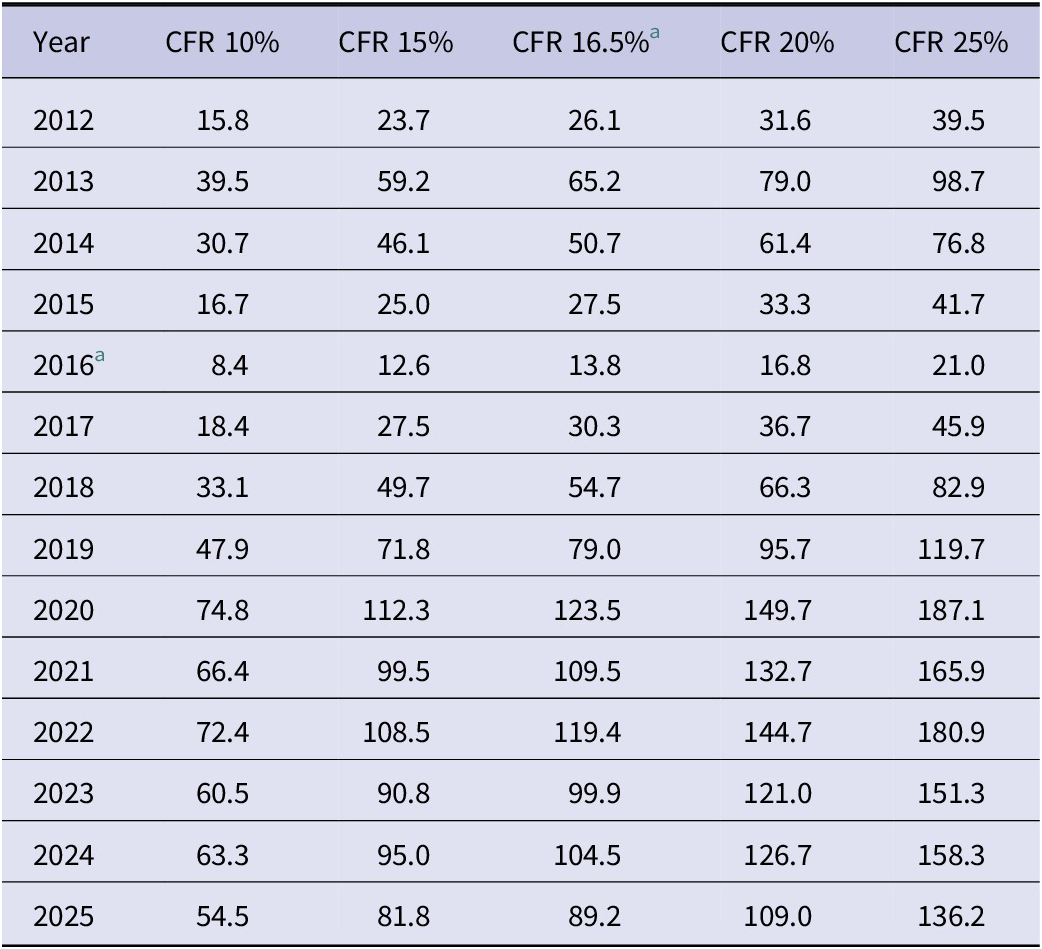
Uncertainty intervals are wide, particularly for years with low absolute death counts (2015: 9 deaths; 2012: 107 deaths), as shown by the Monte Carlo credible interval shading (Figures 2b, 4a). The sensitivity analysis (Table 3) confirms that the post-2019 improvement is robust across all five CFR assumptions (Figure 3a): under CFR = 10%, post-2019 RCI values range from 47.9% to 74.8%; under CFR = 25%, they range from 119.7% to 187.1%.
RCI sensitivity analysis across five CFR assumptions. Values in percent. Reference scenario (16.5%) in bold column

Table 3. Long description
Table 3 presents annual RCI (%) sensitivity across 5 CFR assumptions (10%/15%/16.5% ref./20%/25%) from 2012 to 2025: 2012 (15.8/23.7/26.1/31.6/39.5), 2013 (39.5/59.2/65.2/79.0/98.7), 2014 (30.7/46.1/50.7/61.4/76.8), 2015 (16.7/25.0/27.5/33.3/41.7), 2016 (8.4/12.6/13.8/16.8/21.0), 2017 (18.4/27.5/30.3/36.7/45.9), 2018 (33.1/49.7/54.7/66.3/82.9), 2019 (47.9/71.8/79.0/95.7/119.7), 2020 (74.8/112.3/123.5/149.7/187.1), 2021 (66.4/99.5/109.5/132.7/165.9), 2022 (72.4/108.5/119.4/144.7/180.9), 2023 (60.5/90.8/99.9/121.0/151.3), 2024 (63.3/95.0/104.5/126.7/158.3), 2025 (54.5/81.8/89.2/109.0/136.2). Note: 16.5% CFR is the reference scenario.
a Reference scenario used in primary analysis.
Trend tests and Sen’s slope
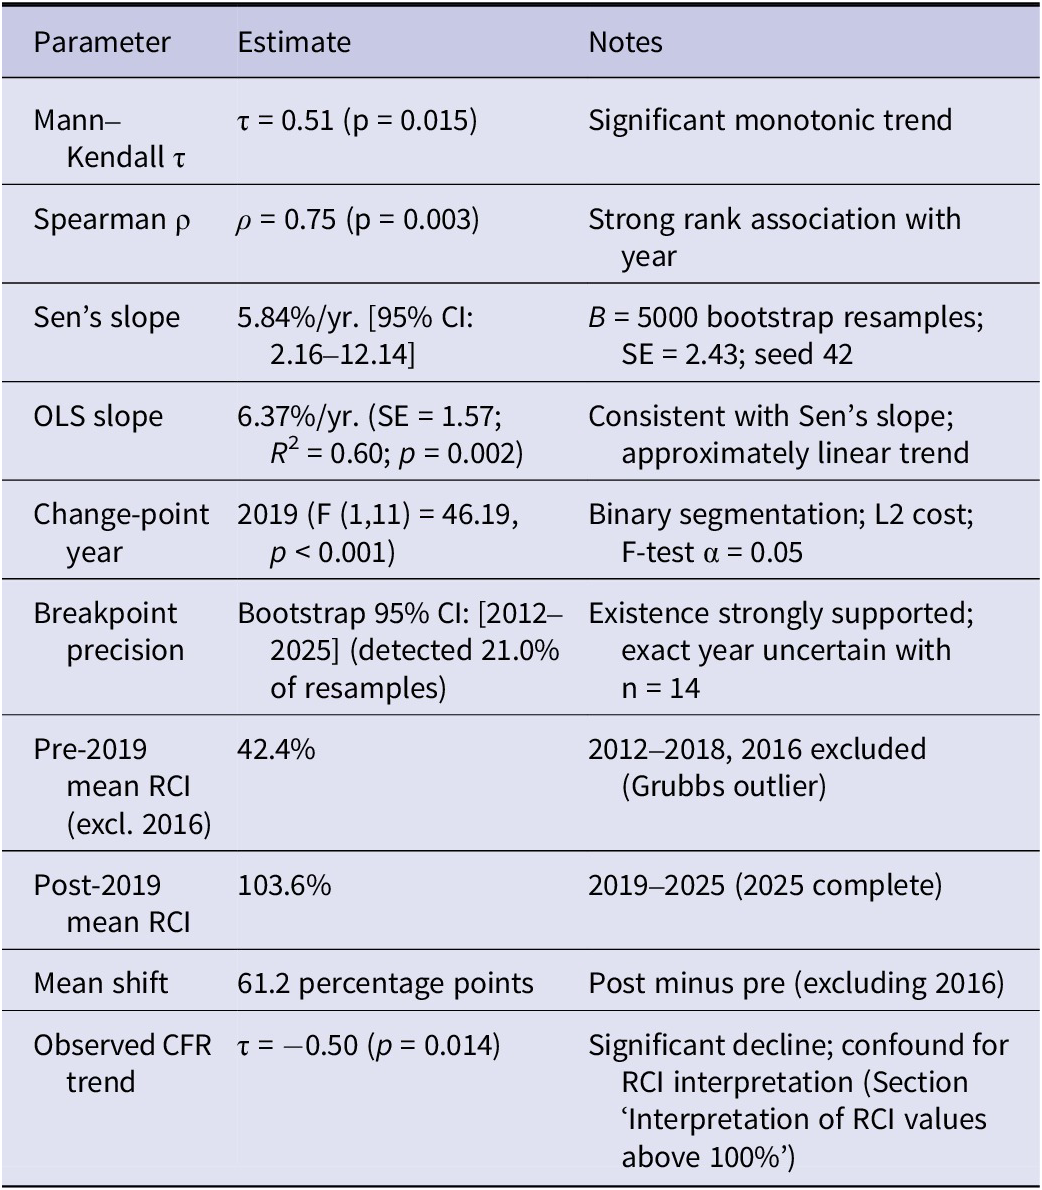
Table 4 presents the full trend analysis results, which are summarized visually alongside the RCI trajectory (Figure 4a). All three estimators converged on a significant positive trend. The Mann–Kendall test produced τ = 0.51 (p = 0.015), indicating a significant monotonic increase over the trend-analysis sample (n = 13, 2016 excluded). Spearman’s ρ = 0.75 (p = 0.003) confirms a strong rank association between calendar year and RCI. Sen’s slope was 5.84%/year (95% bootstrap CI: 2.16–12.14%/year; SE = 2.43; B = 5000 resamples), a result explicitly highlighted in the statistical inset (Figure 4a). The bootstrap CI excludes zero, providing statistical support for a genuine upward trend. The OLS slope estimate (6.37% year, SE = 1.57,
$ {R}^2 $
 $ =0.60 $
 , p = 0.002) agrees closely with Sen’s slope, suggesting the trend is approximately linear (Figure 4a, dashed line). The bootstrap distribution was right-skewed, supporting the use of percentile rather than normal-approximation CIs.
Summary of trend analysis and change-point detection results. All analyses exclude 2016 (n = 13 observations, 2012–2025)

Table 4. Long description
Table 4 summarizes trend analysis and change-point detection results (n=13, 2012–2025 excluding 2016): 1. Mann–Kendall τ = 0.51 (p=0.015, significant monotonic trend). 2. Spearman ρ = 0.75 (p=0.003, strong rank association with year). 3. Sen’s slope = 5.84%/yr [95% CI: 2.16–12.14] (B=5,000 bootstrap resamples; SE=2.43). 4. OLS slope = 6.37%/yr (SE=1.57; R2=0.60; p=0.002; consistent with Sen’s slope). 5. Change-point year = 2019 (F(1,11)=46.19, p<0.001; binary segmentation, L2 cost, α=0.05). 6. Breakpoint precision = Bootstrap 95% CI: [2012–2025] (detected in 21.0% of resamples; existence strongly supported). 7. Pre-2019 mean RCI (2012–2018 excl. 2016) = 42.4%. 8. Post-2019 mean RCI (2019–2025) = 103.6%. 9. Mean shift = 61.2 percentage points (post minus pre). 10. Observed CFR trend: τ = ‒0.50 (p=0.014, significant decline, confound for RCI interpretation).
Change-point detection
Binary segmentation identified a single statistically significant change-point, with the optimal split at 2019 (
$ F\;\left(1,11\right)=46.19,\;p<0.001 $
 ), indicated by the vertical dotted line on the RCI series (Figure 4a). Segment means were 42.4% (2012–2018, excluding 2016) and 103.6% (2019–2025). No secondary split within either segment reached the F-test significance threshold (α = 0.05), indicating that a single structural break is sufficient to characterize the trajectory.
The bootstrap CI on the breakpoint year was wide [2012, 2025], with a breakpoint detected in only 21.0% of 1000 resamples but this does not contradict the F-test result above (Figure 4a). The two tests ask different questions: the F-test asks whether a structural break exists anywhere in the series, and the evidence there is strong (p < 0.001); the bootstrap CI asks where the break occurred, and with only 14 annual observations, that question cannot be answered precisely. Accordingly, 2019 should be treated as an approximate estimate, with the structural transition most consistent with a broader 2018–2020 window.
Seasonal epidemiology (weekly data, 2020–2025)
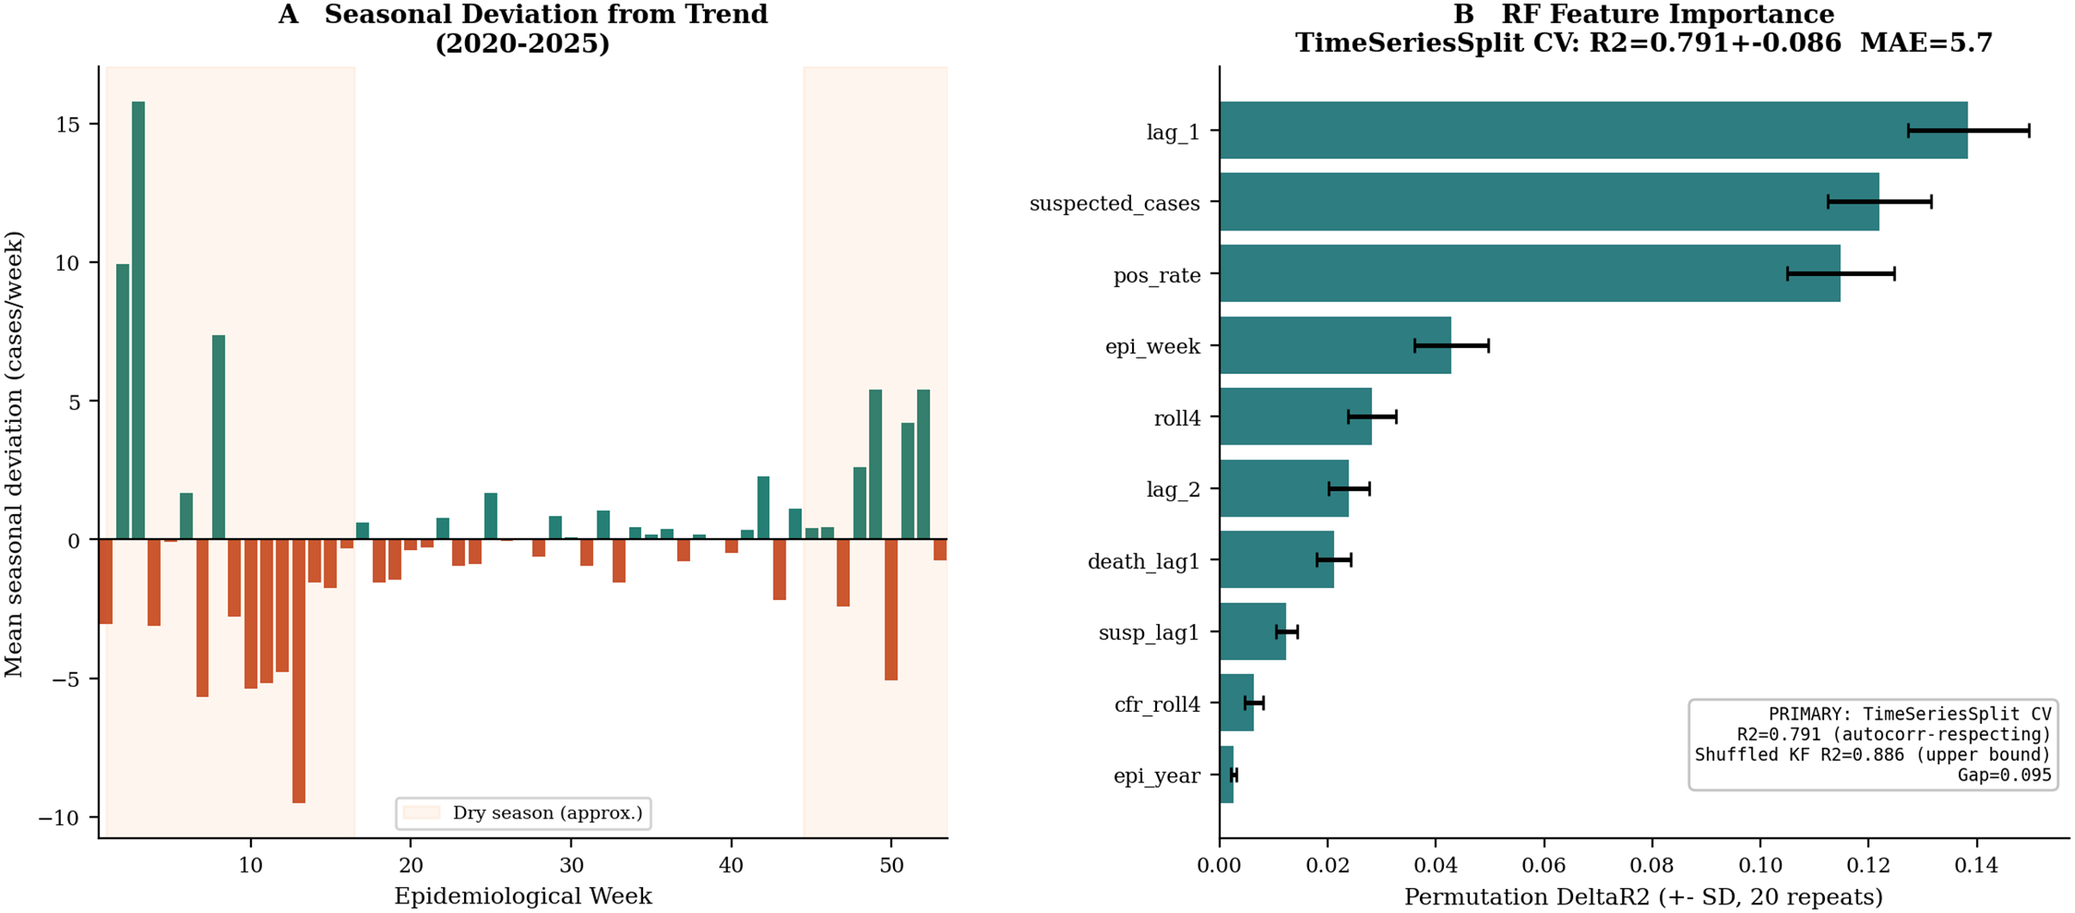
Figure 4b shows the national weekly confirmed-case series and Figure 5a shows the mean seasonal deviation from the 4-week centred trend. The seasonal profile confirms a pronounced dry-season peak: peak epi-weeks occurred in Weeks 2–9 across all 6 years (Figure 5a). The early-year surge (January–March) accounts for the large positive seasonal deviations in Weeks 1–12, consistent with the known association between dry-season rodent–human contact patterns and increased Lassa transmission [Reference Redding23, Reference Olayemi24].
Seasonal profile of weekly confirmed cases (Panel A) and Random Forest permutation feature importance (Panel B). Panel A: mean deviation of weekly confirmed cases from the 4-week centred trend by epidemiological week; orange shading indicates approximate dry-season period (Weeks 1–16 and 45 52). Panel B: permutation feature importance (mean ΔR2 over 20 repeats ± SD) for the final Random Forest model; time-series CV performance reported in title (primary result: TimeSeriesSplit R 2 = 0.791 vs. shuffled K-fold R2 = 0.886).

Figure 5. Long description
Figure 5 details seasonality and predictor importance for weekly confirmed Lassa fever cases (2020–2025). Panel A (Seasonal Deviation from Trend): A bar chart showing mean weekly case deviation from a 4-week centred trend across epidemiological weeks (1–52). Orange shaded regions mark the dry season (Weeks 1–16 and 45–52). Positive deviations peak strongly during dry-season weeks (reaching +16 cases/week in Week 2), whereas wet-season weeks (17–44) maintain low or negative deviations. Panel B (RF Feature Importance): A horizontal bar chart displaying permutation ΔR2 ( ±SD, 20 repeats) for Random Forest predictors. Key features ranked by importance are lag_1 (~0.138), suspected_cases (~0.122), and pos_rate (~0.115), followed by epi_week (~0.043), roll4 (~0.028), lag_2 (~0.024), and death_lag1 (~0.021). An inset box notes TimeSeriesSplit CV R2 = 0.791 ± 0.086 (MAE = 5.7) versus shuffled KF R2 = 0.886.
State-level consistency analysis
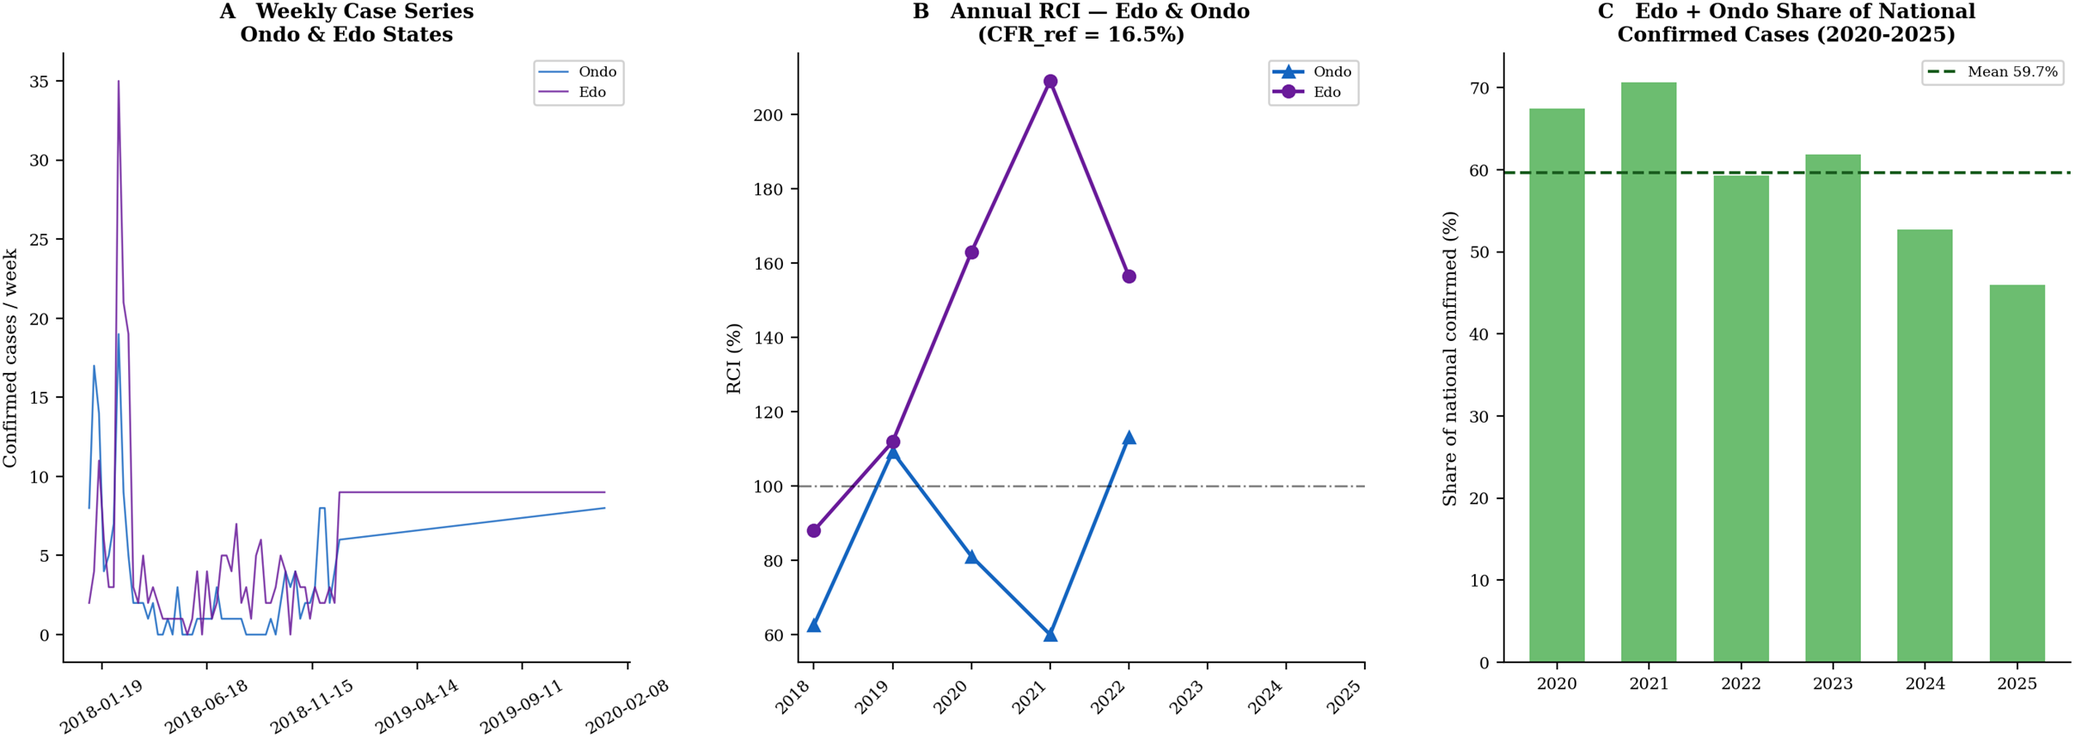
Edo and Ondo States together contributed a mean of 61.0% of national confirmed cases per year during 2020–2025 (range 52.7–70.6%; Figure 6c). State-level RCI trajectories support the national finding (Table 3; Figure 6b). Edo State RCI rose from 88.0% in 2018 to 162.9% in 2020 and 209.0% in 2021 before declining to 156.5% in 2022 (Figure 6b, Supplementary Table S2). Ondo State RCI rose from 62.5% in 2018 to 109.2% in 2019 and 113.2% in 2022 (Supplementary Table S2). The convergence of high post-2018 RCI values in both states, independently of the national series, provides corroborating evidence that the improvement is real and not an artefact of changes in the national reporting protocol.
State-level consistency analysis using Edo and Ondo State case series. Panel A: weekly confirmed-case series for Edo (purple) and Ondo (blue) States, 2018–2025. Panel B: annual RCI for each state under the 16.5% reference CFR (data available 2018–2022; deaths unavailable 2023–2025). Panel C: combined Edo and Ondo share of national confirmed cases by year (2020–2025), with mean share (59.7%) indicated.

Figure 6. Long description
Figure 6 analyses state-level surveillance consistency in Edo and Ondo States. Panel A (Weekly Case Series, Ondo & Edo): Line plot of weekly confirmed cases (2018–2020). Edo (purple line) peaked at 35 cases/week in early 2018, while Ondo (blue line) peaked near 19 cases/week before both stabilized to lower weekly counts. Panel B (Annual RCI – Edo & Ondo, CFR_ref = 16.5%): Line chart comparing annual RCI from 2018 to 2022. Edo (purple line with circles) rose from 88% in 2018 to a peak of 209% in 2021 before dropping to 156% in 2022. Ondo (blue line with triangles) fluctuated between 60% (2021) and 113% (2022). A horizontal dash-dotted line marks RCI = 100%. Panel C (Edo + Ondo Share of National Confirmed Cases, 2020–2025): Green bar chart showing combined state contribution to national confirmed cases (67.5% in 2020, 70.5% in 2021, 59.5% in 2022, 62% in 2023, 52.8% in 2024, and 46% in 2025). A dashed green line indicates the 6-year mean share of 59.7%.
The Edo State trajectory warrants note: RCI values of 163–209% in 2020–2021 are implausibly high for simple surveillance completeness. As discussed in Section ‘Interpretation of RCI values above 100%’, these values likely reflect a combination of genuinely improved case ascertainment and a sharp post-2019 decline in state-level CFR (Edo CFR fell from 18.8% in 2018 to 7.9% in 2021), consistent with earlier detection of milder cases (Figure 6b).
Random forest model
The Random Forest model (n = 308, p = 13) achieved a time-series CV
$ {R}^2=0.791\pm 0.086. $

(MAE = 5.74 cases/week; primary result, TimeSeriesSplit). The shuffled K-fold CV produced
$ {R}^2=0.886\pm 0.033 $
 (MAE = 4.70), representing an optimistic upper bound due to temporal autocorrelation leakage (Figure 5b). Train
$ {R}^2 $
 was 0.951, indicating an overfit gap of 0.160 relative to time-series CV.
Permutation feature importances (Figure 5b) identified lag-1 case count (
$ \Delta {R}^2 $
 = 0.142), suspected cases (
$ \Delta {R}^2 $
 = 0.117), and test positivity rate (
$ \Delta {R}^2 $
 = 0.108) as the dominant predictors. Epidemiological week ranked fourth (
$ \Delta {R}^2 $
 = 0.053), confirming the seasonal signal (Supplementary Table S3). The Ondo and Edo State case counts contributed negligible permutation importance (
$ \Delta {R}^2 $
 $ \approx 0 $
 ), indicating that national weekly dynamics are largely captured by contemporaneous testing volume and short-term autocorrelation rather than state-level leading indicators. This finding has implications for early-warning system design: national testing throughput (approximated by suspected cases and positivity rate) is a more informative real-time signal than inter-state case flow.
Discussion
Principal finding
This study provides the first longitudinal quantification of Lassa fever reporting completeness in Nigeria over a 14-year period. The principal finding is that national surveillance completeness, as measured by the RCI, increased approximately four-fold between 2012 and 2025, characterized by a statistically significant upward trend and a structural break around 2019. This improvement is consistent across four independent analytical approaches: RCI point estimates, Mann–Kendall/Spearman trend tests, Sen’s slope bootstrap, and binary segmentation change-point detection. Notably, the observed gains align with the 90% accuracy benchmarks documented in other AI-integrated digital health surveillance systems globally [Reference Adirika25].
The structural break approximately in 2019 coincides with a period of substantial NCDC investment. Certified Lassa fever diagnostic laboratories increased from four to over 20, the SORMAS platform was deployed nationally, and Lassa fever was integrated into the standing Incident Management System [13]. While this analysis establishes temporal coincidence rather than definitive causality, the correlation is consistent with a causal pathway where infrastructure development facilitates enhanced case capture. However, these results must be interpreted alongside population-level changes in health-seeking behaviour or clinical improvements that may have reduced case severity independently of surveillance expansion.
Interpretation of RCI values
Post-2019 RCI values at the national level (123.5% in 2020) and state level (Edo: 162.9–209.0%) exceed 100%, necessitating careful interpretation. By construction, an RCI >100% indicates that reported cases exceed expectations given the observed mortality and reference CFR. Three plausible mechanisms likely operate simultaneously. First, a declining institutional CFR: as improved surveillance detects earlier-stage, milder cases, the proportion of deaths in the confirmed pool decreases, mathematically inflating the RCI [Reference Simons9]. This is supported by the steep decline in state-level CFR observed in Edo (18.8% to 7.9%). Second, reference parameter bias: if the true CFR has fallen below the 16.5% reference (Simons Method 3), the index will generate expected case counts that are too low. Third, death under-ascertainment: if Lassa-attributable deaths are not fully captured by the system, the denominator is artificially reduced. We therefore advise against interpreting RCI >100% as evidence of absolute completeness; rather, it reflects a combination of successful case ascertainment and declining institutional fatality risk.
Overdispersion and implications for weekly modelling
The Poisson GLM fit to weekly confirmed cases revealed severe overdispersion (
$ \phi =9.09 $
 ). Under a negative-binomial model, the dispersion parameter (
$ \hat{\alpha} $
 = 0.394) implies that variance increases quadratically with the mean (
$ V=\mu +0.394{\mu}^2\Big). $
 Consequently, previous Poisson-based analyses that failed to account for this overdispersion likely underestimated standard errors by a factor of approximately 3.0. We recommend negative-binomial regression as the default framework for future weekly Lassa fever count outcomes to ensure statistical validity in transmission rate estimation.
Random forest and surveillance driver analysis
The Random Forest model identified testing volume (suspected cases, positivity rate) and short-term autocorrelation (lag-1 counts) as the dominant predictors of weekly case counts (
$ {R}^2=0.790 $
 ). This suggests that national Lassa dynamics are primarily driven by testing throughput and immediate transmission momentum. While the model highlights real-time signals for early warning, it does not currently account for longer-term environmental covariates. Future iterations of this modelling framework should integrate climate variability and rodent density data, as the spatiotemporal dynamics of Lassa fever are increasingly linked to climate-driven rodent–human contact patterns [Reference Zhao26].
Relationship to Simons (2023) and prior literature
Simons (2023) estimated that Nigeria reported 63% of expected severe Lassa cases over 2012–2022 [Reference Simons9]. Our analysis remains consistent with this pooled estimate but provides essential granularity: the 63% figure masks a significant temporal trajectory, rising from 13.8% in 2016 to over 100% post-2019. This trajectory mirrors surveillance improvements documented for Ebola in the DRC and Dengue in Southeast Asia following targeted laboratory and digital investments [Reference Mbala-Kingebeni27, Reference Brady28]. It suggests that targeted interventions in diagnostic networks can produce measurable improvements in surveillance performance within a relatively short period.
A companion analysis of the same national surveillance stream, using a distinct methodology, reaches a directionally consistent conclusion. Using deterministic back-calculation from the laboratory-confirmation rate (LCR) rather than a mortality-based approach, a companion analysis of 307 weeks of NCDC data (2020–2025) reported 47029 suspected cases, 6288 confirmed cases, and 975 deaths nationally [Reference Tadema, Nwosu and Abimbola29]. LCR declined from 18.4% in 2020 to 9.9% in 2025, yielding an estimated plausible burden of approximately 74117 infections: an approximately seven-fold under-ascertainment relative to confirmed cases. Although derived from a shorter, more recent window and a different analytical framework, this finding is qualitatively consistent with the present study’s central conclusion that reported Lassa fever cases substantially understate true disease burden in Nigeria. This holds even during 2020–2025, the period in which our RCI indicates the greatest improvement in reporting completeness relative to reported deaths.
Confirmed-case and death totals for the overlapping 2020–2025 window differ modestly between the two analyses (6477 confirmed cases and 1010 deaths here, versus 6288 and 975 in the companion analysis [Reference Tadema, Nwosu and Abimbola29]). This most plausibly reflects differences in NCDC data-extraction date and the shorter, November 2025 cutoff used in that analysis.
Limitations and future directions
Several limitations warrant acknowledgement. The annual RCI series is relatively short (n = 14), limiting statistical power for precise breakpoint localization. The methodology assumes that death ascertainment is more complete than case ascertainment. This assumption underlies all death-based back-calculation approaches to burden estimation and is not unique to this study [Reference Kretzschmar18]. It is plausible for Lassa fever specifically because a death, particularly one occurring in or reported to a health facility, is a discrete, unambiguous event that is comparatively difficult to miss or fail to record. A case, by contrast, requires an individual to seek care, undergo laboratory testing, and have that result reported through the surveillance system: a multi-step pathway with several points at which mild or subclinical infections can be lost. Simons similarly treats death reporting as the more complete channel for this reason when deriving reference CFR estimates for Lassa fever [Reference Simons9]. Nonetheless, the assumption is not absolute. Deaths occurring in the community, away from health facilities, may themselves go unrecorded, particularly in rural areas affected by the digital readiness gap discussed. To the extent that death under-ascertainment is non-trivial, RCI values reported here should be regarded as an upper bound on true reporting completeness: an undercounted denominator inflates the index (Section ‘Interpretation of RCI values above 100%’).
A critical external factor is the ‘digital readiness gap’ in Nigeria. Reports indicate that 61% of rural Nigerians remain offline [30]. Infrastructure challenges, such as unreliable electricity, further hinder real-time data entry in remote regions. Systemic funding and infrastructural constraints continue to prevent the full institutional integration required for absolute reporting completeness [Reference Alhusayni31]. Furthermore, digital surveillance success is contingent upon human capacity: future gains will likely require standardized workforce development frameworks to ensure clinicians can utilize the evolving SORMAS architecture effectively [Reference Almalki32].
A further refinement direction is the stratification of reference CFR by Nigeria’s distinct geo-ecological zones, rather than applying a single uniform national value of 16.5%. This would allow state- or zone-level localized RCI estimates that reduce bias arising from geographic heterogeneity in clinical outcomes and care access. This was not feasible in the present study because reliable state-level mortality data beyond Edo and Ondo were not available. It nonetheless represents a valuable direction for future work as more granular data become accessible.
Moving forward, the RCI should be evaluated as a real-time system diagnostic tool. This would facilitate a transition from reactive monitoring towards proactive, AI-driven analytics capable of identifying hotspots before large-scale surges occur [Reference Eze33].
Conclusion
Nigerian Lassa fever surveillance underwent a transformative and quantifiable improvement between 2012 and 2025. National surveillance completeness, as measured by the RCI, increased approximately four-fold, rising from 26.1% in 2012 to values consistently exceeding 100% after 2019. This upward trajectory is statistically robust (Mann–Kendall τ = 0.51, p = 0.015; Sen’s slope 5.84% year) and remains significant across multiple case-fatality rate sensitivity scenarios. The detection of a structural transition around 2019 provides empirical evidence that large-scale investments in the NCDC laboratory network and the national deployment of SORMAS have successfully enhanced the system’s ‘surveillance sensitivity’ [7]. While consistency analyses in Edo and Ondo States corroborate the national trend, the ‘digital readiness gap’ remains a critical frontier for ensuring uniform reporting completeness across Nigeria’s rural and underserved regions [30]. The RCI framework offers a transparent, annually replicable, and open-access approach to monitoring surveillance performance in resource-limited endemic settings. By utilizing routinely collected confirmed-case and death counts, the RCI provides an objective benchmark for evaluating progress towards the goals of the WHO Global Strategy on Digital Health [12]. We recommend the prospective integration of the RCI into routine NCDC epidemiological reporting to serve as a real-time system diagnostic tool. Furthermore, extending this longitudinal analysis to other Lassa-endemic countries, such as Guinea, Liberia, and Sierra Leone, would enable essential multi-country benchmarking and facilitate a coordinated regional response to the persistent burden of Lassa fever in West Africa.
Supplementary material
The supplementary material for this article can be found at http://doi.org/10.1017/S0950268826102222.
Data availability statement
The complete Python analytical pipeline, configuration settings, processed datasets, and sub-national validation data supporting the findings of this study are publicly available in the GitHub repository: https://github.com/tadema00/lassa-rci-nigeria.
The repository contains all scripts required to reproduce the Reporting Completeness Index (RCI) calculations, sensitivity analyses, uncertainty quantification, trend analyses, machine-learning models, figures, and supplementary tables reported in this manuscript.
Acknowledgements
The author acknowledges the Nigeria Centre for Disease Control and Prevention (NCDC) for publicly releasing Lassa fever situation reports and epidemiological updates, which enabled the compilation of the national and sub-national surveillance datasets used in this study. I thank Emmanuel Niyi-Oriolowo [Reference Niyi-Oriolowo34] for curating and making the structured national 2020–2025 Lassa fever time-series dataset openly available through Kaggle. I also acknowledge D. Simons for providing the historical Lassa fever dataset via GitHub [Reference Simons9]. During the preparation of this work, the author used Claude in order to improve language and grammar. After using this tool, the author reviewed and edited the content as needed and takes full responsibility for the content of the publication. The interpretations, analyses, and conclusions presented in this manuscript are those of the author and do not reflect the views of the data providers.
Author contribution
A.J.T.: Conceptualization; Data curation; Formal analysis; Funding acquisition; Investigation; Methodology; Project administration; Resources; Software; Supervision; Validation; Visualization; Writing – original draft; Writing – review and editing.
Funding statement
This study received no funding.
Competing interests
The author declares that there are no financial or personal relationships with other people or organizations that could inappropriately influence or bias the research, analysis, or interpretations presented in this manuscript.
Ethical standards
This study used anonymized aggregate surveillance data; no individual-level data were analysed. Ethical review was not required.


 Open access

