Background
It is becoming increasingly well-evidenced that patients with schizophrenia exhibit impairments in the perception and processing of temporal information (Ciullo, Spalletta, Caltagirone, Jorge, & Piras, Reference Ciullo, Spalletta, Caltagirone, Jorge and Piras2015; Stanghellini et al., Reference Stanghellini, Ballerini, Presenza, Mancini, Raballo, Blasi and Cutting2015; Thoenes & Oberfeld, Reference Thoenes and Oberfeld2017). Consistent with a cognitive dysmetria theory (Andreasen & Pierson, Reference Andreasen and Pierson2008; Andreasen, Paradiso, & O'leary, Reference Andreasen, Paradiso and O'leary1998), these deficits may reflect cerebellar circuit abnormalities. Given the prevalence of research implicating the cerebellum in temporal processes (Breska & Ivry, Reference Breska and Ivry2016; Coull, Cheng, & Meck, Reference Coull, Cheng and Meck2011), as well as evidence demonstrating cerebellar structural and functional connectivity abnormalities across the schizophrenia spectrum (Bernard et al., Reference Bernard, Dean, Kent, Orr, Pelletier-Baldelli, Lunsford-Avery and Mittal2014; Bernard & Mittal, Reference Bernard and Mittal2014; Dean et al., Reference Dean, Bernard, Orr, Pelletier-Baldelli, Gupta, Carol and Mittal2014; Mittal et al., Reference Mittal, Dean, Bernard, Orr, Pelletier-Baldelli, Carol and Robustelli2013; Parker, Narayanan, & Andreasen, Reference Parker, Narayanan and Andreasen2014), it is surprising that there have been relatively few studies examining associations between timing dysfunction and cerebellar networks in schizophrenia spectrum populations, and none in the putative prodromal stage of the illness (i.e. the period immediately preceding the onset of psychosis). As a result, it is currently unknown if impairments in temporal processes are present before illness onset or how they may be associated with the pathophysiology and progression of the disorder. The present study investigates deficits in temporal processing in young adults diagnosed with a prodromal syndrome [i.e. at clinical high-risk (CHR)] and aims to determine if impairments in timing are associated with abnormal cerebellar resting state functional connectivity and worsening of symptoms across 12 months.
Recent research has corroborated early twentieth century phenomenological and autobiographical accounts of disturbances in the perception and experience of time in schizophrenia spectrum populations (Freedman, Reference Freedman1974; Minkowski, Reference Minkowski1927; Stanghellini et al., Reference Stanghellini, Ballerini, Presenza, Mancini, Raballo, Blasi and Cutting2015). For example, compared to controls, schizophrenia patients are less precise when judging the duration of auditory stimuli (Bolbecker et al., Reference Bolbecker, Westfall, Howell, Lackner, Carroll, O'Donnell and Hetrick2014; Carroll, Boggs, O'Donnell, Shekhar, & Hetrick, Reference Carroll, Boggs, O'Donnell, Shekhar and Hetrick2008; Carroll, O'Donnell, Shekhar, & Hetrick, Reference Carroll, O'Donnell, Shekhar and Hetrick2009b) and are less coordinated in the timing of motor behaviors (Carroll, O'donnell, Shekhar, & Hetrick, Reference Carroll, O'donnell, Shekhar and Hetrick2009a). Furthermore, a recent meta-analysis demonstrated that psychosis patients, depending on the task, perceive time as both lengthened and shortened compared to objective time, which was proposed to reflect an abnormal internal time keeper (Thoenes & Oberfeld, Reference Thoenes and Oberfeld2017). Notably, similar findings in individuals with trait-level psychotic-like experiences (e.g. magical thinking, suspiciousness) suggest that deficits in temporal processes may reflect a fundamental vulnerability for the disorder (Lee, Dixon, Spence, & Woodruff, Reference Lee, Dixon, Spence and Woodruff2006; Penney, Meck, Roberts, Gibbon, & Erlenmeyer-Kimling, Reference Penney, Meck, Roberts, Gibbon and Erlenmeyer-Kimling2005; Reed & Randell, Reference Reed and Randell2014).
The cerebellum is considered to be a critical region within the cerebello-thalamo-striato-cortical network that is thought to underlie this poor temporal coordination (Andreasen & Pierson, Reference Andreasen and Pierson2008; Barch, Reference Barch2014; Schmahmann & Pandya, Reference Schmahmann and Pandya2008). To date, the limited neuroimaging work in this area has predominately examined timing processes using temporal durations >1 s (i.e. supra-second) (Ojeda et al., Reference Ojeda, Ortuno, Arbizu, Lopez, Martí-Climent, Penuelas and Cervera-Enguix2002; Ortuño, Guillén-Grima, López-García, Gómez, & Pla, Reference Ortuño, Guillén-Grima, López-García, Gómez and Pla2011; Volz et al., Reference Volz, Nenadic, Gaser, Rammsayer, Häger and Sauer2001). For example, compared to controls, patients with schizophrenia exhibit decreased activity in the prefrontal cortex and caudate nucleus when determining if pairs of supra-second auditory stimuli differ in duration (Volz et al., Reference Volz, Nenadic, Gaser, Rammsayer, Häger and Sauer2001). However, evidence suggests that processing of supra-second temporal stimuli requires less cerebellar involvement (Breska & Ivry, Reference Breska and Ivry2016; Buhusi & Meck, Reference Buhusi and Meck2005; Meck, Reference Meck2005), whereas the cerebellum is critical for temporal processing in the sub-second (i.e. <1 s) stimulus range (Breska & Ivry, Reference Breska and Ivry2016; Casini & Ivry, Reference Casini and Ivry1999; Coull et al., Reference Coull, Cheng and Meck2011; Harrington et al., Reference Harrington, Boyd, Mayer, Sheltraw, Lee, Huang and Rao2004; Ivry & Keele, Reference Ivry and Keele1989; Lewis & Miall, Reference Lewis and Miall2003a; Lewis & Miall, Reference Lewis and Miall2003b). Taken together, given the cerebellum is critically involved in processing temporal information in the sub-second range and is considered a crucial region involved in the posited cognitive dysmetria seen in psychosis, the relative contributions of the cerebellum to deficits in temporal processing remain relatively understudied.
Furthermore, to our knowledge, the only extant sub-second timing neuroimaging work in psychosis focused on a single cerebellar region (i.e. the vermis) and did not observe abnormal activation during an auditory discrimination task (Davalos, Rojas, & Tregellas, Reference Davalos, Rojas and Tregellas2011). Yet, robust evidence from task-based and resting state functional connectivity magnetic resonance imaging (fcMRI) studies in both healthy and schizophrenia spectrum populations indicates the cerebellum is comprised of functionally distinct topographical regions involved in cortical and subcortical circuitry associated with a wide range of functions that may underlie or contribute to timing processes (Bernard & Mittal, Reference Bernard and Mittal2014; Schmahmann, Reference Schmahmann2018; Stoodley, Reference Stoodley2012). Regional specificity is particularly important as distinct topographical regions are thought to be involved in both automatic timing processes (i.e. sub-second) (Kawashima et al., Reference Kawashima, Okuda, Umetsu, Sugiura, Inoue, Suzuki and Nagasaka2000; Salman, Reference Salman2002), as well as higher order cognitive functions thought to contribute to temporal processing, particularly in supra-second timing (i.e. working memory/attention) (Buhusi & Meck, Reference Buhusi and Meck2005; Meck, Reference Meck2005; Merchant, Harrington, & Meck, Reference Merchant, Harrington and Meck2013). For example, the anterior lobe of the cerebellum exhibits resting state connectivity with cortical motor regions (Schmahmann, Reference Schmahmann2018; Stoodley, Reference Stoodley2012), and may be necessary for motor and perceptual timing (Jueptner et al., Reference Jueptner, Rijntjes, Weiller, Faiss, Timmann, Mueller and Diener1995; Kawashima et al., Reference Kawashima, Okuda, Umetsu, Sugiura, Inoue, Suzuki and Nagasaka2000; Lutz, Specht, Shah, & JaÈncke, Reference Lutz, Specht, Shah and JaÈncke2000; Salman, Reference Salman2002). This has been interpreted as evidence for cerebellar involvement in an automatic neural ‘time keeper’ that provides a precise representation of temporal information (Kawashima et al., Reference Kawashima, Okuda, Umetsu, Sugiura, Inoue, Suzuki and Nagasaka2000; Lutz et al., Reference Lutz, Specht, Shah and JaÈncke2000; Salman, Reference Salman2002). In contrast, the posterior lobe (particularly Crus I) demonstrates connectivity with cortical regions (e.g. prefrontal cortex) involved in higher-order cognitive processes thought to contribute to temporal processing, such as attention and working memory (Bernard et al., Reference Bernard, Seidler, Hassevoort, Benson, Welsh, Wiggins and Jonides2012; Schmahmann, Reference Schmahmann2018; Stoodley, Valera, & Schmahmann, Reference Stoodley, Valera and Schmahmann2012). Thus, using a regional cerebellar approach may reveal distinct relationships between cerebellar topography and disturbances in temporal processing across the psychosis spectrum.
The use of fcMRI to investigate these questions in youth at CHR for psychosis may be particularly informative. For instance, fcMRI affords an examination of the intrinsic communication between specific brain regions without the potential confounds of functional tasks (Gupta et al., Reference Gupta, Silverstein, Bernard, Keane, Papathomas, Pelletier-Baldelli and Mittal2016; Whitfield-Gabrieli & Ford, Reference Whitfield-Gabrieli and Ford2012). Furthermore, evidence suggests that both decreased and increased resting state functional connectivity is present in CHR populations and is associated with worsening of positive and negative symptoms and conversion status (Anticevic et al., Reference Anticevic, Haut, Murray, Repovs, Yang, Diehl and Goodyear2015; Bernard et al., Reference Bernard, Dean, Kent, Orr, Pelletier-Baldelli, Lunsford-Avery and Mittal2014; Bernard, Orr, & Mittal, Reference Bernard, Orr and Mittal2017; Dandash et al., Reference Dandash, Fornito, Lee, Keefe, Chee, Adcock and Harrison2013; Pelletier-Baldelli, Andrews-Hanna, & Mittal, Reference Pelletier-Baldelli, Andrews-Hanna and Mittal2018). Crucially, many of the same subcortical and cortical regions exhibiting abnormal connectivity in CHR youth overlap with regions implicated in timing [e.g. dorsal striatum, cerebellum, supplementary motor area (SMA), prefrontal cortex] (Coull et al., Reference Coull, Cheng and Meck2011). For example, Cao et al. (Reference Cao, Chén, Chung, Forsyth, McEwen, Gee and Cadenhead2018) observed hyperconnectivity in a network comprised of both subcortical (i.e. cerebellum, striatum, thalamus) and cortical areas (e.g. SMA), superior and medial frontal gyri in CHR youth; hyperconnectivity across this network was associated with shorter time to conversion and disorganized symptoms. Given these same regions are implicated in timing and exhibit abnormalities in CHR youth, examining how potential deficits in timing are associated with cerebellar resting state functional connectivity stands to inform the field's understanding of how these processes are implicated in psychosis risk.
The present study used a sub-second temporal bisection task and fcMRI to better understand timing dysfunction and cerebellar connectivity in CHR youth. We used sub-second temporal stimuli because the timing in the sub-second range is more strongly implicated in cerebellar connectivity (Breska & Ivry, Reference Breska and Ivry2016). Moreover, we chose the temporal bisection task (Allan & Gibbon, Reference Allan and Gibbon1991; Church & Deluty, Reference Church and Deluty1977) because of its well-known psychophysical properties and extensive use in schizophrenia patients (see Thoenes & Oberfeld, Reference Thoenes and Oberfeld2017). Deficits in the temporal bisection task are typically interpreted with regards to pacemaker-accumulator models of timing (Carroll et al., Reference Carroll, Boggs, O'Donnell, Shekhar and Hetrick2008; Gibbon, Church, & Meck, Reference Gibbon, Church and Meck1984), which posit that the onset of a sensory event (e.g. an auditory tone) triggers an internal pacemaker that emits pulses that are stored and then summed in an accumulator for comparison to previously encoded temporal durations held in long-term memory (Carroll et al., Reference Carroll, Boggs, O'Donnell, Shekhar and Hetrick2008; Carroll et al., Reference Carroll, O'Donnell, Shekhar and Hetrick2009b; Coull et al., Reference Coull, Cheng and Meck2011; Thoenes & Oberfeld, Reference Thoenes and Oberfeld2017). Previous studies have shown that patients with schizophrenia exhibit higher bisection points on the temporal bisection task which is thought to reflect a slower internal clock where fewer pulses are emitted during the clock stage, resulting in a greater proportion of intermediate tone durations perceived as shorter (Lee et al., Reference Lee, Dixon, Spence and Woodruff2006; Reed & Randell, Reference Reed and Randell2014; Thoenes & Oberfeld, Reference Thoenes and Oberfeld2017). In addition, patients also show more variability (i.e. higher difference limens) in the bisection task when classifying stimuli (Bolbecker et al., Reference Bolbecker, Westfall, Howell, Lackner, Carroll, O'Donnell and Hetrick2014; Carroll et al., Reference Carroll, Boggs, O'Donnell, Shekhar and Hetrick2008).
In line with previous research in schizophrenia populations (Elvevåg et al., Reference Elvevåg, McCormack, Gilbert, Brown, Weinberger and Goldberg2003; Lee et al., Reference Lee, Dixon, Spence and Woodruff2006; Reed & Randell, Reference Reed and Randell2014; Thoenes & Oberfeld, Reference Thoenes and Oberfeld2017), we hypothesized that CHR participants would exhibit deficits in both temporal accuracy and precision compared to healthy controls (HCs). Given it is thought that sub-second timing preferentially recruits motor circuitry (Lewis & Miall, Reference Lewis and Miall2003b), we hypothesized that deficits in temporal accuracy and precision would be associated with abnormal anterior cerebellar resting state connectivity with cortical and/or subcortical motor regions (e.g. SMA, striatum) in CHR participants. To examine associations between temporal dysfunction and baseline symptoms and worsening of symptoms, we conducted exploratory analyses on positive and negative symptoms at baseline, as well as changes in positive and negative symptoms over a 12-month period.
Methods
Participants
Data for the present study were obtained from 56 CHR and 52 HC youth (total N = 108; 16–21 years old, M age = 19.01, s.d. age = 1.44). Exclusion criteria for both groups included any neurological disorder, history of head injury, life-time substance dependence, or any past or current psychotic disorder (e.g. schizophrenia). For HCs, the presence of a psychotic disorder in a first-degree relative and any past or current Axis I disorders were additional exclusionary criteria. We experienced 30% attrition at 12-month follow-up which is comparable to other studies in this area (Bernard et al., Reference Bernard, Orr and Mittal2017; Mittal et al., Reference Mittal, Dean, Bernard, Orr, Pelletier-Baldelli, Carol and Robustelli2013; Mittal, Neumann, Saczawa, & Walker, Reference Mittal, Neumann, Saczawa and Walker2008). Informed consent was obtained in accordance with the protocol approved by the University Institutional Review Board.
Clinical interviews
The Structured Interview for Psychosis Risk Syndromes (SIPS; McGlashan, Walsh, & Woods, Reference McGlashan, Walsh and Woods2010; Miller et al. Reference Miller, McGlashan, Woods, Stein, Driesen, Corcoran and Davidson1999) was administered to diagnose a CHR syndrome at the baseline assessment and track symptom change at follow-up. Criteria for a prodromal syndrome included one or more of the following: (1) progression or recent onset of attenuated positive symptoms, (2) the presence of a first-degree relative with a psychotic disorder accompanied by a recent decline in global functioning, or (3) a decline in global functioning with the presence of schizotypal personality disorder (Miller et al., Reference Miller, McGlashan, Woods, Stein, Driesen, Corcoran and Davidson1999). In addition, the Structured Clinical Interview for Axis I DSM-IV Disorders (SCID; First, Spitzer, Gibbon, and Williams, Reference First, Spitzer, Gibbon and Williams1995) was administered in order to rule out a psychotic disorder and to note the occurrence of any comorbid conditions. Clinical interviews were administered by advanced doctoral students with inter-rater reliabilities that exceeded the minimum study criterion of κ⩾0.80.
Because alcohol and cannabis use can affect both cerebellar function and temporal processes (Deshmukh, Rosenbloom, Pfefferbaum, & Sullivan, Reference Deshmukh, Rosenbloom, Pfefferbaum and Sullivan2002; Hicks, Gualtieri, Mayo, & Perez-Reyes, Reference Hicks, Gualtieri, Mayo and Perez-Reyes1984; Lieving, Lane, Cherek, & Tcheremissine, Reference Lieving, Lane, Cherek and Tcheremissine2006; Solowij et al., Reference Solowij, Yücel, Respondek, Whittle, Lindsay, Pantelis and Lubman2011; Tinklenberg, Roth, & Kopell, Reference Tinklenberg, Roth and Kopell1976), frequency of use was assessed using the Alcohol Use Scale (AUS) and Drug Use Scale (DUS) (Drake, Mueser, & McHugo, Reference Drake, Mueser, McHugo, Sederer and Dickey1996). These ratings were numerically coded from 0 (never) to 5 (almost daily) for use in our statistical analyses.
Temporal bisection task
The bisection task requires participants to classify intermediate tone durations as either ‘short’ or ‘long’ depending on their similarity to two previously learned anchor tones (880 Hz), a ‘short’ 300 ms tone and a ‘long’ 600 ms tone. The task was comprised of training, practice, and test phases (see online Supplementary Material for training/practice details). During the test phase, participants were presented with the 300 and 600 ms anchor tones, and five arithmetically spaced intermediate tone durations (350, 400, 450, 500, and 550 ms) and were instructed to judge whether each tone was ‘short’ or ‘long’. Participants completed three test blocks consisting of 35 trials each (i.e. five presentations per stimulus duration).
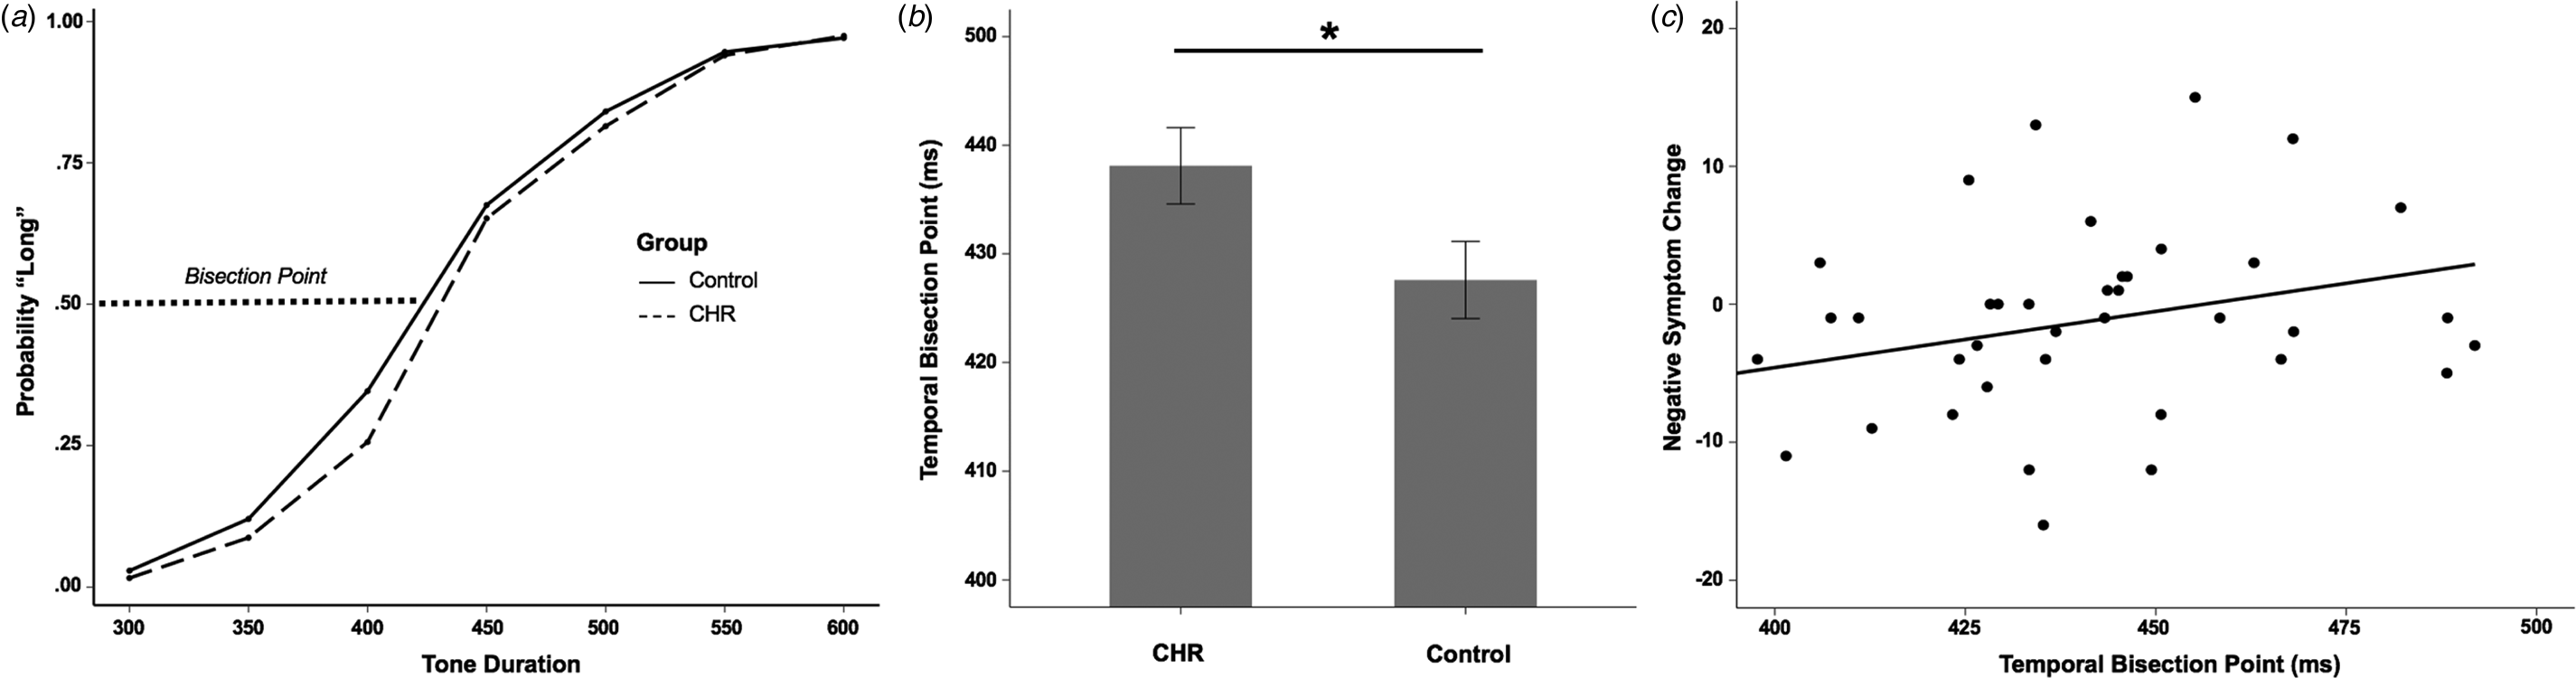
For each participant, the proportion of ‘long’ responses for both the anchor and intermediate stimuli were plotted as a function of stimulus duration and used to quantify the accuracy and precision of an individual's temporal perception. This method yields a psychometric response curve for each participant that is typically sigmoidal (S-shaped; Fig. 1a), resulting in the proportion of tone durations near the short anchor (300 ms) classified as ‘long’ to be near zero and tone durations near the long anchor (600 ms) classified as ‘long’ to be near one. The bisection point is the duration value at which intermediate durations are equally probable to be classified as ‘short’ or ‘long’. Bisection points will typically fall closer to the geometric mean of the anchor durations when the ratio of ‘long’ to ‘short’ anchor durations are small (e.g. 600/300 ms) (Kopec & Brody, Reference Kopec and Brody2010). Thus, depending on the anchor ratio, deviations from the geometric or arithmetic mean reflect the temporal accuracy of an individual's temporal perception (Thoenes & Oberfeld, Reference Thoenes and Oberfeld2017). The slope of the plotted function is referred to as the difference limen and reflects temporal precision (i.e. variability). Smaller difference limens indicate steeper slopes, and thus, greater temporal precision when classifying the anchor and intermediate tones (Carroll et al., Reference Carroll, Boggs, O'Donnell, Shekhar and Hetrick2008; Thoenes & Oberfeld, Reference Thoenes and Oberfeld2017). See online Supplementary Material for derivations of the two temporal measures.
(a) The proportion of long responses as a function of stimulus duration. The dotted line at 0.50 on the y-axis represents the bisection point. (b) Group differences in the bisection point (*p < 0.05). (c) Scatter plot representing the relationship between baseline temporal bisection point and negative symptoms at 12-month follow-up.

MRI scanning procedure
Structural and resting state functional scans were acquired using a 3-Tesla Siemens Tim Trio MRI scanner (Siemens AG, Munich, Germany) using a standard 12-channel head coil. Structural images were acquired with a T1-weighted 3D magnetization prepared rapid gradient multi-echo sequence [MPRAGE; sagittal plane; repetition time (TR) = 2530 ms; echo times (TE) = 1.64 ms, 3.5 ms, 5.36 ms, 7.22 ms, 9.08 ms; GRAPPA parallel imaging factor of 2; 1 mm3 isomorphic voxels, 192 interleaved slices; FOV = 256 mm; flip angle = 7°; time = 6:03 min]. A 5 min 34 s resting state blood-oxygen-level-dependent (BOLD) scan was acquired with a T2-weighted echo-planar functional protocol (number of volumes = 165; TR = 2000 ms; TE = 29 ms; matrix size = 64 × 64 × 33; FA = 75°; 3.8 × 3.8 × 3.5 mm3 voxels; 33 slices; FOV = 240 mm). See online Supplementary Material for more information regarding parameters for identifying incidental pathology and participant scanning procedures.
fcMRI data preprocessing
Data were preprocessed in FSL (v. 5; http://fsl.fmrib.ox.ac.uk/fsl), which involved motion correction, brain extraction, high-pass filtering (100 s), and spatial smoothing (6 mm FWHM). Next, functional images were aligned to the MNI 2 mm brain template with a two-step procedure. First, the resting state scan was aligned to the high-resolution MPRAGE using a linear boundary-based registration method, which relies on white matter boundaries (Greve & Fischl, Reference Greve and Fischl2009; Jenkinson & Smith, Reference Jenkinson and Smith2001; Jenkinson, Bannister, Brady, & Smith, Reference Jenkinson, Bannister, Brady and Smith2002). Second, the MPRAGE was non-linearly aligned to the template and the two registrations were then combined to align the fcMRI scan to the template. To account for motion-related artifacts, temporal derivative regressors were calculated with the Artifact Rejection Toolbox (ART; http://www.nitrc.org/projects/artifact_detect/). The resultant motion regressors were entered into the model as a temporal derivative nuisance covariate at the subject level (see online Supplementary Material for details on motion-artifact control).
Functional connectivity – cerebellar seed to voxel connectivity approach
Functional connectivity analyses were conducted using data from 51 CHR and 48 HC participants (one CHR and four HC participants did not complete the scanning portion of the study) in the CONN toolbox v. 17.f (Whitfield-Gabrieli & Nieto-Castanon, Reference Whitfield-Gabrieli and Nieto-Castanon2012). The data were band-pass filtered from 0.008 to 0.09 Hz. Lobular seed regions-of-interest (ROIs) within the bilateral anterior cerebellum (Lobules I–V), bilateral Crus I, and bilateral Lobule X were defined based on the SUIT atlas (Diedrichsen, Reference Diedrichsen2006; Diedrichsen, Balsters, Flavell, Cussans, & Ramnani, Reference Diedrichsen, Balsters, Flavell, Cussans and Ramnani2009) as described by Bernard & Seidler (Reference Bernard and Seidler2013). The anterior cerebellum and Crus I were used to examine if specific associations between topographical regions involved in motor processes (anterior cerebellum) and higher-order cognition (Crus I) were associated with temporal dysfunction. Lobule X, which is primarily involved in vestibular functions (Baumann et al., Reference Baumann, Borra, Bower, Cullen, Habas, Ivry and Moulton2015), was used as a control region in order to demonstrate specificity across the cerebellar lobular ROIs. The mean time-series, averaged across all voxels within each seed ROI (anterior cerebellum, Crus I, and Lobule X), were used as regression parameters, and correlated with all other voxels in the brain in separate seed-to-voxel connectivity analyses. Anatomical images were segmented into gray matter, white matter, and CSF with SPM8 in order to create masks for signal extraction. The CONN toolbox uses principal components analysis to extract five temporal components from the segmented CSF and white matter, which were entered as confound regression in the subject-level general linear model. This approach corrects for confounds of motion and physiological noise without regressing out a global signal, providing equivalent global signal reduction (Chai et al., Reference Chai, Whitfield-Gabrieli, Shinn, Gabrieli, Castanón, McCarthy and Öngür2011; Murphy, Birn, Handwerker, Jones, & Bandettini, Reference Murphy, Birn, Handwerker, Jones and Bandettini2009). As previously mentioned, the composite motion metric from the ART toolbox was included as a confound regressor.
Connectivity analyses approach
The study examined group differences in seed connectivity, and also tested for interactions to investigate if associations between cerebellar resting state connectivity and temporal measures (performed outside of the scanner) were different by group. In order to interpret any significant interactions, we extracted connectivity weights for significant seed-to-voxel clusters to compare temporal measures between groups. Consistent with the behavioral statistical approach, we limited fcMRI analyses to timing variables with significant group differences. Data in tables and statistical maps were first thresholded at the voxel-level at p uncorr < 0.001 and then corrected at the cluster-level to a false-discovery rate (FDR) of p < 0.05 (Chumbley & Friston, Reference Chumbley and Friston2009). Because antipsychotic medications are dopamine (DA) antagonist, and evidence suggests that DA affects temporal processing in both animals and humans (Buhusi & Meck, Reference Buhusi and Meck2005; Coull et al., Reference Coull, Cheng and Meck2011), connectivity weights for significant seed-to-voxel clusters were examined with and without individuals receiving antipsychotics (N = 7 CHR).
Behavioral analysis approach
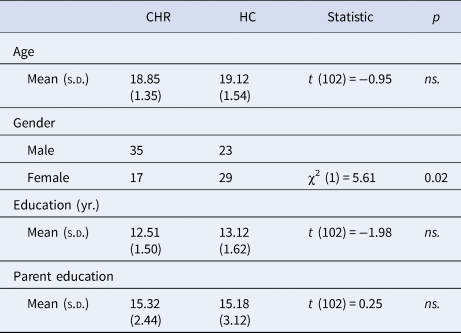
The χ2 tests and independent t tests were employed to examine group differences in demographic variables (Table 1). To test for group differences between CHR and HC young adults in the bisection point, difference limen, and anchor tone accuracy, we used analysis of covariance (ANCOVA) controlling for alcohol consumption and cannabis use. Outliers were defined as ±3 standard deviations from the mean on any temporal measure. A single outlier was identified for each of the timing variables, resulting in the removal of one CHR participant from each analysis. In addition, three CHR participants were excluded from all analyses, two for extreme response times (i.e. multiple responses >5 s) on the temporal bisection task, and one for alcohol consumption and cannabis use not being assessed. Thus, the final sample consisted of 52 CHR and 52 HC participants (total N = 104) for all ANCOVA analyses.
Demographics characteristics with group comparisons

Note: Statistic reflects test of group differences for each demographic variable.
CHR, clinical high-risk; HC, healthy controls; ns., non-significant.
To avoid inflating the experiment-wise Type 1 error rate, the examination of associations between temporal measures and symptoms were limited to temporal variables with significant group differences. Partial correlations, controlling for alcohol consumption and cannabis use, were employed to examine associations between temporal measures and baseline positive and negative symptoms. To examine relationships between timing variables and worsening of symptoms, we used a hierarchical linear regression approach predicting change in symptoms at 12-month follow-up compared to baseline from timing variables controlling for baseline symptoms, alcohol consumption, and cannabis use. Change scores were computed by subtracting baseline positive and negative symptoms from 12-month follow-up positive and negative symptoms, respectively. Longitudinal analyses were conducted on the 39 CHR and 39 HC participants (N = 78) retained in the sample. Two-tailed tests with α = 0.05 were used for all analyses. Consistent with the fcMRI statistical approach, behavioral analyses were examined with and without CHR youth receiving antipsychotics.
Results
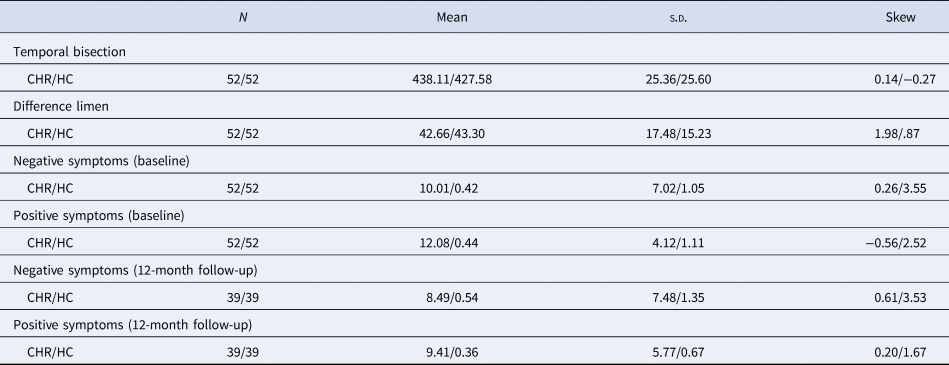
There were no group differences in regards to age, education, or parent education (Table 1). There was a significant group difference in the distribution of sex at baseline and a significant correlation between sex and temporal bisection points within the control group. We controlled for sex in all models that included group and temporal bisection point; results remained unchanged, thus we reported results without controlling for sex (see online Supplementary Material for statistics controlling for sex). See Table 2 for descriptive statistics for temporal measures and symptoms. With the exception of symptom change (see below), behavioral and fcMRI findings did not change with the removal of CHR participants receiving antipsychotics.
Descriptive statistics for temporal measures and symptoms at baseline and 12-month follow-up

CHR, clinical high-risk; HC, healthy control; s.d., standard deviation; SCQ, Social Communication Questionnaire.
Group differences in temporal bisection
CHR participants had significantly poorer temporal accuracy (i.e. higher bisection points) compared to HC participants, F (1, 100) = 6.14, p = 0.02,  $\eta _p^2 $ = 0.06 (Fig. 1b). There was not a significant group difference in temporal precision, F (1, 100) = 0.41, p = 0.52,
 $\eta _p^2 $ = 0.004. Accuracy rates (i.e. percent correct) for the anchor tones were comparable between CHR (98%) and HC (98%) participants, F (1, 100) = 0.14, p = 0.71,
 $\eta _p^2 $ = 0.001.
Resting state functional connectivity results
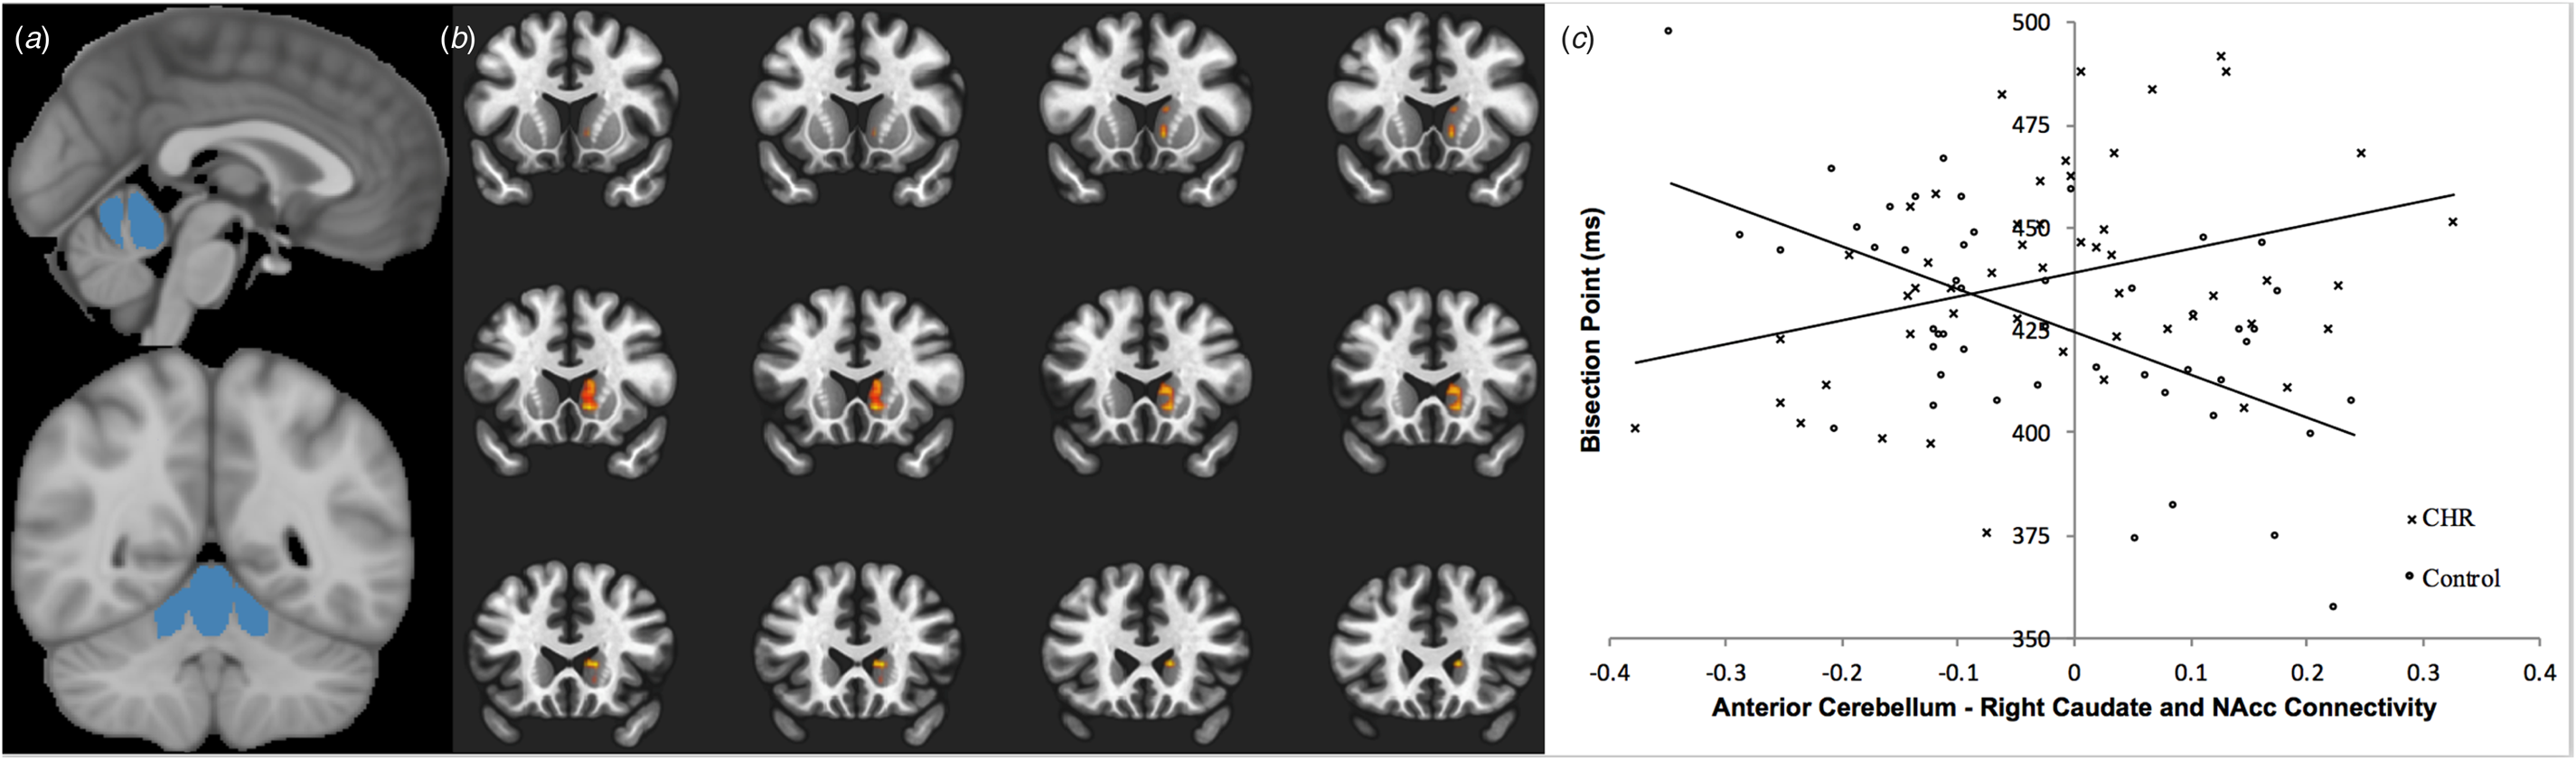
There were no significant group differences in connectivity when using the anterior cerebellum, Crus I, or Lobule X as seed regions. In the anterior cerebellum, there was a significant interaction between the group and temporal accuracy in the seed-to-voxel analysis, FDRcorrected p < 0.05 (cluster size: 173; MNI coordinates [XYZ]: 14, 26, 8; t = 5.01; p = 0.0001) (Fig. 2a). Specifically, higher bisection points were associated with increased resting state connectivity between the anterior cerebellum and a right caudate/nucleus accumbens (NAcc) striatal cluster at rest in the CHR group (Fig. 2b). HCs showed the opposite effect, wherein higher bisection points were associated with decreased resting state connectivity between the anterior cerebellum and the right caudate/NAcc cluster. There was not a significant interaction between the group and temporal accuracy for either Crus I or Lobule X. There were no significant group differences in brain activation or motion outliers (see online Supplementary Material for group comparison statistics).
(a) Left panel: Depicts the bilateral anterior cerebellum seed region. Right panel: Depicts the contiguous striatal cluster in the right caudate and nucleus accumbens (NAcc) which showed a significant group by bisection interaction (FDR corrected p < 0.05). (b) Connectivity between the regions was extracted and plotted by group and bisection score.

Temporal bisection point and worsening of symptoms
Within the CHR group, temporal accuracy was not significantly associated with either baseline positive (r partial = 0.01, p = 0.92) or baseline negative symptoms (r partial = 0.09, p = 0.53). Hierarchal linear regression was used to examine if baseline temporal accuracy was associated with symptoms at follow-up (Table 3). Higher temporal bisection points (i.e. poorer temporal accuracy) accounted for 9% of the variance in worsening of positive symptoms at 12-month follow-up (β = 0.31, p = 0.06). Higher temporal bisection points accounted for 11% of the variance in worsening of negative symptoms at 12-month follow-up (β = 0.35, p = 0.03) (Fig. 1c). Notably, the models were improved with the removal of CHR youth receiving antipsychotic treatment (N = 5 at follow-up). After removal, higher temporal bisection points accounted for 18% of the variance in worsening of positive symptoms (β = 0.45, p = 0.01), and 18% of the variance in worsening of negative symptoms (β = 0.45, p = 0.007) at 12-month follow-up.
Hierarchical linear regressions results (full sample)

**p < 0.01; *p < 0.05; †p < 0.08.
Conclusions
To our knowledge, this is the first study to examine temporal dysfunction and its association with cerebellar resting state connectivity and worsening of symptoms in individuals at CHR for psychosis. As predicted, CHR participants were less accurate (i.e. higher bisection points) in their temporal perception when classifying auditory tone durations compared to HCs. Broadly, this suggests that, similar to patients with schizophrenia (Thoenes & Oberfeld, Reference Thoenes and Oberfeld2017), CHR individuals perceive time as shortened compared to objective time. In contrast to our prediction, impairments in temporal precision were not observed in the current study. Additionally, poorer temporal accuracy was associated with increased resting state connectivity between the anterior cerebellum and a right caudate/NAcc striatal cluster in the CHR group. This suggests that timing dysfunction in CHR youth is associated with abnormalities in brain regions involved in an important cerebellar network implicated in prominent etiological models of psychosis (Andreasen et al., Reference Andreasen, Nopoulos, O'Leary, Miller, Wassink and Flaum1999; Andreasen & Pierson, Reference Andreasen and Pierson2008; Kendler & Schaffner, Reference Kendler and Schaffner2011). Lastly, poorer temporal accuracy was also associated with worse negative symptom severity at 12-month follow-up, suggesting deficits in temporal processing are sensitive to symptom progression in CHR youth.
Poorer temporal accuracy in the CHR group is consistent with existing literature demonstrating that patients with schizophrenia exhibit deficits in temporal accuracy on auditory bisection tasks (Elvevåg et al., Reference Elvevåg, McCormack, Gilbert, Brown, Weinberger and Goldberg2003; Thoenes & Oberfeld, Reference Thoenes and Oberfeld2017). In contrast to studies with psychosis populations, we did not observe impairment in temporal precision in the CHR group. This may suggest that deficits in temporal precision develop later in the course of psychosis or may be a result of long-term antipsychotic use. However, given there is considerable variation in illness trajectories in CHR samples (Addington et al., Reference Addington, Stowkowy, Liu, Cadenhead, Cannon, Cornblatt and Tsuang2019), lack of an observed deficit in temporal precision in the current study may also reflect sample heterogeneity. Moreover, given that individuals with genetic vulnerability for psychosis (i.e. first-degree relatives) exhibit less temporal precision than HCs (Penney et al., Reference Penney, Meck, Roberts, Gibbon and Erlenmeyer-Kimling2005), the lack of group differences in the current study may reflect phenotypic differences between high-risk populations. Consistent with this notion, evidence from genetic contributions to timing has shown that polymorphisms known to modulate D2 density in the striatum (DRD2/ANKK1-Taq1a; Jönsson et al., Reference Jönsson, Nöthen, Grünhage, Farde, Nakashima, Propping and Sedvall1999) are associated with sub- but not supra-second temporal perception (Wiener, Lohoff, & Coslett, Reference Wiener, Lohoff and Coslett2011), which may suggest temporal dysfunction could be an endophenotype for schizophrenia and high-risk populations.
Consistent with predictions, higher bisection points were associated with abnormal anterior cerebello-striatal connectivity in the CHR group. Although we did not make a priori predictions regarding hypo- or hyperconnectivity in regards to cerebellar resting state connectivity, increased cerebello-striatal connectivity in the CHR group is consistent with past work demonstrating hyperconnectivity in cerebello-striatal connectivity in CHR and schizophrenia populations (Cao et al., Reference Cao, Chén, Chung, Forsyth, McEwen, Gee and Cadenhead2018; Zhuo et al., Reference Zhuo, Wang, Wang, Guo, Xu, Liu and Zhu2018). Relationships between abnormal cerebellar connectivity and temporal accuracy were not observed for either Crus I or Lobule X seed regions, suggesting there may be regional specificity between distinct cerebellar topographical regions and temporal dysfunction in CHR youth. These findings are generally consistent with the small number of neuroimaging investigations of temporal perception in patients with schizophrenia demonstrating abnormal striatal activity (but not cerebellar) in both supra- and sub-second temporal discrimination tasks (Davalos et al., Reference Davalos, Rojas and Tregellas2011; Volz et al., Reference Volz, Nenadic, Gaser, Rammsayer, Häger and Sauer2001). However, these studies either did not include the cerebellum as an ROI in analyses (Volz et al., Reference Volz, Nenadic, Gaser, Rammsayer, Häger and Sauer2001) or limited cerebellar ROIs to the vermis (Davalos et al., Reference Davalos, Rojas and Tregellas2011). However, it will be important to replicate these findings in larger CHR and schizophrenia samples.
When considering the present findings from a pacemaker-accumulator model of timing, they may suggest individuals at CHR for psychosis have a slower internal clock, resulting in poorer temporal. This interpretation is further supported by the observed associations between poorer temporal accuracy and abnormal cerebello-striatal connectivity, regions that are recruited in the automatic processing of sub-second temporal stimuli (Lewis & Miall, Reference Lewis and Miall2003b). Consistent with this assertion, evidence suggests that the dorsal striatum may serve as either the pacemaker (i.e. pulse emitter) (Coull et al., Reference Coull, Cheng and Meck2011) and/or accumulator (i.e. encoding) (Harrington et al., Reference Harrington, Boyd, Mayer, Sheltraw, Lee, Huang and Rao2004; Rao, Mayer, & Harrington, Reference Rao, Mayer and Harrington2001) for the neural representation of temporal information, with the cerebellum contributing a similar or complimentary role when sub-second timing is required (Kunimatsu, Suzuki, Ohmae, & Tanaka, Reference Kunimatsu, Suzuki, Ohmae and Tanaka2018; Teki, Grube, & Griffiths, Reference Teki, Grube and Griffiths2012). Moreover, imaging studies suggest that the caudate nucleus in particular is critical for perception of temporal durations in both supra- and sub-section stimulus ranges (Harrington et al., Reference Harrington, Boyd, Mayer, Sheltraw, Lee, Huang and Rao2004; Meck, Penney, & Pouthas, Reference Meck, Penney and Pouthas2008; Pouthas et al., Reference Pouthas, George, Poline, Pfeuty, VandeMoorteele, Hugueville and Renault2005; Rao et al., Reference Rao, Mayer and Harrington2001; Tregellas, Davalos, & Rojas, Reference Tregellas, Davalos and Rojas2006). An alternative or complimentary explanation is that the observed temporal accuracy deficits may be emblematic of a more pervasive information processing disturbance (Nieman et al., Reference Nieman, Ruhrmann, Dragt, Soen, van Tricht, Koelman and Weiser2013; Thomas et al., Reference Thomas, Green, Hellemann, Sugar, Tarasenko, Calkins and Lazzeroni2017) that may interact with or explain putative internal clock slowing. Similarly, auditory processing deficits are evident in both CHR populations and schizophrenia patients (Corcoran et al., Reference Corcoran, Keilp, Kayser, Klim, Butler, Bruder and Javitt2015; Javitt & Sweet, Reference Javitt and Sweet2015; Mathalon et al., Reference Mathalon, Roach, Ferri, Loewy, Stuart, Perez and Ford2019; Perez et al., Reference Perez, Woods, Roach, Ford, McGlashan, Srihari and Mathalon2014; Turetsky, Bilker, Siegel, Kohler, & Gur, Reference Turetsky, Bilker, Siegel, Kohler and Gur2009), and work on the potential effects of auditory processing deficits on auditory temporal accuracy will be an important area of future research.
Interestingly, temporal accuracy was not associated with baseline symptoms, but did predict worsening of negative symptoms across 12 months. When examining these associations without CHR youth receiving antipsychotic medication, temporal accuracy was also associated with worsening of positive symptoms, suggesting that antipsychotic medication may mask underlying effects. Given the demonstrated associations between motor circuitry and negative symptom worsening in CHR youth (Bernard et al., Reference Bernard, Dean, Kent, Orr, Pelletier-Baldelli, Lunsford-Avery and Mittal2014; Dean & Mittal, Reference Dean and Mittal2015), and the current evidence for an association between poorer temporal accuracy and abnormal cerebello-striatal connectivity, associations with worsening of negative symptoms is not surprising. Intriguingly, transcranial magnetic stimulation stimulation of the cerebellum has been shown to modulate temporal accuracy in HCs (Fierro et al., Reference Fierro, Palermo, Puma, Francolini, Panetta, Daniele and Brighina2007; Grube, Lee, Griffiths, Barker, & Woodruff, Reference Grube, Lee, Griffiths, Barker and Woodruff2010; Koch et al., Reference Koch, Oliveri, Torriero, Salerno, Gerfo and Caltagirone2007; Lee et al., Reference Lee, Egleston, Brown, Gregory, Barker and Woodruff2007), suggesting cerebellar stimulation may be a viable early intervention for CHR individuals to mitigate illness progression. Indeed, similar stimulation methods have been shown to improve negative symptoms in schizophrenia populations (Brady et al., Reference Brady, Gonsalvez, Lee, Öngür, Seidman, Schmahmann and Halko2019; Demirtas-Tatlidede et al., Reference Demirtas-Tatlidede, Freitas, Cromer, Safar, Ongur, Stone and Pascual-Leone2010).
There are several limitations to the current study. First, the current findings are correlational in nature and cannot provide conclusive evidence that similar regions would be activated during task-based fMRI, requiring further task-based work to replicate the current findings. Similarly, methods for identifying the functional boundaries of the cerebellum are rapidly advancing (see Guell, Schmahmann, Gabrieli, & Ghosh, Reference Guell, Schmahmann, Gabrieli and Ghosh2018; King, Hernandez-Castillo, Poldrack, Ivry, & Diedrichsen, Reference King, Hernandez-Castillo, Poldrack, Ivry and Diedrichsen2019), and it will be important for future well-powered studies to validate and incorporate newer parcellation approaches in CHR populations. This may further aid in clarifying the specific cerebellar topographical abnormalities associated with timing dysfunction in CHR youth. Second, although the sample for the current study is comparable to other research in CHR and schizophrenia populations, larger samples may reveal interesting subgroups. For example, given the heterogeneous presentation characteristic of psychotic disorders, deficits in temporal precision may be present in a yet undetermined subgroup of CHR individuals.
Supplementary material
The supplementary material for this article can be found at https://doi.org/10.1017/S0033291719004161.
Acknowledgements
None.
Financial support
This work was supported by the National Institutes of Health (V.A.M., grant numbers R01MH094650, R21/R33MH103231).
Conflict of interest
None.
Ethical standards
The authors assert that all procedures contributing to this work comply with the ethical standards of the relevant national and institutional committees on human experimentation and with the Helsinki Declaration of 1975, as revised in 2008.