Introduction
Fuzzy methods have been extensively applied to production planning involving uncertainty (Chen, Reference Chen2003). A fuzzy production planning model is usually converted into a crisp model that can be easily solved, thus resulting in considerable loss of information. To overcome this problem, Jiménez et al. (Reference Jiménez, Sánchez and Vasant2013) attempted to determine all the solutions to a fuzzy production planning model on the Pareto front and express each solution as a triplet. They also established a procedure to enable a decision-maker to select the most suitable solution. For the aggregate production planning of a Brazilian sugar mill, da Silva and Marins (Reference da Silva and Marins2014) proposed a fuzzy goal programming model and found that the determination of the goal influenced the effectiveness of the model. Su and Lin (Reference Su and Lin2015) formulated a fuzzy multiobjective linear programming problem to plan the production of a recoverable remanufacturing system. The objective functions optimized in their study included the minimization of total cost and total lead time. Gholamian et al. (Reference Gholamian, Mahdavi, Tavakkoli-Moghaddam and Mahdavi-Amiri2015) proposed a fuzzy multiobjective mixed-integer nonlinear programming (FMOMINLP) model for the production planning of a supply chain. The FMOMINLP model had four objective functions and was converted into a crisp multiobjective mixed-integer linear programming model to facilitate problem solving. To select the least risky and most suitable procurement–production plan for a multiechelon supply chain with multiple suppliers, multiple parallel manufacturing plants, multiple subcontractors, and a specified number of customers, Khemiri et al. (Reference Khemiri, Elbedoui-Maktouf, Grabot and Zouari2017) applied the fuzzy technique for the order of preference based on the similarity to the ideal solution.
Most related studies have been conducted in static manufacturing environments rather than ubiquitous manufacturing (UM) environments (Wu et al., Reference Wu, Terpenny and Schaefer2017). Even studies on supply chains (Bhattacharya et al., Reference Bhattacharya, Mohapatra, Kumar, Dey, Brady, Tiwari and Nudurupati2014) have been restricted to static manufacturing environments, in which manufacturing facilities are basically fixed. By contrast, in an UM environment, manufacturing facilities in the vicinity of a customer collaborate to deliver an order (Chen and Tsai, Reference Chen and Tsai2017); thus, the manufacturing facilities vary based on a customer's location. A few studies have examined production planning in an UM system; most of those that have, such as Zhang et al. (Reference Zhang, Huang, Qu, Ho and Sun2011) and Fang et al. (Reference Fang, Huang and Li2013), have focused on the remote monitoring of machines or work-in-process statuses by using radio-frequency identification (RFID) and agent technologies. In other words, these studies have focused on capturing data for production planning. Zhong et al. (Reference Zhong, Huang, Lan, Dai, Zhang and Xu2015) showed that production and scheduling based on real-time data captured using RFID techniques reduced the total tardiness by 40%.
Constructing an UM system was a challenge until advances in information, communication, and computer technologies simplified the process. Although UM is an optimal approach to elevate the scalability of a manufacturing system (Chen, Reference Chen2014), interoperability is still difficult to achieve in an UM system. The advent of 3D printing provided a solution to this problem because of the open standards of recipes, standalone processing, and ease of transmission (Chen and Lin, Reference Chen and Tsai2017; Zimmermann et al., Reference Zimmermann, Chen and Shea2018).
Although 3D printing is a predominantly automatic operation, a considerable amount of human intervention is required before, during, and after a 3D printing project; the intervention includes tasks such as setting up a 3D printer, cleaning and leveling the print bed, and adjusting the distance of the print bed (Wu and Chen, Reference Wu and Chen2018). Moreover, if the first few layers are unsatisfactory, a common practice is the early termination of the 3D printing process (Grieser, Reference Grieser2015). Such human intervention adds uncertainty to the 3D printing process. Nevertheless, this problem can be solved by applying fuzzy methods.
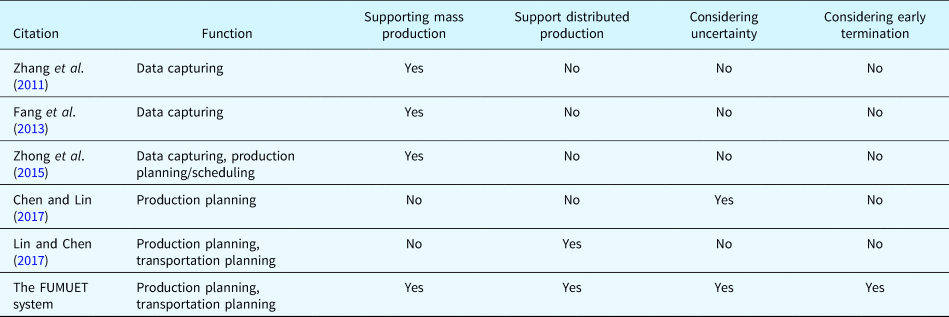
In this study, a fuzzy 3D printing-based UM system considering uncertainty and early termination – called UM system considering uncertainty and early termination (FUMUET) – based on a client–server architecture was established. The FUMUET system is used for obtaining the Internet of things solutions in manufacturing (Kim et al., Reference Kim, Ramos and Mohammed2017; Lee et al., Reference Lee, Jeong and Son2017) and provides location-based manufacturing services (Sun et al., Reference Sun, Chen, Hu, Qian and Hassan2017). On the client side, a customer uses a web-based interface to place an order for several pieces of a 3D object. On the system side, the central control unit of the system server receives and records the order and then searches the related databases to find available 3D printing facilities in the customer's vicinity. Subsequently, the order is distributed among the 3D printing facilities to minimize the cycle time. To consider the uncertainty, parameters, and variables in the proposed methodology, these factors are presented as fuzzy numbers. Fuzzy methods are receiving considerable attention in the field of recommendation systems (Giralt et al., Reference Giralt, Moreno-Garcia, Jimenez-Linares and Rodriguez-Benitez2017; Morawski et al., Reference Morawski, Stepan, Dick and Miller2017). Therefore, the FUMUET system optimizes a fuzzy mixed-integer linear programming (FMILP) model and a fuzzy mixed-integer quadratic programming (FMIQP) model for conducting production and transportation planning, respectively. To facilitate problem solving, the two fuzzy models are converted into equivalent crisp models. Moreover, a fuzzy slack is derived for each 3D printing facility to estimate any delays caused by early termination or restarting of the 3D printing process without violating the optimality of the original production plan. In this study, the FUMUET system was compared with selected UM systems, and the results are presented in Table 1.
Differences between the FUMUET system and the selected UM systems

Artificial intelligence (AI) has been widely applied in the production planning and scheduling of conventional manufacturing systems (e.g., Sarker et al., Reference Sarker, Essam, Hasan and Karim2016; Rahman et al., Reference Rahman, Sarker and Essam2017; Bao et al., Reference Bao, Zheng, Zhang, Ji and Zhang2018). This study represents a novel application of AI because it is the first attempt to plan a ubiquitous mass-production system based on 3D printing using AI techniques. The proposed methodology addresses not only the production planning of multiple distributed 3D printing facilities but also transportation planning through these 3D printing facilities.
The remainder of this paper is organized as follows. In the “Problem and Proposed Methodology” section, the architecture and operational procedures of the FUMUET system are introduced, the FMILP and FMIQP models for the production and transportation planning of the FUMUET system are proposed, and the two fuzzy models are converted into their equivalent crisp models to facilitate problem solving. In the “Regional Experiment” section, a regional experiment conducted in Taichung City, Taiwan, is described to illustrate the applicability of the FUMUET system and compare it with selected UM systems. Finally, in the “Conclusions” section, the experimental results are discussed, and concluding remarks are presented.
Problem and proposed methodology
The problem addressed in this study was to generate production and transportation plans for multiple 3D printing facilities, which collaborate to deliver customers’ orders, by considering the uncertainty of the printing time and early termination cases in order to minimize the makespan. Thus, the FUMUET system was established. The FUMUET system is a fuzzy system. The fuzzy input to the fuzzy system is the printing time of a 3D object. The fuzzy outputs from the fuzzy system include the available time of a 3D printing facility, the arrival time and leaving time of the freight truck, the completion time of a 3D object, and the cycle time of an order. All fuzzy parameters and variables are given in or approximated by triangular fuzzy numbers.
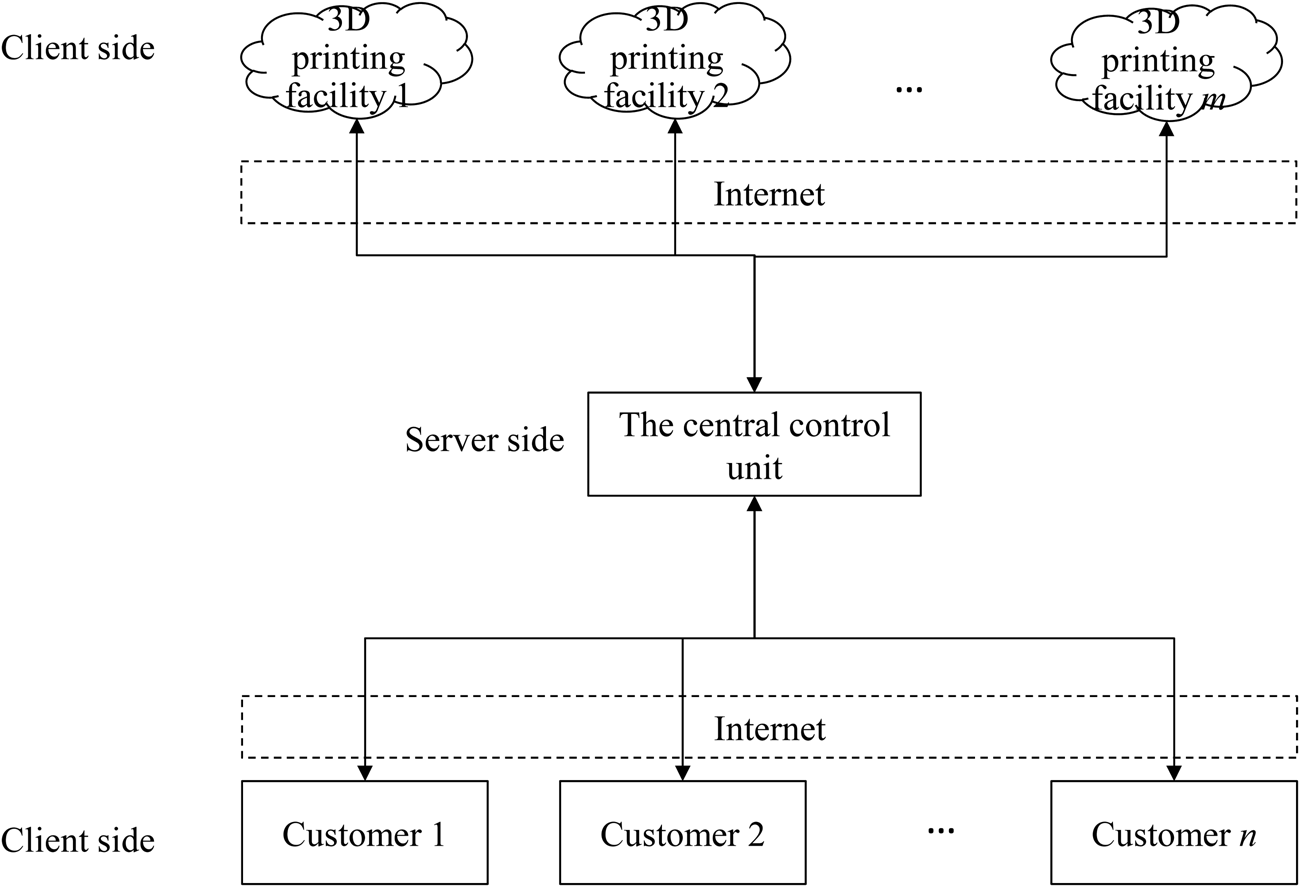
The FUMUET system is based on a compound client–server architecture (Fig. 1). The first client–server relationship is composed of the end customers (on the client side) and the central control unit (on the server side). The second client–server relationship is between the central control unit (on the server side) and the 3D printing facilities (on the client side). From the perspective of cloud computing, the system server serves as a cloud service provider that maps service requests from end customers to the services of 3D printing facilities.
Architecture of the FUMUET system.

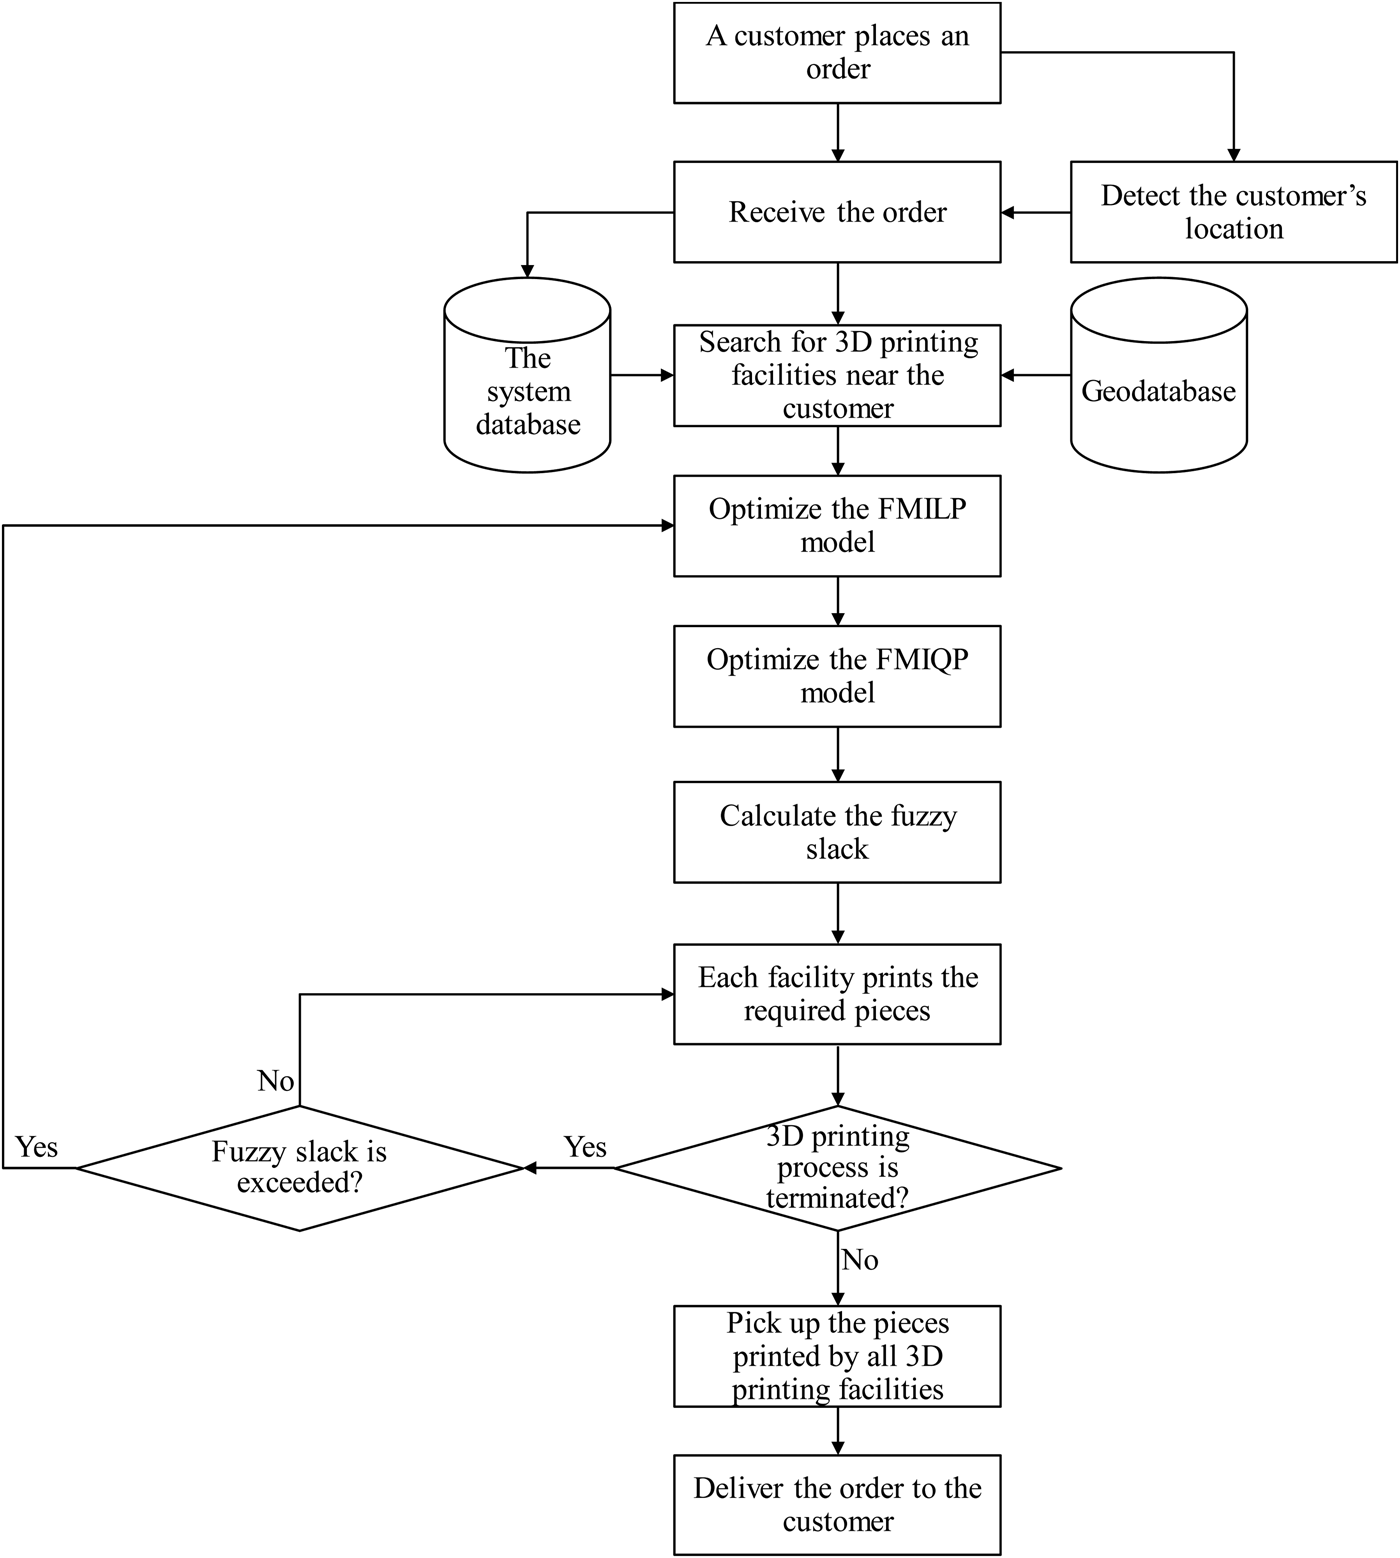
The operational procedure of the FUMUET system involves the following steps:
(1) A customer places an order for several pieces of a 3D object through a web-based interface.
(2) The system detects the location of the customer by accessing the global positioning system module on the smartphone used to place the order.
(3) The central control unit receives the order and records it on the system database.
(4) Based on the detected location of the customer, the central control unit searches a geodatabase of 3D printing facilities in the vicinity of the customer.
(5) The central control unit optimizes the FMILP model to distribute the ordered pieces among the available 3D printing facilities.
(6) The central control unit optimizes the FMIQP model to generate a delivery plan.
(7) The central control unit derives a fuzzy slack for each 3D printing facility.
(8) Each 3D printing facility starts to print the assigned pieces.
(9) If any 3D printing process is terminated early, proceed to step (10). Otherwise, proceed to step (11).
(10) If the corresponding fuzzy slack is exceeded, return to step (5) for reoptimization. Otherwise, return to step (8) to restart the 3D printing process in the same 3D printing facility.
(11) A freight vehicle visits each 3D printing facility to collect the printed pieces and deliver them to the customer.
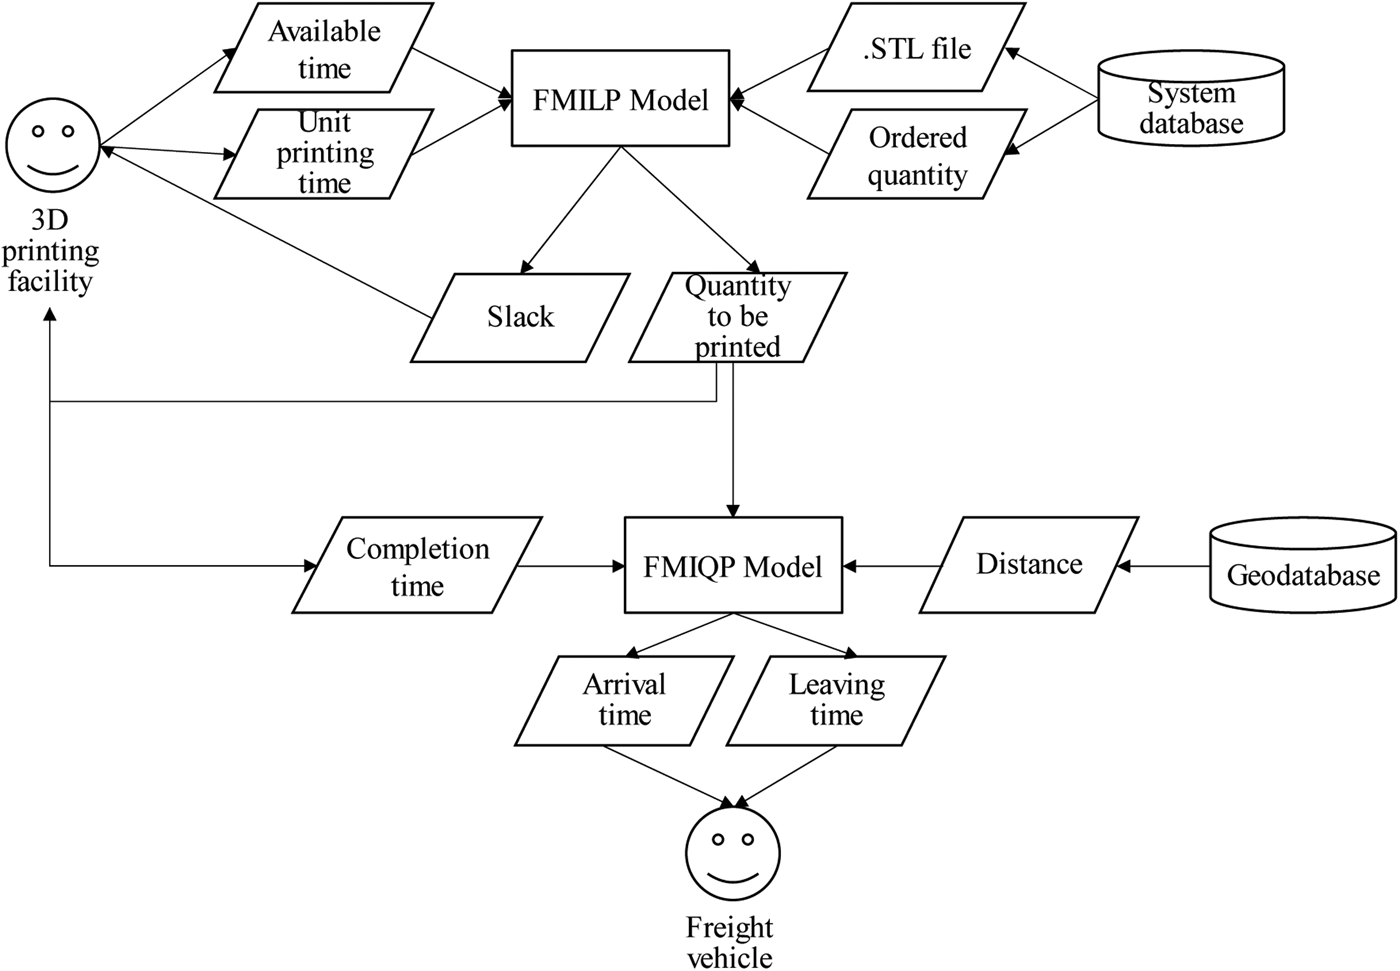
The relationships between these steps are illustrated in Figure 2. Two optimization problems must be solved: FMILP and FMIQP problems. The objective function of the FMILP model is to minimize the fuzzy makespan. The optimal solution of the FMILP model also provides slack information to determine whether an early terminated 3D printing process should be restarted. Based on the optimal production plan generated by the FMILP model, the FMIQP model prepares a transportation plan to collect the printed pieces as soon as possible. The scheduling mechanism of the proposed methodology is illustrated in Figure 3.
Relationships between the steps of the operational procedure.

Scheduling mechanism of the proposed methodology.

Subsequently, the variables and parameters used in the two models are defined as follows:
(1) i, j: the index of a 3D printing facility; ij means from 3D printing facility i to 3D printing facility j or between 3D printing facilities i and j.
(2) O: the origin and destination of the freight truck.
(3) $\tilde{a}$
 : the available time of the ith 3D printing facility; i = 1 ~ m. $\tilde{a}$ is uncertain because knowing the precise completion time of a piece that is currently being printed is difficult.
(4) d Oi: the shortest path length between O and 3D printing facility i; d Oi = d iO.
(5) d ij: the shortest path length between 3D printing facilities i and j; j = 1 ~ m; j ≠ i; d ij = d ji.
(6) n i: the number of pieces to be printed in the ith 3D printing facility.
(7) N: the number of pieces ordered.
(8) $\widetilde{{l_i}}$
: the time at which the freight truck leaves the ith 3D printing facility.(9) $\widetilde{{p_i}}$
: the time required to print a piece in the ith 3D printing facility. $\widetilde{{p_i}} = (p_{i1}\comma \,\;p_{i2}\comma \,\;p_{i3})$, and $\widetilde{{p_i}}$ is uncertain because of human-assisted operations.(10) $\widetilde{{r_i}}$
: the arrival time at the ith 3D printing facility.(11) t: the current time.
(12) X ij: a state variable. If the freight truck travels from 3D printing facility i to 3D printing facility j, X ij = 1. Otherwise, X ij = 0, where j = 1 ~ m and j ≠ i.
(13) X iO: a state variable. If the freight truck returns to O from 3D printing facility i, then X iO = 1. Otherwise, X iO = 0.
(14) X Oi: a state variable. If the freight truck travels from O to 3D printing facility i, then X Oi = 1. Otherwise, X Oi = 0.
(15) (+): fuzzy addition.
(16) (−): fuzzy subtraction.


FMILP model
Only the 3D printing facilities in the vicinity of the customer are considered. Distributing the ordered pieces among these facilities helps to avoid the starvation or congestion of any single facility. Thus, the number of pieces to be printed in each facility is determined by optimizing the following FMILP model:

where


Here, $\widetilde{{a_i}}\lpar \! + \!\rpar n_i\widetilde{{p_i}}$ is the (fuzzy) completion time of the ith 3D printing facility that prints n i pieces.
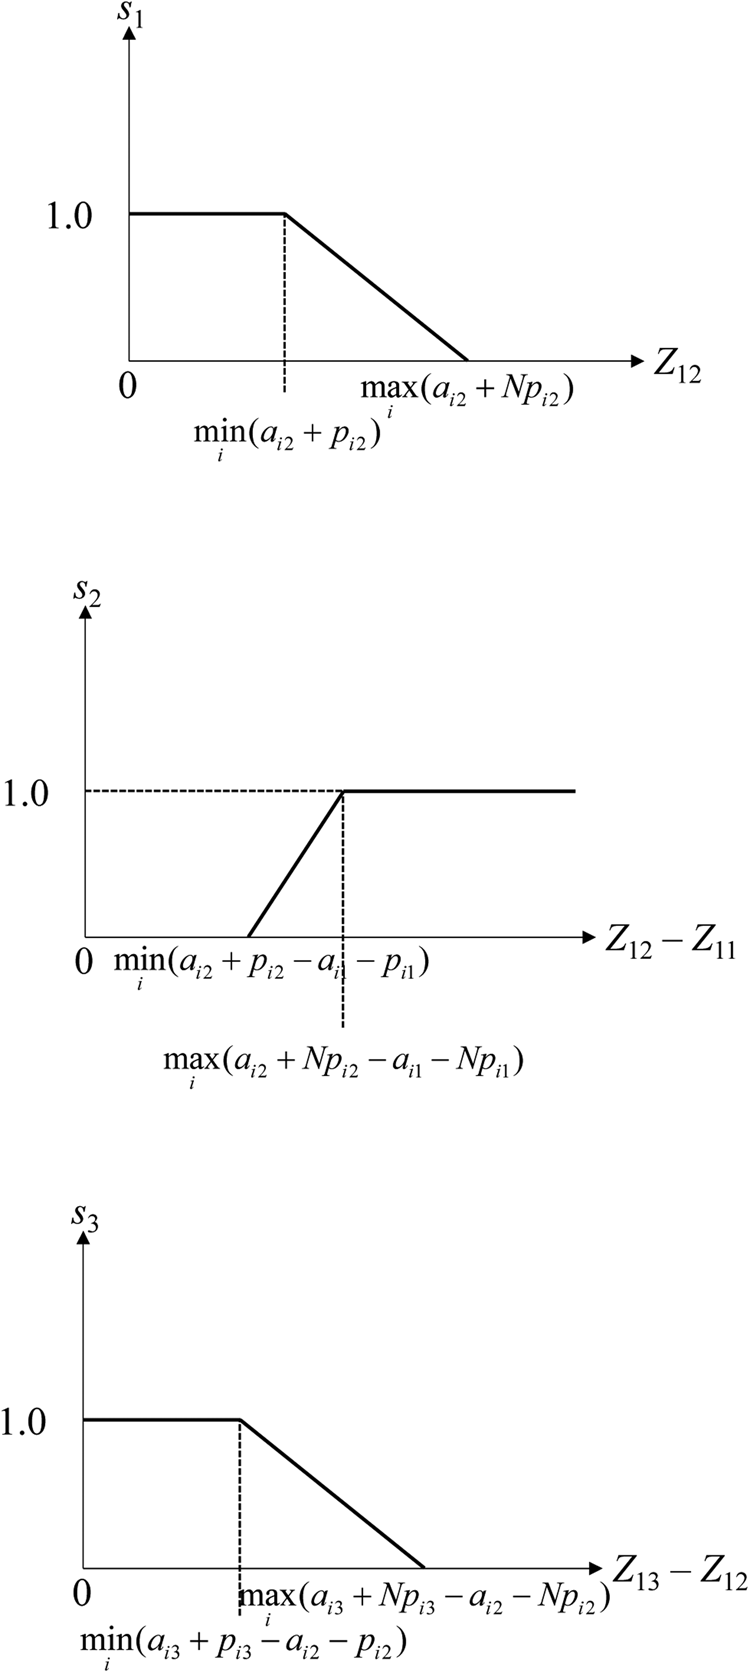
The objective function $\widetilde{{Z_1}} = (Z_{11}\comma \,\;Z_{12}\comma \,\;Z_{13})$ is to minimize the fuzzy maximal completion time, that is, the fuzzy makespan. In the literature, a variety of methods for dealing with a fuzzy objective function are presented. For example, Chen (Reference Chen2003) replaced a fuzzy objective function with its center of gravity (COG), which is a simple method and is effective in most applications. However, ties form easily when this method is used. Hsu and Wang (Reference Hsu and Wang2001) suggested replacing a fuzzy objective function with three crisp objective functions: minimizing the core (i.e., Z 12), maximizing the left tail (i.e., Z 12 − Z 11), and minimizing the right tail (i.e., Z 13 − Z 12). The desirable region for each objective function is specified in the form of a trapezoidal fuzzy number to evaluate the satisfaction level to be maximized. Subsequently, the three satisfaction levels can be easily aggregated. However, several subproblems of the FMILP problem must be solved, and thus, this method may not be efficient for online applications. Therefore, the method proposed by Hsu and Wang was simplified in this study by specifying the desirable regions subjectively without solving the subproblems.
The objective function (1) is converted into the following:

where


where s 1 is the degree to which the goal of the fuzzy objective function ($\widetilde{{Z_1}}$ ) is satisfied. Moreover, s 11, s 12, and s 13 indicate the degrees to which Z 12 is minimized, Z 12 − Z 11 is maximized, and Z 13 − Z 12 is minimized, respectively. The three desirable regions are illustrated in Figure 4.
Desirable regions.

Finally, the following mixed-integer linear programming (MILP) problem can be solved to derive the values of the fuzzy variables or parameters:

s.t.


Whether to restart an early terminated 3D printing process
Early termination of a 3D printing process is common if the initial result is unsatisfactory. This decision should be made as soon as possible, so that the process can be restarted immediately. However, in a collaborative manufacturing setting, after the early termination of a 3D printing process, the optimal production plan may change and the 3D printing process may need to be restarted in another facility. Thus, a critical piece of information that can be provided to each 3D printing facility is the answer to the following question: if a 3D printing process requires early termination, should it be restarted in the same facility? To analyze this question, a parameter analysis can be performed as follows.
Assume that the surpluses of Constraints (18)–(20) are represented by S i1 − S i3, respectively, for the ith 3D printing facility:


The optimality of the solution is not affected if $n_i^* p_{ik}$ is increased by at most S ik, which is expressed as follows:

S ik should be nonnegative. To ensure this,

Therefore, if the 3D printing process is subjected to early termination t i minutes after printing, it can be restarted in the same 3D printing facility if

Specifically,

Preparing the delivery plan
The pieces printed in various 3D printing facilities must be collected and delivered to the customer. This process relies on a delivery plan that is generated by solving the following FMIQP model:

s.t.


The objective function is to minimize the fuzzy cycle time determined using the leaving time of the freight vehicle from the most recently visited 3D printing facility. The arrival time of the freight vehicle at a 3D printing facility is determined based on the leaving time from the previous facility. If the freight vehicle travels from O, the arrival time is subject to Constraint (36). Otherwise, the time is subject to Constraint (37). Constraints (38) and (39) require that the leaving time should be greater than the arrival and completion times. The freight vehicle does not visit the same node more than once, as specified in Constraint (40). Each 3D printing facility has only one antecedent and one subsequent, as specified in Constraints (41) and (42). Constraint (43) guarantees that only one 3D printing facility is visited initially, whereas Constraint (44) guarantees that only one 3D printing facility is visited finally. This model is an FMIQP problem that must be converted into a tractable form to be solved (Chen and Lin, Reference Chen and Lin2018). Thus, the following theorems are helpful.
Theorem 1.

Proof.
$\widetilde{{Z_2}}$ comprises two times – production and transportation times. The production time is optimized and given as $\widetilde{{Z_1^*}}$
 . The transportation time comprises the time taken to travel to the first 3D printing facility, the travel time between any two of the n 3D printing facilities, and the travel time from the final 3D printing facility to O. The transportation time can be minimized as 0 + 0 + 0 = 0 or maximized using the following expression:

because d Oi = d iO. Therefore,

or

Thus, Theorem 1 is proved.
Based on Theorem 1, the fuzzy objective function is converted to the following:

where


Equation (35) is equivalent to

Constraint (36) can be met by

Similarly, Constraints (37)–(39) can be replaced by the following equations, respectively:


and

Finally, the following mixed-integer quadratic programming (MIQP) problem is solved instead of the original FMIQP problem:

where


Regional experiment
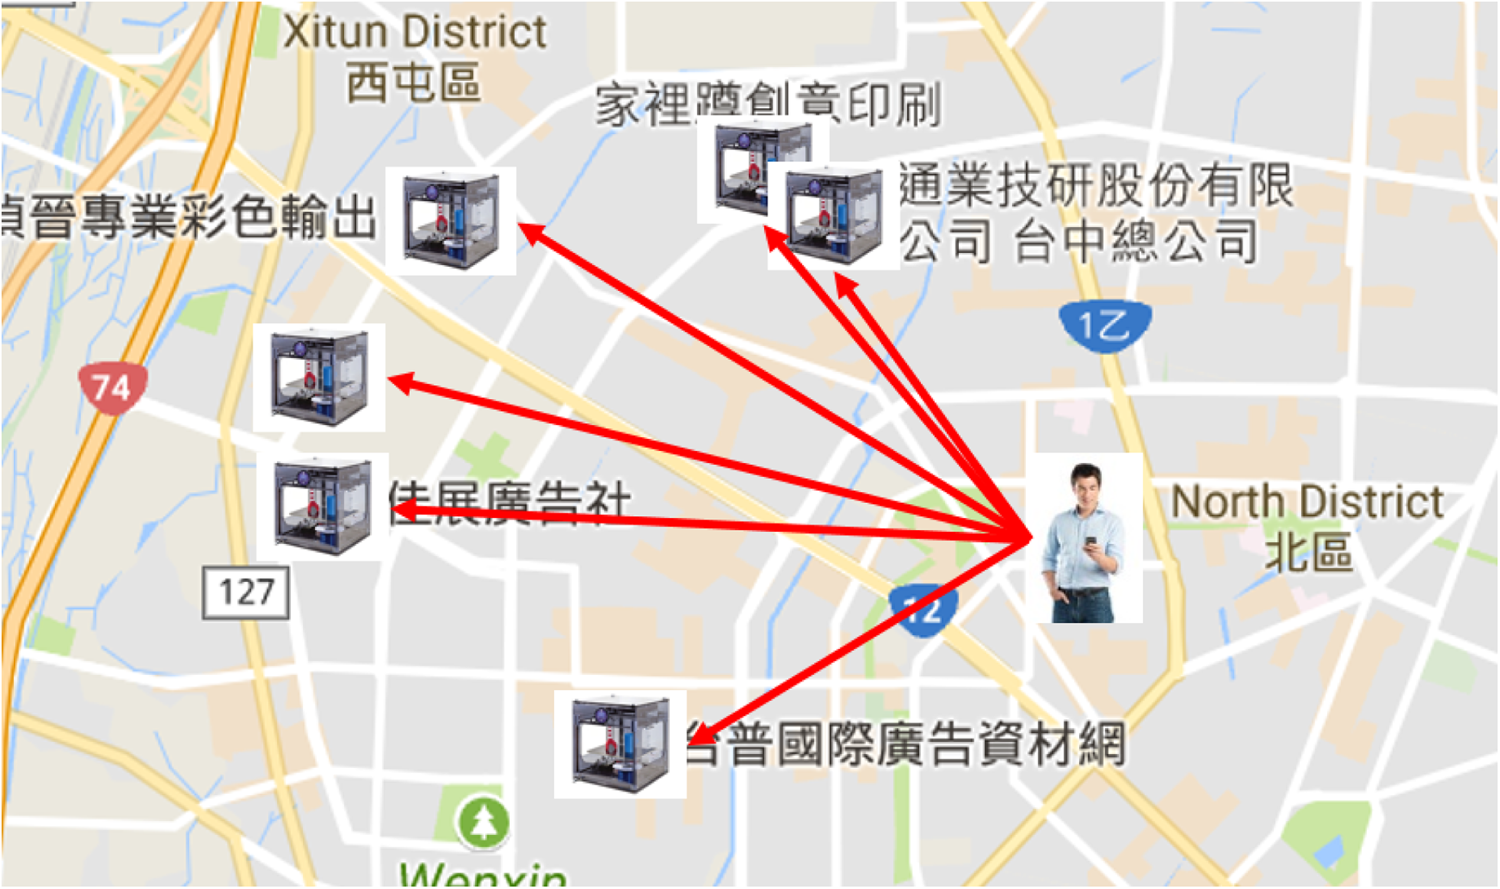
The effectiveness of the FUMUET system was examined by conducting a regional experiment in Taichung City, Taiwan, as illustrated in Figure 5. In the regional experiment, a customer browsed an online catalog, placed an order for several pieces of an action figure, and made the required payment. The order was recorded on the system database. Subsequently, the central control unit of the system server searched a 3D printing facility database and a geodatabase to find 3D printing facilities in the vicinity of the customer to collaboratively deliver the order. To minimize the cycle time for the delivery of each order, the FMILP and FMIQP models were optimized to determine the number of pieces assigned to each 3D printing facility and to create the optimal transportation plan for collecting the printed action figures.
Regional experiment.

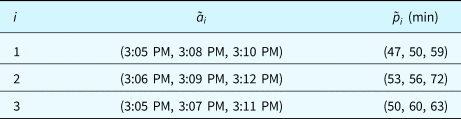
In total, five customers were involved in the regional experiment. The first customer is used as an example in this section. The customer placed an order for five pieces of a 3D object at 3:05 PM. The customer's location was detected to be (24°10′05.7″N, 120°39′55.7″E), and three 3D printing facilities were found in the vicinity of the customer. The data of the 3D printing facilities are summarized in Table 2.
Illustrative example

First, the MILP model was developed and optimized for the customer. The optimization result was $s_1^* = 0.348$ and $\tilde{Z}_1^* = (100\comma \,122\comma \,132)$
 when $(n_1^*\comma \, n_2^*\comma \, n_3^* ) = (2\comma \,1\comma \,2)$
 . In other words, the required pieces could be printed before 4:45, 5:07, and 5:17 PM. Knowing whether the consideration of uncertainty yielded a different result was determined to be useful. Therefore, this case was analyzed using a crisp method in which all types of uncertainty were removed. The optimization result was $Z_1^* = 116$
 when $(n_1^*\comma \, n_2^*\comma \, n_3^* ) = \lpar {2\comma \,2\comma \,1} \rpar$
 . Naturally, the consideration of uncertainty altered the optimization result.
The surplus of each of the three 3D printing facilities was calculated using Equations (38) and (40) as follows:
S 11 = max(100.00−0−2 * 47, 0) = 6
S 12 = max(138.38−3−2 * 50, 0) = 35.38
S 13 = max(152.99−5−2 * 59, 0) = 29.99
t 1 ≤ min(6, 35.38, 29.99) = 6
S 21 = max(100.00−1−1 * 53, 0) = 46
S 22 = max(138.38−4−1 * 56, 0) = 78.38
S 23 = max(152.99−7−1 * 72, 0) = 73.99
t 2 ≤ min(46, 78.38, 73.99) = 46
S 21 = max(100.00−5−2 * 50, 0) = 0
S 22 = max(138.38−7−2 * 60, 0) = 11.38
S 23 = max(152.99−6−2 * 63, 0) = 20.99
t 3 ≤ min(0, 11.38, 20.99) = 0
The results revealed that in the first 3D printing facility, printing could be restarted in the same facility only when the 3D printing process was terminated almost immediately (i.e., within 6 min) after printing. The original solution was still optimal. By contrast, the second 3D printing facility could restart a 3D printing process that was terminated within 46 min after printing without violating the optimality of the original solution. However, such flexibility did not exist in the third 3D printing facility. In this case, the printing processes in all three facilities were completed successfully by 5:12 PM.
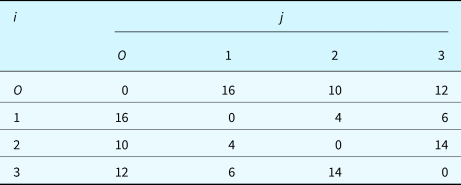
The distance between the locations for each location pair was estimated using Google Maps. The results are summarized in Table 3.
Distance between locations for each location pair

Subsequently, the MIQP model was developed and optimized for the customer. The optimal objective function value was $s_2^* = 0.5$ and $\tilde{Z}_2^* = (112\comma \,134\comma \,144)$
 when the transportation plan was O → 2 → 1 → 3 → O, indicating that the printed objects could be delivered to the customer before 4:57, 5:19, and 5:29 PM, respectively. For comparison, the crisp method was applied to this case. The optimal cycle time was $Z_2^* = 126$
 , indicating that the printed objects could be delivered to the customer by 5:11 PM. The accompanying transportation plan was O → 3 → 1 → 2 → O. In this case, the order was delivered to the customer at 5:28 PM.
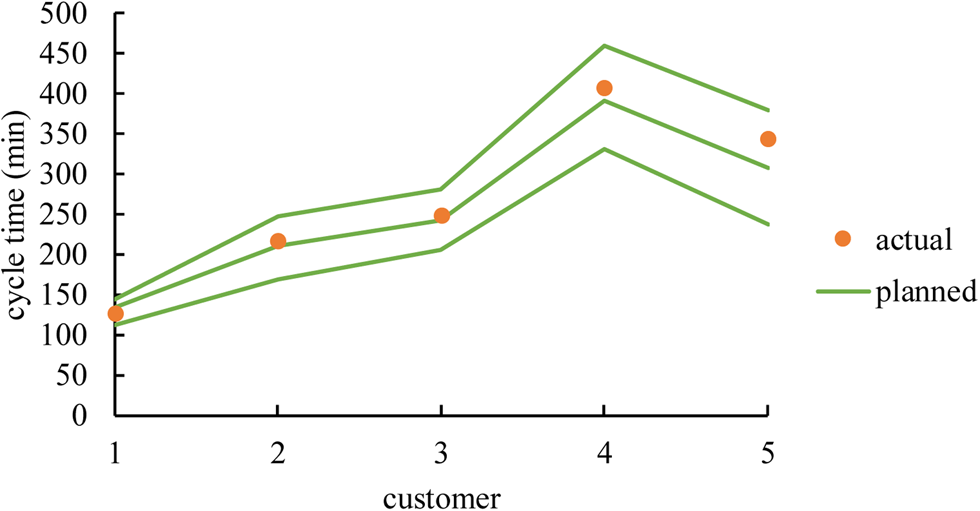
The planning results obtained using the proposed methodology for the other customers in this study are summarized in Table 4 and are compared with the actual outcomes in Figure 6.
Results of applying the proposed methodology to the other customers in this study

Comparison of the results obtained using the proposed methodology with the actual outcomes.

Based on the experimental results, the following results were obtained:
(1) In general, all the actual outcomes conformed to the planning results because all the actual cycle times were contained in the corresponding fuzzy cycle times.
(2) The 3D printing process for the third customer in the fourth 3D printing facility was terminated early 24 min after printing, which was less than the slack (i.e., 79 min). Therefore, the early terminated 3D printing process was restarted in the same 3D printing facility.
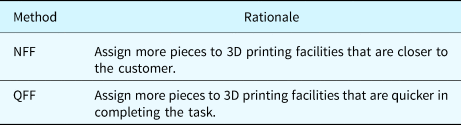
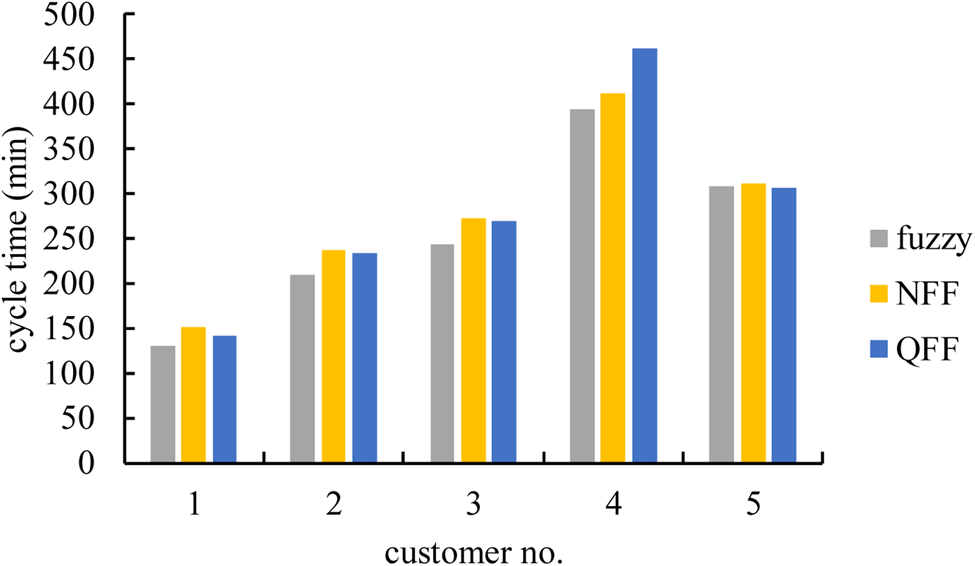
(3) To further elaborate on the effectiveness of the proposed methodology, two existing methods, namely nearest facility first (NFF) and quickest facility first (QFF), were applied to the collected data. The rationales behind the two existing methods are explained in Table 5. Subsequently, the cycle times achieved using the various methods were compared, as illustrated in Figure 7. To facilitate the comparison, the fuzzy cycle time was defuzzified using the COG. The proposed methodology was superior to the two existing methods by 7% and 9% in terms of shortening the average cycle time. Thus, the effectiveness of the proposed methodology was supported.
Rationale behind the two existing methods

Cycle times achieved using the various methods.

Conclusions
Employing 3D printing to build an UM network is a considerable challenge for researchers and practitioners in the manufacturing sector and is subject to complications such as human-induced uncertainty and early termination. To address these problems, this study established a FUMUET system that considers uncertainty by defining fuzzy-valued parameters and derives slack to determine whether an early terminated 3D printing process should be restarted in the same 3D printing facility. To minimize the cycle time for delivering an order, the FUMUET system optimizes two models, namely the FMILP and FMIQP models, to distribute the ordered pieces among 3D printing facilities and plan transportation for the collection of the printed pieces.
The proposed methodology was tested in a regional experiment, and the following observations were made:
(1) The proposed methodology was successfully shortened the average cycle time by optimizing the relevant operations. The proposed method was superior to the two existing methods by less than or equal to 9%.
(2) The fuzzy cycle time was estimated using the proposed methodology provided valuable information on the longest possible cycle time that should be communicated to the customer.
(3) Another valuable piece of information provided by the proposed methodology is the slack information that can enable each 3D printing facility to make real-time online decisions regarding whether an early terminated 3D printing process should be restarted.
However, the proposed methodology also has limitations:
(1) The study assumed that the participating 3D printing facilities can achieve the same quality level. Otherwise, the overall quality of the printed pieces cannot be guaranteed, which will discourage customers from using the UM network.
(2) The pricing policies of different 3D printing facilities may not be the same, and this must be considered before the assignment of pieces to the 3D printing facilities.
Further experimentation is required to more accurately ascertain the effectiveness of the proposed methodology. In future studies, advanced algorithms can be designed to efficiently solve the FMILP and FMIQP problems.
Tin-Chih Toly Chen received the PhD degree in industrial engineering from National Tsin Hua University. He is now a Distinguished Professor in the Department of Industrial Engineering and Management at National Chiao Tung University. His research interests include fuzzy and neural computing, competitiveness analysis, cloud manufacturing, operations research, semiconductor manufacturing, and ambient intelligence. Dr. Chen has published over 100 papers in refereed journals and is the recipient of several research and paper awards. Dr. Chen is the founding editor of the International Journal of Fuzzy System Applications and the founding president of Ambient Intelligence Association of Taiwan. He has been the editor or guest editor of journals including Fuzzy Sets and Systems, Journal of Intelligent Manufacturing, International Journal of Advanced Manufacturing Technology, International Journal of Technology Management, Robotics and Computer-Integrated Manufacturing, and International Journal of Intelligent Systems.