


Introduction
In this paper we investigate the relative motion between the surface and the bed near Upstream B camp (UpB) on Ice Stream B, WestAntarctica, by the radar fading-pattern method.
When an electromagnetic wave impinges on a surface, the amount of energy returned from that surface depends on the "roughness" or "texture" of the surface on size scales of the order of the wavelength of the incident electromagnetic wave, as well as on the reflectivity of the surface. Returns from different facets of the rough surface have different phase shifts, so they combine to give an interference pattern. In radar sounding of ice sheets, the radar signal returned from the targets in and/or at the bed of the ice is therefore a distorted version of the outgoing pulse that changes rapidly from place to place on the ice-sheet surface. If a transmitter and a receiver are moved laterally together, the time delay of the onset of the echo, being determined by the range, changes slowly; in contrast, the form of the returning signal, being determined by an interference pattern, changes very quickly. This change in form is called the spatial fading pattern. Because the fading pattern is essentially fixed in space relative to the scattering surface, repeated measurements of the fading pattern can reveal the relative displacement between the snow surface and the targets in ice.
The technique of measuring the relative ice velocity from the fading pattern was initially suggested by Reference Nye, Kyte and ThrelfallNye and others (1972) and demonstrated by Reference WalfordWalford (1972) on Fleming Glacier, Antarctic Peninsula. Later it was successfully applied by Doake, again on Fleming Glacier (Reference DoakeDoake, 1975), with a non-digital radar system. The same technique was applied with a digital radar system on the ice plain downstream of Ice Stream B (Reference Bentley, Retzlaff, Lord and NovickBentley and others, 1991).
The present work was based on a digital radar system equipped with an automated positioning device that provided an improvement in both efficiency and accuracy over previous methods of positioning. A full discussion of this work has recently been completed (Reference LiuLiu,1999) and a more extensive paper is in preparation.
Principle
Fading pattern and ice-bed-motion models
To understand what the fading-pattern measurements might reveal, we consider three models of the characteristics of the bed, the ice-bed interface and the ice itself.
A perfectly rigid bed neither moves nor changes its shape. Ice deforms around irregularities in the bed; the fading pattern, formed by interface scattering and perhaps also volume scattering from the bed, is fixed relative to the bed and moves relative to the surface, so the fading-pattern movement will reflect the total velocity vector. A rigid bed is not generally realistic on Ice Stream B, but might exist under "sticky spots"; such regions could contribute importantly to the force balance on the ice stream, even if they make up only a small areal fraction of the bed.
The opposite conceptual extreme is a perfectly weak bed, one that does not itself move except to deform around irregularities in the base of the passing ice. In this case, the fading pattern is fixed relative to the base of the ice and moves relative to the surface only by the amount of internal deformation in the ice.
An intermediate bed is one at and in which motion takes place by a combination of ice deformation, bed deformation and sliding; conceptually, the three could be of any relative importance.
In a real mobile bed, differential motion presumably extends into the bed on a scale equal to, or a few times larger than, the basal roughness height. The fading pattern moves with the interface unless there is radio-wave penetration into the bed. In that case, diffractions from sources below the surface might be seen to move relative to the main fading pattern.
Factors affecting the fading pattern
There are several factors, both bed-related and instrumental, that could affect the fading pattern. We treat them as follows.
England debris
We assume that the basal ice is clean, because of continuous melting from the base of the ice. Drilling on Ice Stream B has not encountered rock in the ice (personal communication from H. Engelhardt, 1998) and we have observed no diffraction hyperbola with an apex in the ice despite extensive radar profiling at UpB.
Intervening water layer
A water layer between the ice base and the subglacial sediments could affect the reflection. Drilling at UpB showed that the water layer is 2-4 mm thick, and resistance measurements between probes 20 m apart suggested a resistivity of at least 100 Sim in the top few meters of the bed (Reference KambKamb, 1990; Reference Engelhardt and KambEngelhardt and Kamb, 1997). This, for a material with a measured porosity of about 40%, implies a pore-water resistivity of about 10 Ωm; more, if clay minerals produce a substantial fraction of the conduction in the bed. If the water has a resistivity of 10 Sim and a relative permittivity of 80, the skin depth is about 0.22 m (Reference Shabtaie, Whillans and BentleyShabtaie and others, 1987). Thus, in most places the radar pulse will pass through the water film with little change.
Penetration
Penetration into the subglacial sediments affects the waveform of a returned signal because volume scattering is involved, in addition to the surface scattering. For sediments with 40% porosity saturated with groundwater, as underneath Ice Stream B, the loss tangent at the 50 MHz operating frequency of our radar system is about 0.5. The corresponding skin depth is about 0.36 m; we may consider, then, that the scattering takes place in a boundary zone a few tenths of a meter thick.
Instrumental instability
Because the wave path contains a large number of the wavelengths, the fading pattern is very sensitive to any change in carrier frequency and length of the transmitted pulse. The transmitter used for the present research is based on L-C circuitry whose frequency is stable with respect to the ambient temperature; furthermore, the temperature in the wanigan housing the radar system was not allowed to change widely while the system was in use, because the digitizer would not work properly in the cold. The transmitted pulse length also was stable except for a few times when some connectors between the transmitter and antenna were loose. Data from those times are not included in the present dataset.
Antenna-positioning error
There is an antenna-positioning error (about 0.5 m) that arises from changes in the distance between the positioning device and the antenna (the rope used to tow the antenna sled could stretch, and the positioning device was remounted during the field season). Minimizing error along the profile direction in the antenna positioning is crucial for determining the relative ice motion. In the present study, two sets of specially designed positioning systems (positions of the antenna were marked manually and with a microwave motion sensor) and the effects of buried crevasses were all used to minimize the error and are described below.
Lateral displacement of the antenna will also cause error in movement rates because the fading pattern changes significantly over distances of just a fraction of the radar wavelength (3.4 m). Profiles on opposite sides of line 90, grid 1, for which the centers of the antennas were about 3.5 m apart, yielded mostly different fading patterns. Here we assume that the lateral displacement of the antenna is not large enough to cause major changes in the shapes of fading patterns, although we believe small lateral displacements are a significant source of error.
Data Collection and Process for Fading-Pattern Experiment
Grid set-up and data acquisition
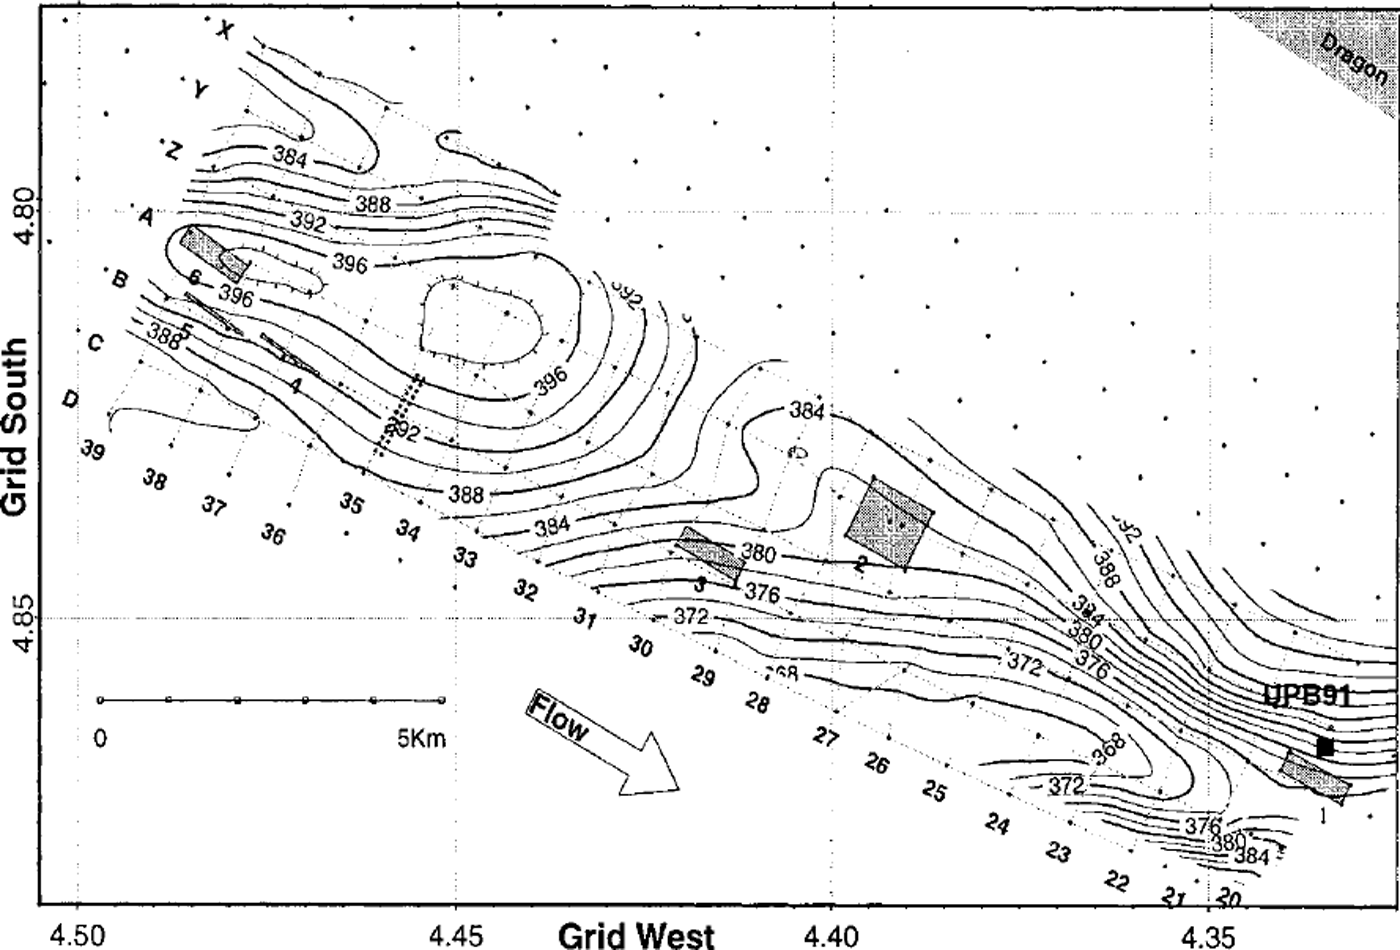
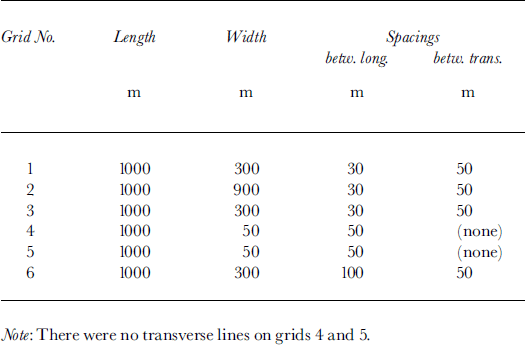
The data were collected on six rectangular grids during the 1991-92 field season. All six grids (Fig. 1; Table 1) were aligned approximately along the ice flow, based on global positioning system velocity measurements (Reference Hulbe and WhillansHulbe and Whillans, 1994). The ice thickness is nearly constant at a little over 1000 m across Figure 1 (Reference LiuLiu, 1999), and the ice velocity is about 430 m a−1 (Reference Hulbe and WhillansHulbe and Whillans, 1997).
Locations of Jading -pattern grids. The grids are the gray boxes numbered 1-6. The surface elevation contours (from Reference Hulbe and WhillansHulbe and Whillans, 1994) are in meters above the World Geodetic System 1984 ellipsoid. The grid coordinates are relative to an origin at the South Pole with north towards Greenwich.
Specifications of grids for fading-pattern experiments at UpB
The radar system, housed in a wanigan, was pulled by a Tucker Sno-Cat at a speed of approximately 8 km h−1 (the slow speed was to avoid echo-trace loss). The echo was digitally sampled and recorded in two sets: the in-phase (I) and the quadrature (Q) components. The amplitude and phase data can be reconstructed from the I and Q. components.
Position control was extremely important for this experiment. Bamboo stakes were emplaced, using a laser distance-measuring instrument ("Geodimeter") and a steel tape, at intervals of 10 m along the lines to be profiled. To measure position along the survey lines and trigger the radar transmitter, an automated system was used. The positioning system included a micro-controller with a trailing bicycle wheel, which triggered a burst of 128 pulses from the radar transmitter every 0.7 m; a highly directional microwave motion sensor, which was pointed sideways to detect the bamboo stakes placed along the survey lines; and a manual event button that allowed the operator to note all stakes and any additional events of importance on the digital record.
Data Processing
The data processing included determining the position of each trace, resampling to provide uniform spacing, and comparing fading patterns from different times.
Data resampling
The amplitude data were resampled because trace spacing was not constant for three reasons:
-
(a) The spatial interval between outgoing pulses was not constant through the whole season and at different locations, because changing surface conditions affected bicycle-wheel tracking.
-
(b) Instrumentally, one trace was lost when a flag was marked digitally with the event button.
-
(c) Occasionally, one or more traces were lost or not recorded completely because the whole system moved too fast, or was jarred by surface irregularities, such as sastrugi.
To minimize errors caused by those factors, and also to facilitate analytical comparison of fading patterns, the original recorded amplitude and phase were resampled at a constant spatial interval by interpolation between adjacent traces.
Analytical pattern comparison
Because we do not expect significant vertical motion of the fading pattern during the profiling period (at most 38 days), a one-dimensional comparison was applied to estimate the horizontal motion of fading patterns along the profiles. We performed cross-correlation analysis on small horizontal sections of a profile, usually 50 m long, to estimate displacements.
The dispacement was taken to be the lag, Δy, at the maximum value of the unbiased correlation coefficient, ρ c, defined as

where xi
and yi
represent the ith values of bed-echo (or internal-echo) strength at two different epochs, i is the index for the successive resampled data within the window, and
 and
 are the means of xi
and yi
over the window.
Use of crevasses for position-error removal
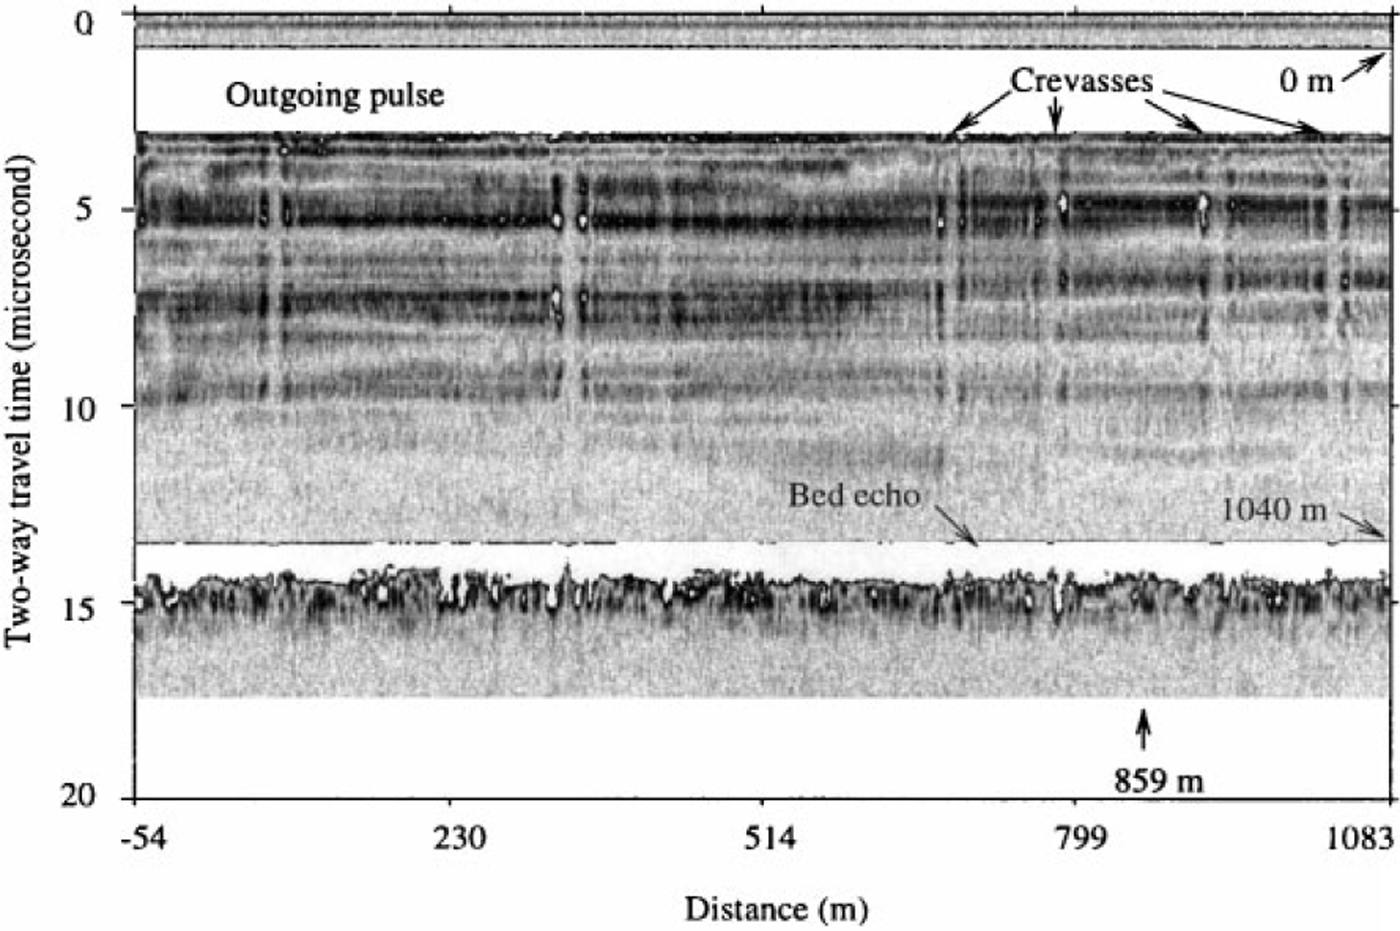
Although the positions of flags were measured, some position errors still remain. Near-surface crevasses block the transmitted energy and produce vertical stripes across the radargrams (see Fig. 2). We used a cross-correlation lag analysis of the (stationary) crevasses to reduce positioning errors still further, by forcing that lag to equal zero.
Radargram from a line on grid 3 that shows energy blockage by near-surface crevasses. The abscissa gives the distance grid northwest of an arbitrary zero point within the grid. The white band at 1–3 μs is is the outgoing pulse, which saturates the receiver; the white band at 13–15 μs is the bed echo, which did not saturate the receiver. Both bands are saturated in this plot because the gain is set high to show the internal layers clearly.
Mapping the area covered by grids
After position errors were reduced as much as possible and the data in areas affected by near-surface crevasses were discarded, fading-pattern movement rates of the bottom echoes were calculated to give our final results.
Results of the Relative Motion and Discussion
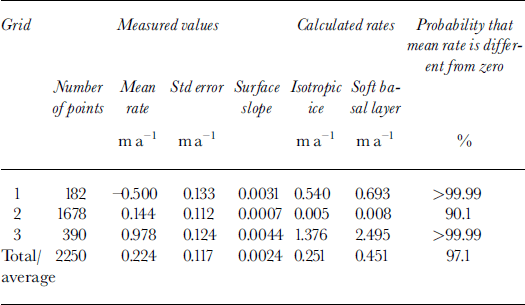
The relative displacements between the bed and the snow surface, together with the associated statistics, were calculated for each time interval on each grid (Table 2). (For comparison purposes, we include inTable 2 the results from a set of transverse lines (designed at grid 3T), to show that the indicated speeds do not differ significantly from zero.) Table 2 shows that the standard errors for grids 4 and 5 are much larger than for the other grids. Grids 4 and 5 were in a region with no buried crevasses that could be used for position control, so relatively large positioning errors probably remain. Measurements on grid 6 covered a period of only 6 days, too short to yield a significant result. We therefore limit our further analysis to grids 1-3.
Relative displacements between the bed and the surface and associated statistics. A positive displacement indicates that the bed is moving more slowly than the snow surface a
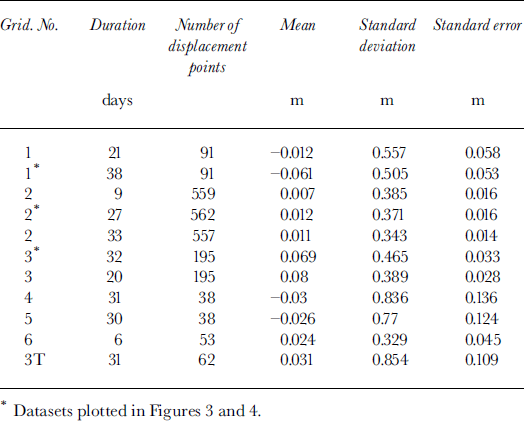
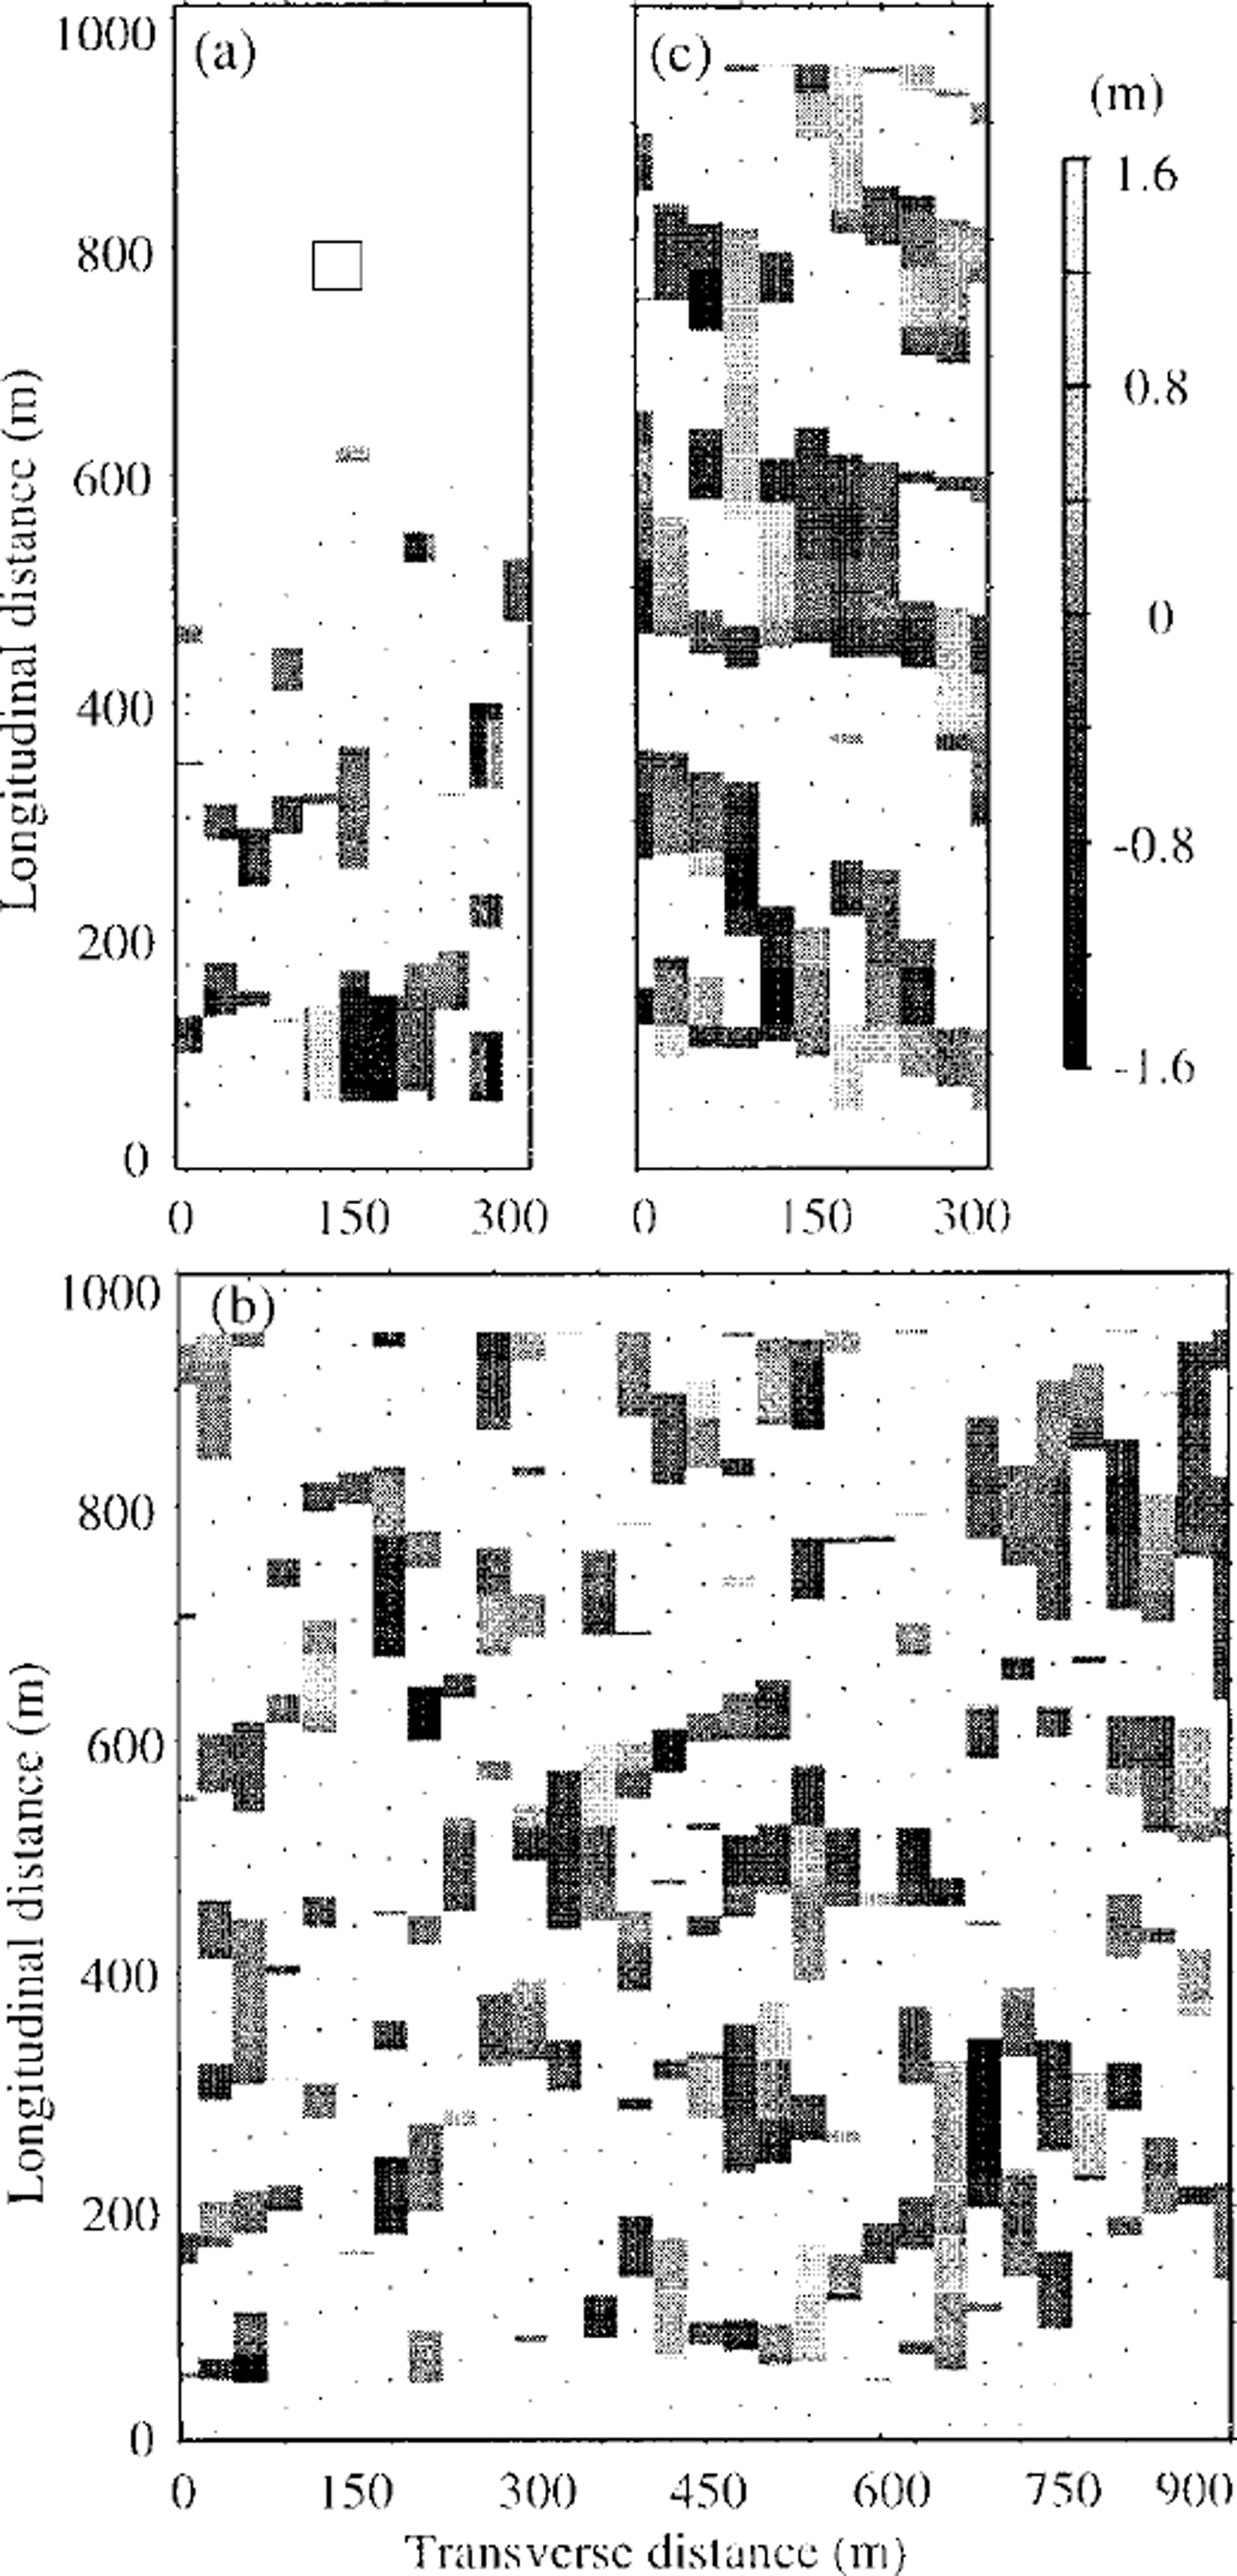
Figure 3 shows maps of one set of movement rates for each of those grids. The upstream half of grid 1 appears blank in Figure 3 because the radar returns were heavily affected by hot-water drilling; only the downstream half gave useful results.
Relative displacements between the surface and the bed. Areas without useful movement measurements are in white. Black dots show centers of the energy blockage by near-surface crevasses, (a) Grid 1. Measurements on 11 longitudinal profiles over 38 days. The square represents the hot-water-drill site, ( b) Grid 2. Measurements on 31 longitudinal profiles over 27 days, (c) Grid 3 Measurements on 11 longitudinal profiles over 32 days.
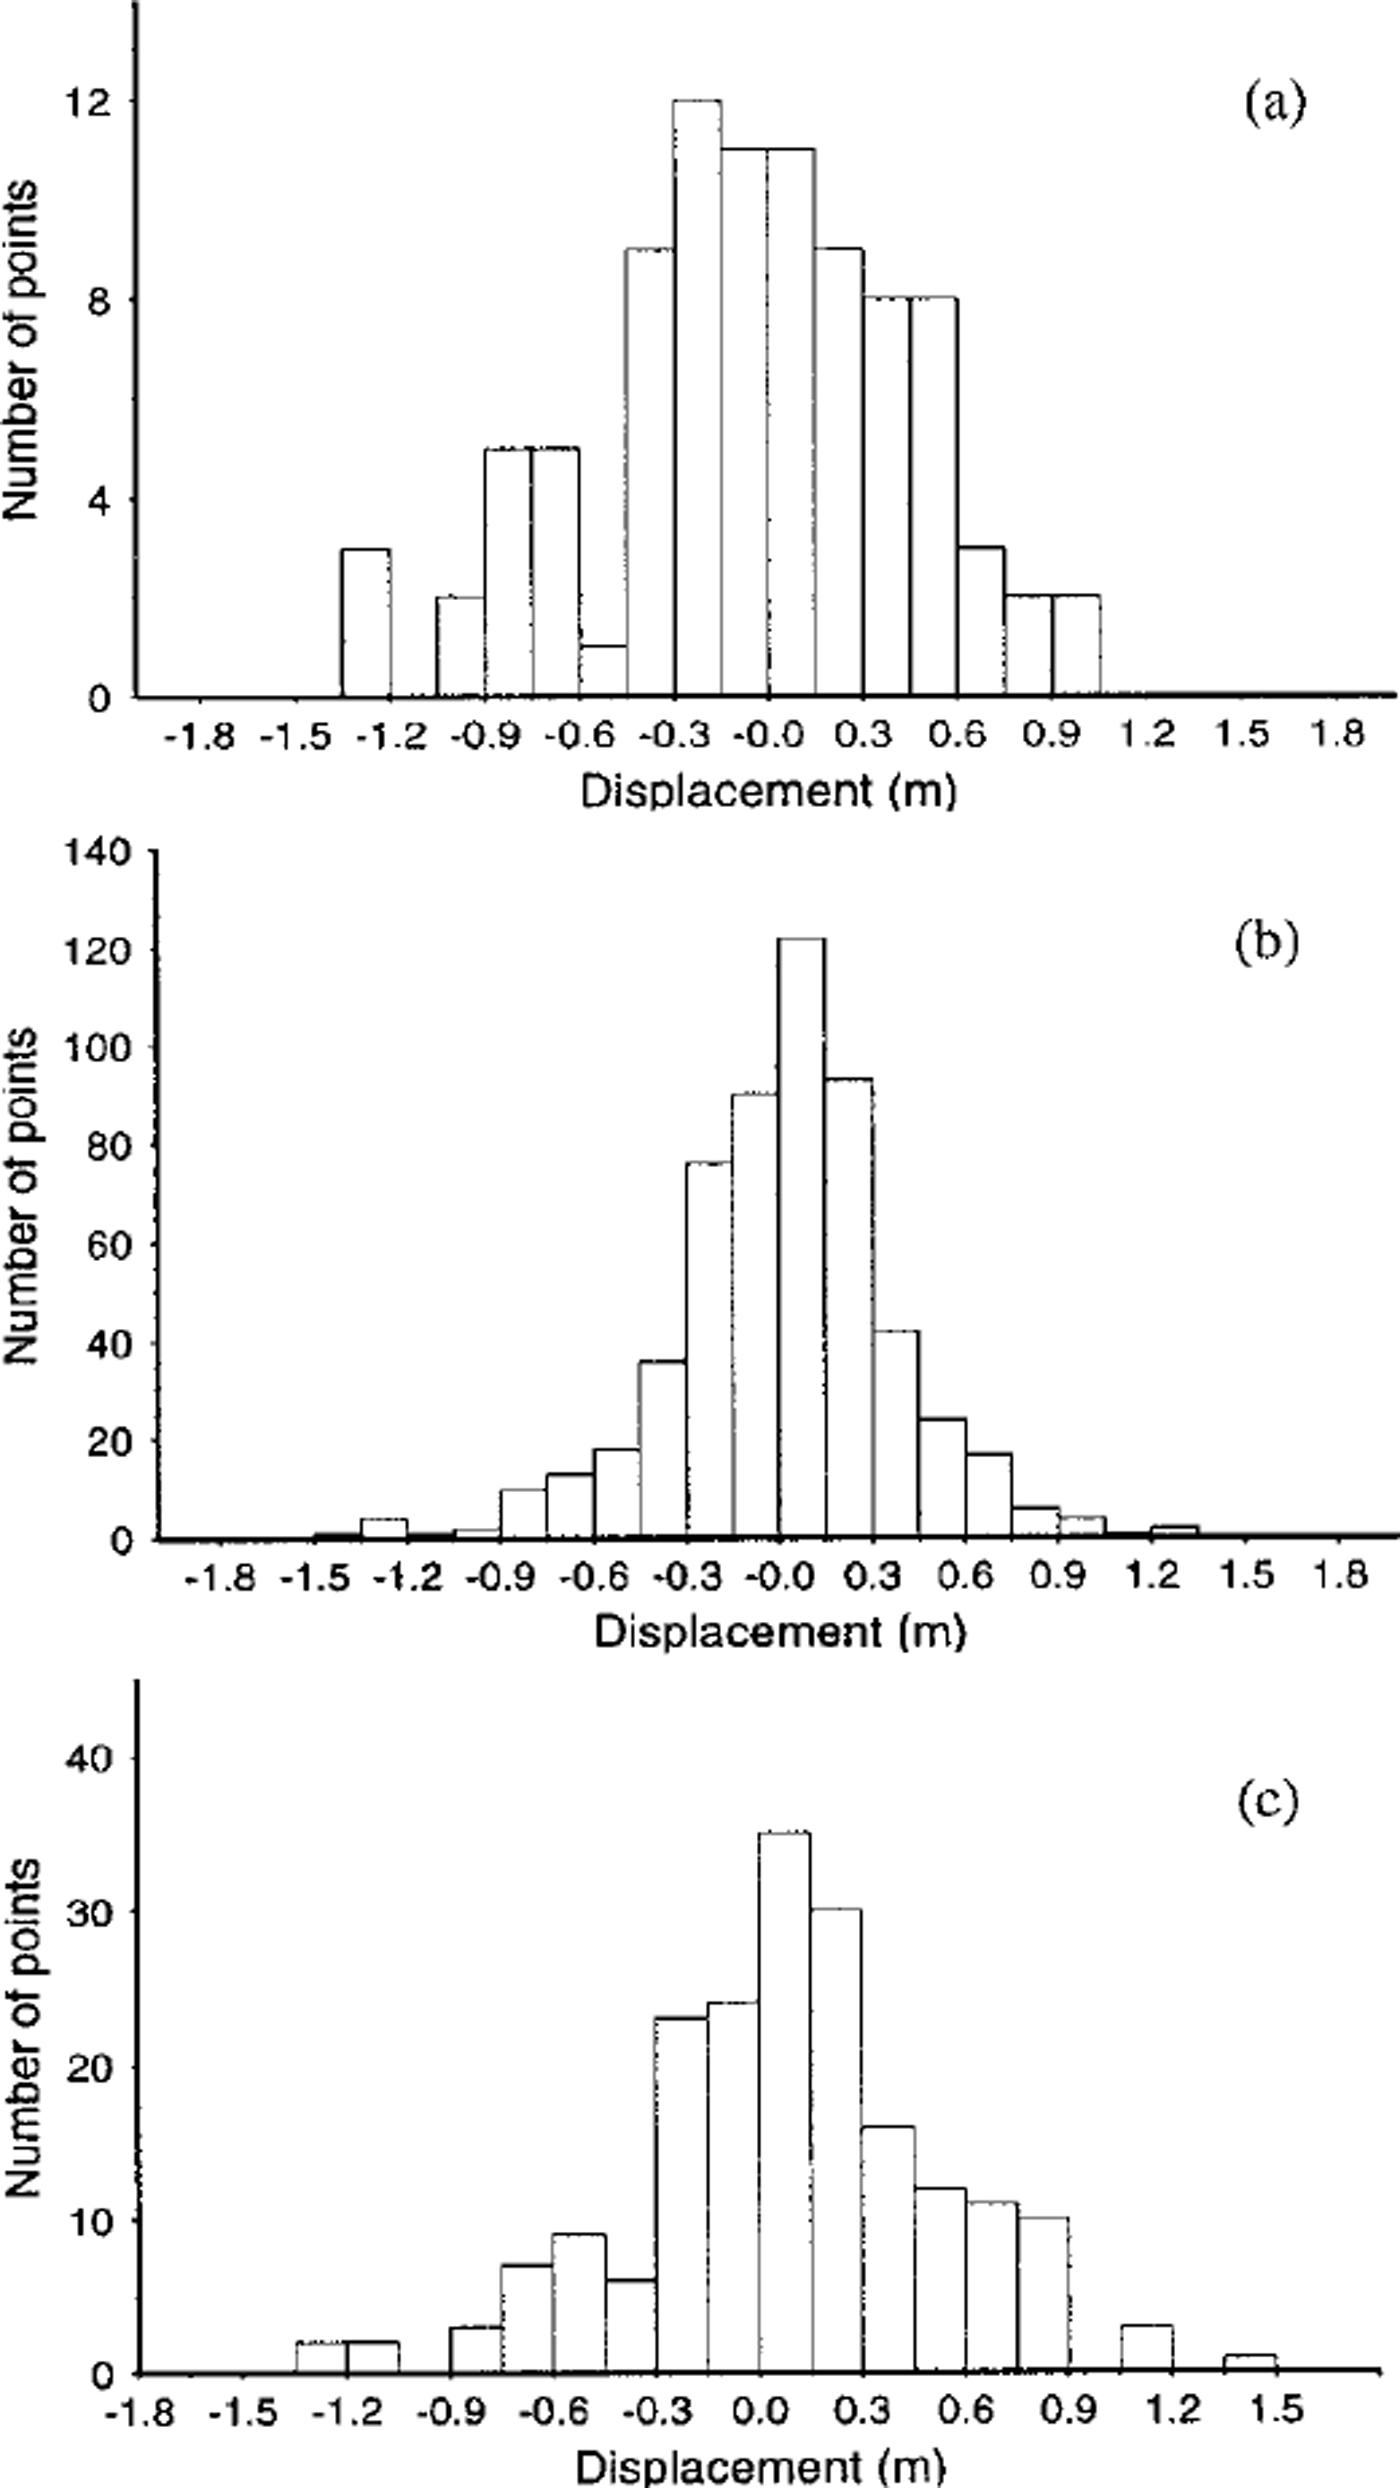
The values of displacement appear to have near-normal distributions (Fig. 4), so we treat the spread in values for each grid as arising from random errors, presumably due to two-dimensional mispositioning. (A study of changes in ρ c with time revealed no systematic trend, such as might be associated with temporal changes in the basal diffracting zone.) We can then apply standard statistics. We assume that the actual differential motion is a constant across each grid, but not necessarily the same for each grid. This allows us to treat each 50 m comparison as an independent measurement of displacement. We then apply linear regression analysis to each grid; the slope of the regression line gives the indicated differential motion between the surface and the bed. We also obtain a standard error of estimate of the slope, from which we can calculate the probability, p, that the slope is different from zero.
Histogram of relative displacements between the surface and the bed shown in Figure 3 (a) Grid 1, (b) grid 2, ( c) grid 3 The statistics are given in Table 2 and 1 m a−1, respectively. Are these believable results? To address this question we calculate what deformational motion we might expect.
The results are given inTable 3 and depicted in Figure 5. In Figure 5a we show all the 2250 individual measurements; despite the strong overlap the sense of the distribution of points is clear. In Figure 5b we show instead the mean displacement at each particular time, along with the standard error estimate for that mean (note the strongly extended vertical scale compared with Figure 5a). This provides a clearer picture of the results, but we emphasize that the regression analysis was applied to the points in Figure 5a, not those in Figure 5b.
The statistics of movement-rate differences between the bed and the surface. A positive rate means that the bed is moving more slowly than the surface
Displacements measured after time intervals of 9, 20, 21, 27, 32, 33 and 38 days. Circles, triangles and crosses represent grids 1, 2 and 3, respectively, (a) All 2250 individual measurements; ( b) means and standard errors for each time interval on each grid. The lines are regression lines for each grid; solid line: grid 1; dashed line: grid 2; dotted line: grid 3
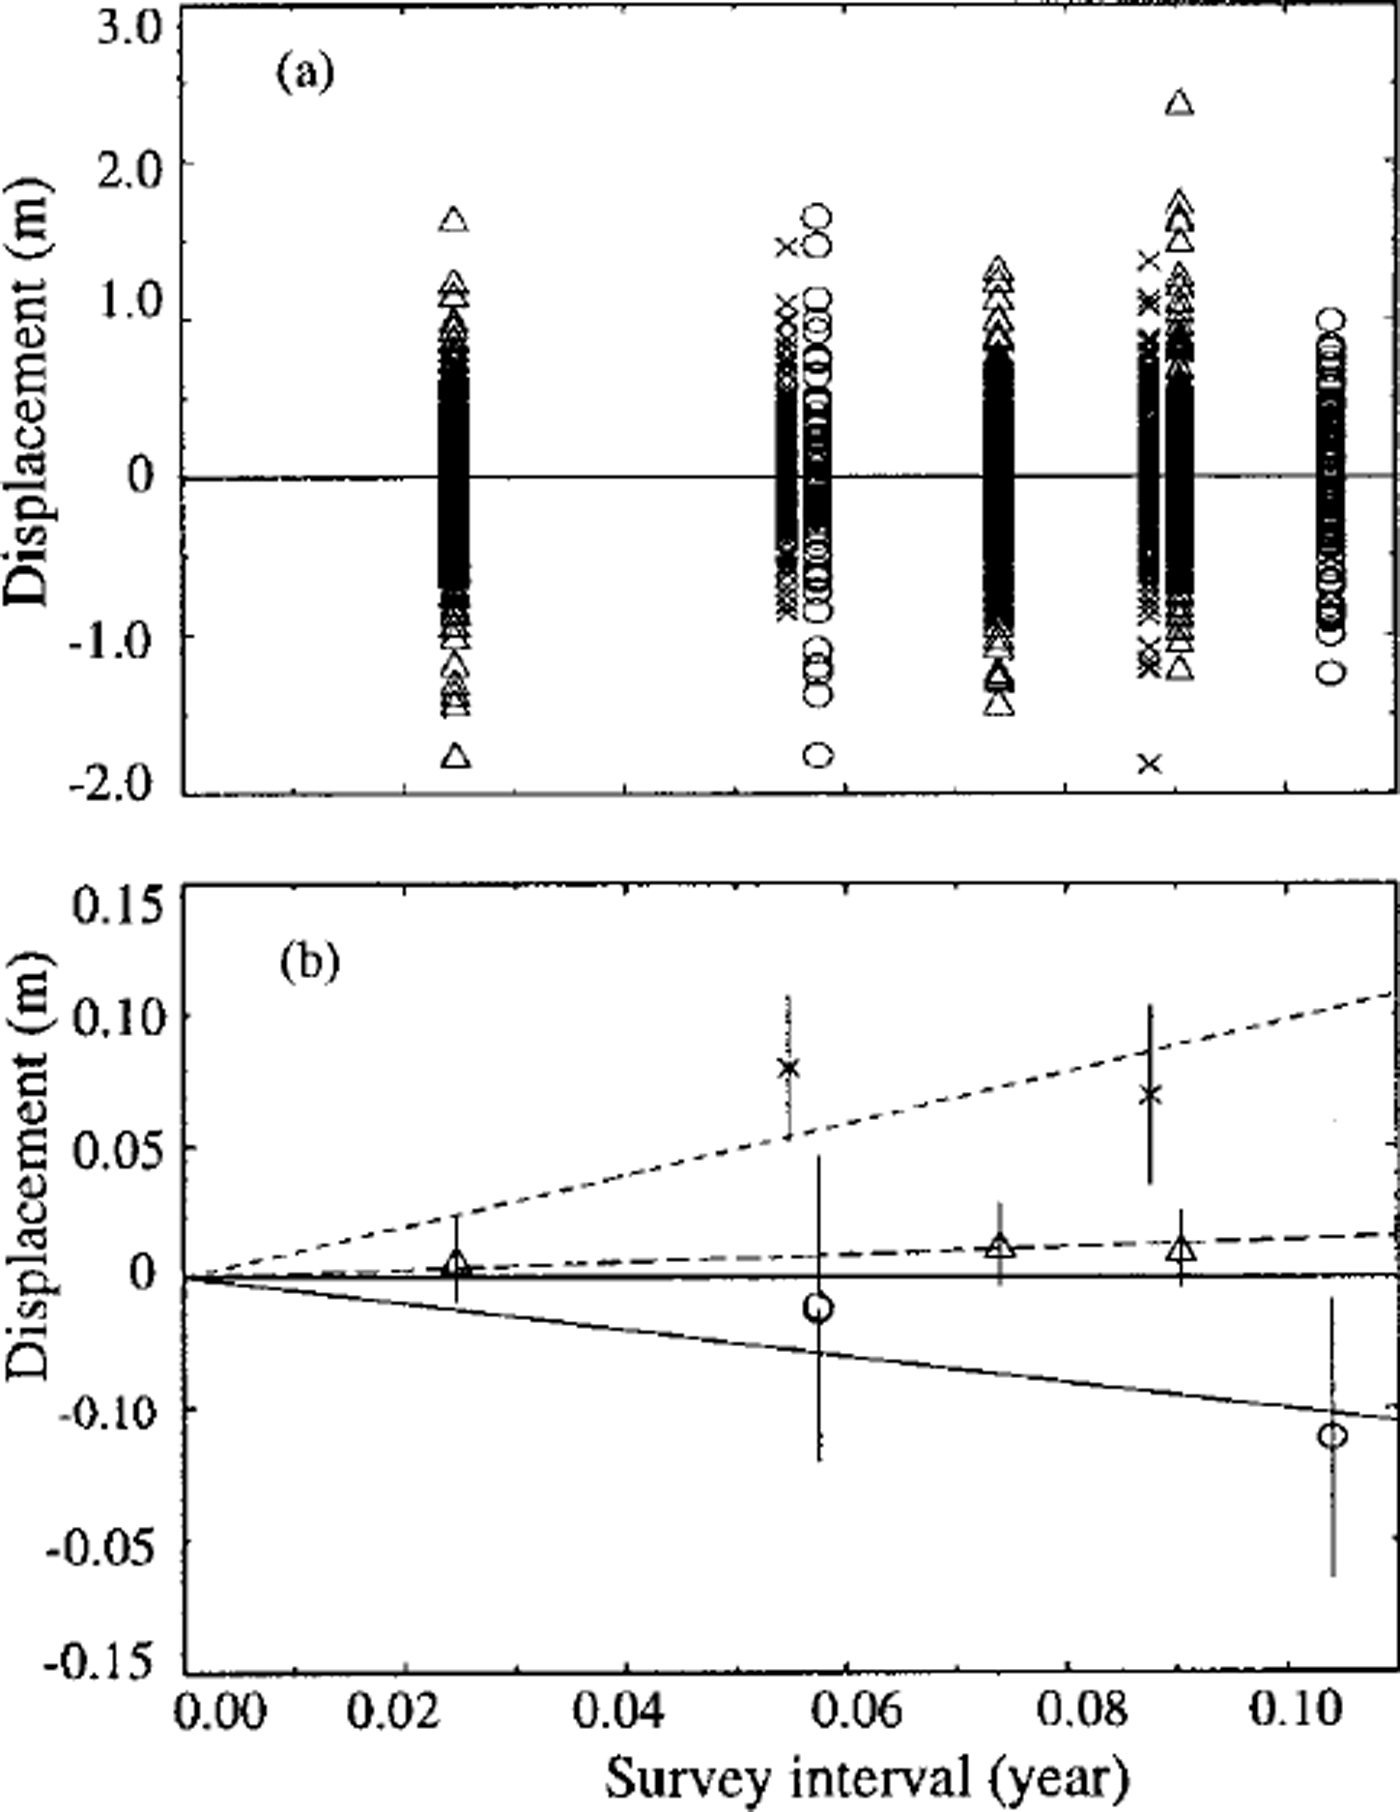
The results in Table 3 show that the grids differ significantiy from each other: the slopes for grids 1, 2 and 3 are, respectively, significantly negative, not significantly different from zero and significantly positive. The indicated speeds of deformational motion within the ice are -0.5, 0.1
The difference between the velocity at the surface, Us, and a point at depth d, U(d), to be expected from internal deformation of the ice can be estimated (assuming laminar flow) from:

where α is the slope, n = 3, A depends on the temperature (Reference PatersonPaterson, 1994) and therefore is a function of depth z, and p is the density, also a function of depth. Equation (2) is based on the assumption that the driving stress is totally supported by the basal shear stress. The temperature profile of Reference Engelhardt and KambEngelhardt and Kamb (1994) and the density profile of Reference Retzlaff and BentleyRetzlaff and Bentley (1993) were used.
We first calculate the differential speed to be expected on the basis of the regional surface slope, i.e. the slope averaged over a distance of many ice thicknesses, which we take to be 2.4 × 10⁻³ (this is admittedly somewhat arbitrary in light of the considerable surface topography; see Fig. 1). We assume initially that the ice is isotropic. Setting d = 1060 m, a representative value for the ice thickness in the region, we find a differential speed of 0.25 ma−1. If, as an alternate assumption, we suppose that the ice has a "soft" 60 m thick basal zone (the maximum thickness that Reference BlankenshipBlankenship (1989) found was consistent with his seismic experiments) with a strong fabric that favors deformation in shear, and we then multiply the value of A in that layer by 2.5 (Reference PatersonPaterson, 1994), the calculated differential speed is 0.45 m a−1. Thus we can say that a regional deformational speed, if the driving stress were supported totally by the bed, would be on the order of a few tenths of a meter per year. For comparison, the average of the speeds for the three grids is 0.2 ma−1.
The deformation in a particular location, however, will not be driven by the regional slope but rather by the local slope, averaged over a distance equal to a few ice thicknesses. Figure 1 shows that grid 2 lies on a flat spot in the surface, whereas grid 3 is on a relatively steep slope and grid 1 is on the flank of a valley with a strong transverse slope component. The components of local slopes parallel to the profile lines in the grids (averaged over centered 5 km lengths for grids 2 and 3 and a 3 km length on grid 1 because of the absence of downstream data) differ by almost an order of magnitude (Table 3). Using the local slopes to calculate the expected deformational speed leads to drastically changed results because of the nonlinearity of the flow law: the calculated speeds (Table 3) range from essentially zero for grid 2 to a maximum of 2.5 m a−1 for grid 3 in the case of a "soft" basal layer.
Since the measured speed on grid 2 is not significantly different from zero, we can say that it agrees with the expected value there, but there is no further conclusion to be drawn.
For grid 3 the measured speed is about half the speed calculated on the assumption that the driving stress is supported by the basal shear stress. In this case we use the error limits on the slope to calculate confidence limits on the basal shear stress as a fraction of the driving stress, using a standard t test. Because of the non-linearity of the flow law, this leads to the conclusion at the 95% confidence level that the basal shear stress is at least 68% of the driving stress (for the soft-basal-layer case at least 82% of the driving stress for the isotropic ice). If the model of ice deforming in simple shear is correct, this result is not compatible with a bed that supports only a small fraction of the driving stress.
The negative deformational speed on grid 1 cannot be readily explained. Even though (a) the grid lies on the edge of the region of measured surface heights (Fig. 1), (b) heights were measured only at 1km intervals, and (c) it is only the downstream half of grid 1 that yields usable measurements (Fig. 5a), the slope is still clearly positive (lower heights downstream). It is noteworthy, however, that grid 1 lies within one of the anomalous "weak bands" of Reference Hulbe and WhillansHulbe and Whillans (1997), whose deformational model includes shearing along inclined planes within the ice. If such a plane lies below grid 1, it could conceivably produce an upstream motion of the surface relative to the base of the ice. Whether or not that is actually occurring, we suspect that the anomalous result on grid 1 is associated with anomalous strains in the "weak band".
Summary and Conclusions
Six high-density flag-line grids, aligned approximately along and normal to the direction of ice flow on Ice Stream B2, were repeatedly profiled with a digital 50 MHz radar system and highly directional positioning devices. Carefully positioned flags were used to mark locations on the radar profiling records; the marks registered by buried crevasses near the surface were used to reduce still further the already small flag-positioning errors.
After pre-processing of the radar record, the originally recorded amplitude data were resampled at a constant spatial interval, then digitally compared using cross-correlation analysis to estimate the relative motion between the bed and the surface.
The results from grids 1-3 were the most accurate and were significantly different from each other. The measured deformational speeds were 1.0 ± 0.1 ma−1 for grid 3, 0.1 ± 0.1m a−1 for grid 2, and -0.5 ± 0.1 m a−1 for grid 1. We attribute the difference between grids 2 and 3 to different local surface slopes, hence different driving stresses. We suggest that the anomalous negative value for grid 1 is associated with the "weak band" (Reference Hulbe and WhillansHulbe and Whillans, 1997) within which it lies, perhaps because of shearing along an inclined plane beneath the grid.
The differential speed on grid 3 can be explained by internal deformation in the ice in response to the local driving stress, but only if at least two-thirds of the driving stress is supported on the bed. However, in light of the complex, inhomogeneous flow demonstrated by Reference Hulbe and WhillansHulbe and Whillans (1997), it would be dangerous to draw any conclusions that are based on a simple two-dimensional model of horizontal shearing in the ice.
Acknowledgements
The authors would like to thank A. N. Novick and T. S. Clarke for their assistance in the field. We also thank three anonymous referees for their comments and suggestions which led to substantial improvements in the paper. We are particularly indebted to N. R. Draper for sage advice on the statistical treatment of our results. This work was supported by U.S. National Science Foundation grants DPP90-18530, OPP92-20678 and OPP93-19043. This is contribution No. 584 of the Geophysical and Polar Research Center, University of Wisconsin-Madison.



