Introduction
There is consistent evidence supporting an association between cannabis use and later psychosis (Myles, Myles, & Large, Reference Myles, Myles and Large2015). Further, patterns of cannabis use in first episode psychosis (FEP) patients are greater in terms of quantity, frequency and potency of cannabis used compared to controls from the same population (Di Forti et al., Reference Di Forti, Marconi, Carra, Fraietta, Trotta, Bonomo and Murray2015; Hasan et al., Reference Hasan, von Keller, Friemel, Hall, Schneider, Koethe and Hoch2019; Marconi, Di Forti, Lewis, Murray, & Vassos, Reference Marconi, Di Forti, Lewis, Murray and Vassos2016). There is converging evidence that cannabis is a component cause of psychotic disorder with well-replicated evidence of dose–response effects on psychotic outcomes (Marconi et al., Reference Marconi, Di Forti, Lewis, Murray and Vassos2016; Moore et al., Reference Moore, Zammit, Lingford-Hughes, Barnes, Jones, Burke and Lewis2007; Murray & Di Forti, Reference Murray and Di Forti2016; Ortiz-Medina et al., Reference Ortiz-Medina, Perea, Torales, Ventriglio, Vitrani, Aguilar and Roncero2018; Schoeler et al., Reference Schoeler, Petros, Di Forti, Klamerus, Foglia, Ajnakina and Bhattacharyya2016).
When discussing psychosis and cannabis use, it is important to differentiate between psychotic-like experiences (PEs) and clinical psychotic disorder. Clinical psychotic disorder is relatively rare [incidence 21.4–26.6 per 100 000 person years (Jongsma et al., Reference Jongsma, Gayer-Anderson, Lasalvia, Quattrone, Mule, Szöke and Menezes2018; Jongsma, Turner, Kirkbride, & Jones, Reference Jongsma, Turner, Kirkbride and Jones2019)] whereas PEs are common and self-limiting [incidence 3000 per 100 000 person-years (van Os, Linscott, Myin-Germeys, Delespaul, & Krabbendam, Reference van Os, Linscott, Myin-Germeys, Delespaul and Krabbendam2009)] but can be a harbinger of more serious disorder (Werbeloff et al., Reference Werbeloff, Drukker, Dohrenwend, Levav, Yoffe, Van Os and Weiser2012). However, the usual instruments for measuring PEs, such as the Peter's Delusions Inventory or the Community Assessment of Psychic Experience, either do not specifically index drug-induced experiences as part of the intoxication state (Stefanis et al., Reference Stefanis, Hanssen, Smirnis, Avramopoulos, Evdokimidis, Stefanis and Van Os2002) or specifically exclude them (Peters, Joseph, & Garety, Reference Peters, Joseph and Garety1999; Peters, Joseph, Day, & Garety, Reference Peters, Joseph, Day and Garety2004).
Recreational drugs such as cannabis are used primarily for their immediate psychoactive effects. Factor analytic approaches have clustered cannabis intoxication experiences into psychotic-like experiences (cPLEs) and euphoric experiences (cEEs) (Barkus, Stirling, Hopkins, & Lewis, Reference Barkus, Stirling, Hopkins and Lewis2006; Quinn, Wilson, Cockshaw, Barkus, & Hides, Reference Quinn, Wilson, Cockshaw, Barkus and Hides2017). cPLEs (sometimes called psychotomimetic experiences) are worthy of study in their own right as a model for psychotic disorder. cPLEs are increased in patients v. controls (Bianconi et al., Reference Bianconi, Bonomo, Marconi, Kolliakou, Stilo, Iyegbe and Di Forti2016; D'Souza et al., Reference D'Souza, Abi-Saab, Madonick, Forselius-Bielen, Doersch, Braley and Krystal2005); increased in those with schizotypy and those at risk of schizophrenia (Barkus et al., Reference Barkus, Stirling, Hopkins and Lewis2006; Stirling et al., Reference Stirling, Barkus, Nabosi, Irshad, Roemer, Schreudergoidheijt and Lewis2008; Vadhan, Corcoran, Bedi, Keilp, & Haney, Reference Vadhan, Corcoran, Bedi, Keilp and Haney2017). cPLEs may predict cessation of use in a non-clinical sample (Sami, Notley, Kouimtsidis, Lynskey, & Bhattacharyya, Reference Sami, Notley, Kouimtsidis, Lynskey and Bhattacharyya2018) whereas patients with psychotic disorders report using cannabis for affect regulation and socialisation, despite awareness that cannabis has a detrimental effect on positive symptoms of psychosis (Dekker, Linszen, & De Haan, Reference Dekker, Linszen and De Haan2009).
One study to date has reported that patients experience both cPLEs and cEEs more frequently than controls but this did not take into account increased use in patients (Bianconi et al., Reference Bianconi, Bonomo, Marconi, Kolliakou, Stilo, Iyegbe and Di Forti2016). Given that both increased rates of cannabis use and increased cannabis experiences are seen in FEP, it is not yet clear how these relate to each other and whether this differs from that of controls. No study to date has examined specifically the relationship between extent of use, cannabis experiences and psychotic disorder.
We therefore studied cannabis experiences in a large international sample of FEP patients and control lifetime cannabis users. To index these experiences we used the Cannabis Experiences Questionnaire an instrument specifically developed to assess retrospective cannabis experiences (Barkus et al., Reference Barkus, Stirling, Hopkins and Lewis2006; Stirling et al., Reference Stirling, Barkus, Nabosi, Irshad, Roemer, Schreudergoidheijt and Lewis2008). We hypothesised that: (a) we would replicate the finding of increased cPLEs and cEEs in FEP patients v. controls; (b) extent of use (as indexed by frequency of use, money spent on cannabis and potency) would be associated with more frequent cannabis-induced experiences when adjusted for confounders and (c) this effect would differ between cases and controls: specifically that both cPLEs and cEEs would be more affected by heavy use in FEP patients v. controls. We included THC potency as a proxy of the dose of Δ⁹-tetrahydrocannabinol the primary psychomimetic constituent in cannabis (Morrison et al., Reference Morrison, Zois, McKeown, Lee, Holt, Powell and Murray2009).
Methods
The European network of national networks studying gene environment interactions in schizophrenia (EU-GEI) study is a multi-centre study comprising several workpackages (Van Os et al., Reference Van Os, Rutten, Myin-Germeys, Delespaul, Viechtbauer, Van Zelst and Mirjanic2014). Workpackage 2 comprises a 17 centre study across six countries (United Kingdom, Holland, Spain, France, Italy and Brazil) on FEP. Local Research Ethics Committee approval was obtained from each area.
Sample selection
Patients and controls were recruited between May 2010 and May 2015. Patients were identified by trained EUGEI researchers across the 17 sites and invited by clinical teams to participate. For patients inclusion criteria were: (i) age 18–64; (ii) presentation with FEP (ICD-10 F20-33) and (iii) residence within each defined locality. Exclusion criteria were: (i) organic psychosis (ICD-10: F09); (ii) psychosis due to acute intoxication (ICD-10: F1X.5) and (iii) previous contact with mental health services for psychosis. For full diagnostic data see online Supplementary Table S1.
Controls were recruited using a quota strategy derived from local demographic data to be representative for age, sex and ethnicity of the population at risk for each site. In order to sample controls in the first instance we undertook random sampling (a) from lists of all postal addresses and (b) from GP lists from randomly selected surgeries. The EUGEI study aimed to over-sample certain groups (e.g. young men) using direct approaches such as local advertisements and leaflets at local shops and community centres. Controls were excluded if they had received a diagnosis or treatment for psychotic disorder.
Further details of the EUGEI study have previously been described (Jongsma et al., Reference Jongsma, Gayer-Anderson, Lasalvia, Quattrone, Mule, Szöke and Menezes2018). For the purpose of this study, analysing cannabis experiences, we only analysed data from participants (both patients and controls) who reported having ever used cannabis (lifetime use).
We did not use data from two centres: Maison-Blanche (France) as this centre did not collect controls and Verona (Italy) as cannabis use data were not complete. We excluded 12 cases (1.8%) who were classified as having non-psychotic illness from the Diagnosis and Statistical Manual IV (DSM-IV) Operational Criteria Checklist (OPCRIT) screening of medical records.
Measures
Demographics
Data were collected on age, sex, ethnicity, site, country and years of education.
Cannabis use
A modified version of the Cannabis Experiences Questionnaire was used to collect cannabis use variables and cannabis experiences data (Barkus et al., Reference Barkus, Stirling, Hopkins and Lewis2006). This is a researcher administrated measure which collects self-reported data on: age of first use, frequency of use (categories: every day; more than once a week; a few times a month; a few times each year; only once or twice) and average money spent in a week (categories: less than €2.50; €2.50–€5.00; €5.00–€10.00, €11.00–€15.00; €16.00–€20.00 and 6 above €20).
Potency
Since there is geographical variation in type of cannabis used we used an approach to determine users of low potency and high potency cannabis as has been reported before in the EUGEI study. Briefly participants were asked to name the strain they most often used in their own language. Strains were compared to mean reported THC concentration from published data from European Monitoring Centre for Drugs and Drug Addiction (European Monitoring Centre for Drugs & Drug Addiction, 2016). High potency cannabis was categorised as THC ⩾ 10%: including UK home-grown skunk/sensimilla UK Super Skunk, Italian home-grown skunk/sensimilla, Italian Super Skunk, the Dutch Nederwiet, Nederhasj and geimporteerde hasj, the Spanish and French Hashish (from Morocco); or ‘low potency’ with mean THC < 10% including: hash/resin from UK and Italy, imported herbal cannabis from UK, Italy, Spain and France, Brazilian marijuana and hash and the Dutch Geimporteerde Wiet. For further details see Di Forti et al. (Reference Di Forti, Quattrone, Freeman, Tripoli, Gayer-Anderson, Quigley and van der Ven2019).
Other drug use
We collected data on the number of other drugs used, number of cigarettes smoked per day and units of alcohol consumed daily.
Cannabis experiences
Frequency of nine intoxication experiences – six cPLEs (feeling fearful; feeling crazy or mad; feeling nervy; feeling suspicious; hearing voices and seeing visions); and three cEEs (feeling happy; understanding the world better and being full of plans or ideas) were rated on a 5 point Likert scale: (0 rarely or never, 1 from time to time, 2 sometimes 3 more often than not, 4 almost always). These experiences were chosen as previous factor analytic approaches in the development of the Cannabis Experiences Questionnaire showed that these experiences load significantly onto respective subscales to index PEs and pleasurable effects (Barkus & Lewis, Reference Barkus and Lewis2008; Stirling et al., Reference Stirling, Barkus, Nabosi, Irshad, Roemer, Schreudergoidheijt and Lewis2008).
Statistical analysis
Scores were obtained for cPLEs and cEEs by simple summation, as previously undertaken (Barkus et al., Reference Barkus, Stirling, Hopkins and Lewis2006; Sami et al., Reference Sami, Notley, Kouimtsidis, Lynskey and Bhattacharyya2018). As there were half as many euphoric experiences items as PEs items, the scores for euphoric experiences were doubled rendering a scale of between 0 and 24 for both cPLEs and cEEs. Since such experiences can be conceptualised to index an underlying continuum both cPLEs and cEES were treated as continuous variables.
Extent of use was indexed primarily by the frequency of cannabis use and by potency. In further sensitivity analysis we replaced these with money spent on cannabis use. We calculated Pearson's Correlation coefficients to test whether the extent of use variables were correlated.
Demographics and substance use
We ascertained differences between demographic (age at assessment, sex, ethnicity, years in education and site) and cannabis use parameters (age of first use, frequency of use, money spent per week, potency, duration of use, lifetime and 12 month dependence) and other drug use parameters [cigarettes per day, units of alcohol in a day and other drugs ever used (excluding cannabis, alcohol, tobacco and caffeine)] using t tests for continuous variables and χ2 for categorical variables.
Main analysis
We undertook to test the three hypotheses in a regression analyses framework. To test hypothesis (a) that caseness predicts experience: we regressed cannabis experiences (cPLEs and cEEs) as the dependent variables and caseness as the independent variables. To test hypothesis (b) that extent of use predicts experiences: we regressed cannabis experiences as the dependent variables and the extent of use variables as the independent variables. As the extent of use variables we entered frequency of cannabis use, and THC potency into separate models. These two variables (frequency of use and potency) were chosen to primarily index extent of use as they are both related to the extent of cannabis exposure but are distinct behaviours (for example one can use very frequently but at low potency). To test hypothesis (c): that there is an interaction between caseness and extent of use on cannabis experiences: we regressed cannabis experiences as the dependent variables and caseness and the extent of use variables alongside the interaction of caseness × extent of use. In all models we entered cPLEs as a regressor when the dependent variable was cEEs and cEEs as a regressor when the dependent variable was cPLEs to ensure that the predictors identified for relationships were independent of the other experience.
In sensitivity analyses for hypothesis (b) and (c) we ran the same regressions models using money spent on cannabis use rather than the frequency or potency variables.
We undertook a further sensitivity analysis to adjust for confounders. PEs may be explained by a number of putative other confounders other than caseness or extent of use. We hence adjusted for firstly demographic variables (age, sex and ethnicity) in secondary models and further to this substance misuse confounders in tertiary models (number of other drugs ever used, tobacco use and alcohol use) as other substance misuse may arguably be related to cannabis induced experiences to see if interaction effects survived putative confounders.
Finally we undertook a supplementary analysis to see if interactions for other classes of drugs were present on cPLEs. This analysis did not change the main findings reported in the manuscript and is reported in full in the Supplementary material.
cPLEs and cEEs demonstrated positive skew (cEEs 0.612, cPLEs 2.231). Because of violations of homoscedasticity in regression models we undertook all analyses using the robust regression option in STATA. For the purpose of estimation of 95% confidence intervals (see Fig. 1) we applied bootstrapping to inferential tests using 1000 samples and bias corrected and accelerated confidence intervals.
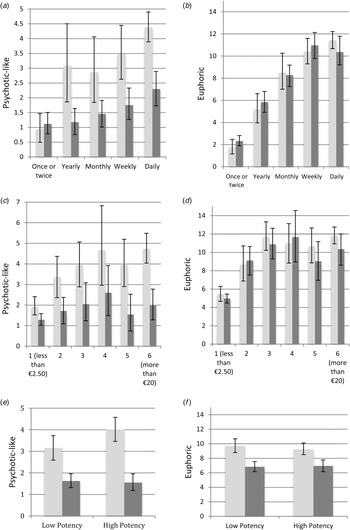
Mean cannabis-induced psychotic-like experiences and euphoric experiences scores by case and control. (a, b) Caseness × frequency of cannabis use interaction on cannabis-induced experiences. (c, d) Caseness × money spent on cannabis per week interaction on cannabis-induced experiences. (e, f) Caseness × potency of cannabis used interaction on cannabis-induced experiences. Legend: Light grey bars indicate FEP cases, dark grey bars for controls. Data drawn from complete case data. Y axis represents mean psychotic like experiences and euphoric experiences scores ± 95% bootstrapped confidence interval.

Missing data
Missing data rates are shown in online Supplementary Table S4. cPLEs were available for 598/655 (91.3%) cases and 615/654 (94.0%) controls whereas cEEs scores were available for 602/655 (91.9%) cases and 616/654 (94.2%) controls. To ensure that results were not the result of systematic missing data, missing data was imputed using imputation analysis with chained equations (Azur, Stuart, Frangakis, & Leaf, Reference Azur, Stuart, Frangakis and Leaf2012) for cPLEs and cEEs as outcome variables, independent and auxillary variables. A total of 29 variables were included in the imputation model, including cannabis use variables (age of first use, social use, frequency, money spent and diagnosis of misuse), other drug use variables (tobacco use, alcohol use and number of other drugs used) and demographic variables (sex, age, ethnicity, site and psychosis diagnosis). Fifty datasets were imputed with 10 cycles.
Regression and main analyses were run using the imputed dataset to account for missing data. Exploratory pairwise correlation between the extent of use variables was undertaken listwise since pairwise correlation is not available using the mi estimate command in STATA. Data was analysed using STATA version 15.
Results
Data were available for 1035 cases patients and 1382 controls. A total of 655 cases (63.3% of all cases) and 654 controls (47.3% of all controls) reported ever use of cannabis and data analysis was restricted to them.
Baseline demographics
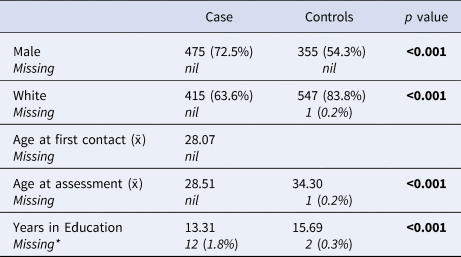
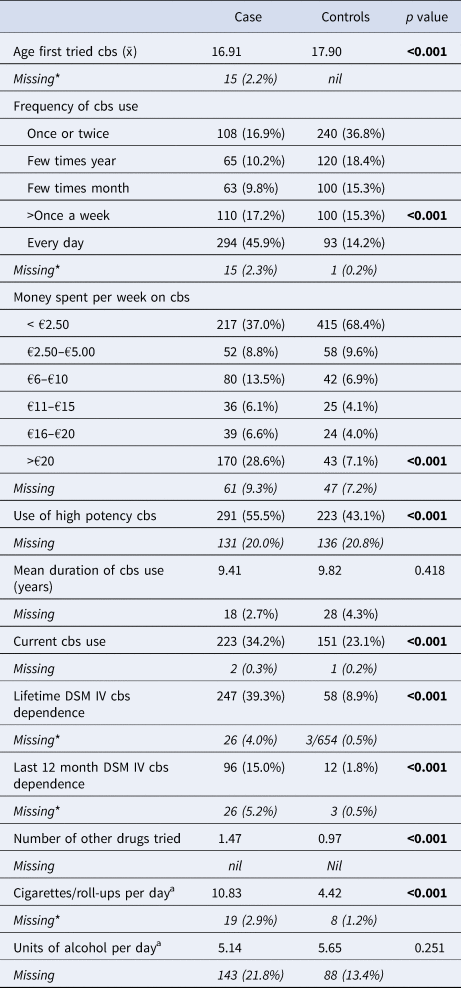
Cases were significantly more likely than controls to be male, younger and have had fewer years of education (see Table 1). As expected, cases were more likely to have started using cannabis younger, more likely to have used more frequently, to have used more other drugs, and smoked more cigarettes per day (see Table 2). Detailed diagnostic, ethnicity and site data are presented in online Supplementary Tables S1–S3.
Baseline characteristics between cases and controls

Comparison of cannabis use patterns between cases and controls

cbs, cannabis.
Mean numbers (x¯) are given unless specified as a proportion. Significance testing undertaken via 2-tailed independent t tests for continuous variables and χ2 tests for categorical variables. Missing data rates are italicised.
* Indicates significant difference (p < 0.05) in missing data between cases and controls (χ2 test or Fisher's exact test where any single value < = 5).
a Data was cleaned to remove outliers to max 40 cigarettes/day. Units of alcohol data cleaned to max of 30 units per day.
Extent of use
As expected the variables indexing extent of use were significantly correlated. Frequency of use weakly correlated with dichotomised potency (r = 0.121, p = 0.001). Frequency of use strongly correlated with money spent on cannabis per week (r = 0.703, p < 0.001) whereas potency moderately correlated with money spent on cannabis (r = 0.211, p < 0.001).
Caseness by frequency of use on cPLEs and cEEs (hypothesis a)
As hypothesised caseness predicted cPLEs independent of cEEs (b = 0.826, t = 7.86, p < 0.001) and predicted cEEs independent of cPLEs (b = 0.840, t = 4.40, p < 0.001) such that patients had both more frequent psychotic-like and euphoric experiences than controls.
Extent of use as a predictor of cPLEs and cEEs (hypothesis b)
As hypothesised extent of use predicted cPLEs independent of cEEs whether the extent of use variable was frequency of use (b = 0.502, t = 6.18, p < 0.001), or potency (b = 0.543, t = 2.36, p = 0.019) such that increased extent of use predicted increased PEs. Similarly frequency of use predicted cEEs independent of cPLEs (b = 2.17, t = 21.46, p < 0.001) but this was not the case with potency (b = 0.210, t = 0.55, p = 0.58).
Sensitivity analysis (hypothesis b)
For cPLEs results were the same when extent of use was indexed by money spent on cannabis per week (b = 0.397, t = 6.17, p < 0.001) such that money spent predicted increased PEs. Similarly for cEEs increased money spent on cannabis predicted cEEs independent of cPLEs (b = 1.24, t = 13.64, p < 0.001).
Interaction effects (hypothesis c)
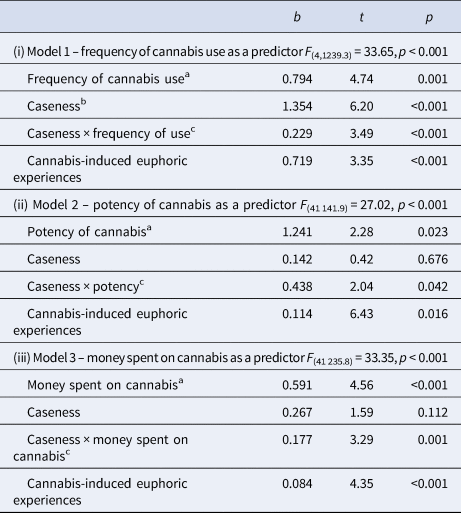
Model parameters for caseness by extent of use and their interaction on predicting cannabis PEs can be seen in Table 3 and caseness × extent of use scores for mean experiences are shown in Fig. 1.
Primary models for cannabis-induced psychotic-like experiences caseness × extent of use interaction

Directions of effect as follows: aIncreased extent predicts increased cPLEs; bFEP predicts increased cPLEs; cSignificant caseness × extent interaction.
Caseness × frequency of use on cPLEs
There was a significant caseness effect (b = 1.354, t = 6.20, p = 0.001); a significant effect for increased frequency of cannabis use (b = 0.794, t = 4.74, p < 0.001); and a significant interaction between group and frequency such that increasing frequency was associated with increased difference in cPLEs between cases and controls (b = 0.229, t = 3.49, p = 0.001).
Caseness × potency on cPLEs
There was no significant effect of caseness (p = 0.676); but an effect for potency such that increased potency was associated with increased cPLEs (b = 1.241, t = 2.28, p = 0.023); and a significant interaction for caseness by potency (b = 0.438, t = 2.04, p = 0.042).
Caseness × extent of use variables on cEEs
There was evidence for increased euphoric experiences as cannabis use increased frequency (b = 2.152, t = 9.44, p < 0.001) but not for potency (p = 0.935). There was no significant interaction for either frequency or potency of cannabis use × caseness for cEEs as the dependent variable.
Sensitivity analysis (hypothesis c)
Caseness × money spent on cPLEs
There was no significant effect of caseness (p = 0.112); but there was a significant effect for money spent such that cPLEs increased with more money spent (b = 0.591, t = 4.56, p = 0.001); and a significant interaction between caseness and money spent such that more money spent was associated with increased difference in cPLEs between cases and controls (b = 0.177, t = 3.29, p = 0.001).
Caseness × extent of use variables on cEEs
There was evidence for increased euphoric experiences as cannabis use increased for money spent (b = 1.109, t = 5.75, p < 0.001). There was no significant interaction for any of the extent of use variables × caseness for cEEs as the dependent variable.
Sensitivity analysis: adjustment for demographic and substance use covariates
In secondary models we adjusted models for cPLEs as the dependent variables for demographic covariates: the interaction terms remained significant for caseness × frequency of use (b = 0.207, t = 3.19, p = 0.001); caseness × money spent on cannabis (b = 0.163, t = 3.07, p = 0.002); caseness × potency (b = 0.446, t = 2.08, p = 0.038). In tertiary models we additionally adjusted for substance misuse covariates: the interaction terms remained significant for caseness × frequency of use (b = 0.208, t = 3.23, p = 0.001) and caseness × money spent on cannabis (b = 0.176, t = 3.30, p = 0.001); caseness × potency (b = 0.441, t = 2.08, p = 0.038). We conclude that the caseness × extent of use interaction for increased cPLEs for patients v. controls is robust to a number of demographic and substance use confounders.
Discussion
To our knowledge, this represents the largest case-control study with extensive cannabis data in FEP ever undertaken. We (a) replicate the finding that cannabis intoxication experiences are more frequent in patients compared to controls; (b) show that extent of use as indexed by frequency of use and money spent on cannabis per week predict these experiences and (c) show that there is an interaction between caseness × frequency and caseness × money spent such that increasing levels of use are associated with more frequent PEs (but not euphoric experiences) in patients compared with controls. Importantly our findings are robust to a number of putative confounders including age, sex, gender and other substance use which would not explain any of these. Additionally we observe that these findings remains after accounting for various comorbid substance use parameters.
Importantly, these findings indicate that cannabis related experiences change as a function of extent of use. The Cannabis Experiences Questionnaire provides a measure of experiences as a proportion of total cannabis use, rather than a simple count of total experiences. A maximal score for cPLEs indicates that all six PEs were experienced every time cannabis was used whereas a minimal score indicates that these experiences were never or rarely experienced, irrespective of total number of times used. Hence higher scores indicate that the experience changes rather than simply indicating an increased total number of experiences due to increased number of times that cannabis is used.
Although not the main purpose of this analysis we also found of interest that a history of crack cocaine and inhalant abuse are associated with an increase in cannabis induced psychotic experiences whereas such experiences appear less frequent in the context of opiate abuse (see Supplementary material for full details). This may indicate that there is a cross sensation of drugs of abuse and is consistent with previous literature in which whereas cannabis and cocaine use are synergistic for psychosis experiences (Roncero et al., Reference Roncero, Daigre, Gonzalvo, Valero, Castells, Grau-López and Casas2013a, Reference Roncero, Daigre, Grau-López, Rodríguez-Cintas, Barral, Pérez-Pazos and Casas2013b) whereas opiate withdrawal is associated with psychosis experiences (Casado-Espada et al., Reference Casado-Espada, Martín, De La Iglesia-Larrad, Alarcón, Fombellida, Fernández-Martín and Roncero2019; Weibel, Mallaret, Bennouna-Greene, & Bertschy, Reference Weibel, Mallaret, Bennouna-Greene and Bertschy2012), but this does not influence our main results.
This study extends previous work (Bianconi et al., Reference Bianconi, Bonomo, Marconi, Kolliakou, Stilo, Iyegbe and Di Forti2016) by showing that extent of use is a key predictor of PEs and that FEP patients and controls have divergent experiences with increasing extent of use. Interestingly, the same relationship does not hold for euphoric experiences as cEEs scores, when stratified by extent of use, are well-matched between cases and controls. This suggests that specific mechanisms underlie the cannabis-related increases of PEs which may be related to genetic predisposition and may further support a GxE interaction as has been demonstrated on cannabis use with the risk of schizophrenia spectrum disorder (Guloksuz et al., Reference Guloksuz, Pries, Delespaul, Kenis, Luykx, Lin and van Os2019). One putative mechanism to be examined is that variation in the DRD2 and possibly AKT1 genes may render cases more likely to develop postsynaptic supersensitivity (Colizzi et al., Reference Colizzi, Iyegbe, Powell, Blasi, Bertolino, Murray and Di Forti2015; Morgan, Freeman, Powell, & Curran, Reference Morgan, Freeman, Powell and Curran2016). Further work is needed to identify the specific genetic mechanisms which interact with increased extent of use.
Perhaps somewhat surprisingly we do not find the increased levels of use are associated with reduced euphoric experiences which would have been consistent with tolerance at heavier levels of use. Rather we find the relationship to indicate the opposite direction. There could be two possible explanations to this: either that repeated cannabis use is associated with increased sensitisation rather than tolerance to such experiences, or conversely that the association exists because individuals who have more euphoric experiences are more likely to use heavier amounts of cannabis. Further work is required to disentangle these two possibilities.
Strengths and limitations
The particular strengths of this study are (i) the sample size and (ii) the international sample. The limitations include: (i) the cross-sectional design, (ii) the use of self report measures and (iii) the lack of laboratory tests of potency.
The cross-sectional design precludes interpretation about temporal sequence of associations, which means it is difficult to disentangle whether extent of use causes enhanced experience or vice-versa. Euphoric experiences (cEEs) are likely to drive use whereas this is not the case for psychotic-like experiences (cPLEs) which have previously been shown to be associated with subsequent discontinuing use (Sami et al., Reference Sami, Notley, Kouimtsidis, Lynskey and Bhattacharyya2018; Valmaggia et al., Reference Valmaggia, Day, Jones, Bissoli, Pugh, Hall and McGuire2014). Furthermore in the case of cPLEs we included cEEs as a covariate in the model to regress out the association with euphoria. This may tentatively suggest a role for sensitisation to increasing levels of cannabis use for cPLEs in FEP.
Both exposure and outcome measures were based on self-report. It is possible that because cannabis can be amnestic in nature exposure to cannabis may be misreported. However the relationships we report were similar for both frequency of cannabis use and money spent on cannabis per week (and it is arguable whether money spent is a more salient indicator of use than frequency of use) which increase our confidence in reporting these relationships. There are limited methods to determine extent of use over a longer period. Hair samples can provide an estimate of use over 3 months, but have been shown to be unreliable in a major observational study (Taylor, Sullivan, Ring, Macleod, & Hickman, Reference Taylor, Sullivan, Ring, Macleod and Hickman2017). Moreover, self-report (but not hair) measures of cannabis use were found to predict acute psychotomimetic responses to cannabis (Curran et al., Reference Curran, Hindocha, Morgan, Shaban, Das and Freeman2019). Additionally, self-reported data on cannabis potency is associated with its concentration of THC measured in the laboratory (Freeman et al., Reference Freeman, Morgan, Hindocha, Schafer, Das and Curran2014) The outcome measures, although self-reported, were based on a considerable body of work validating cannabis experiences in non-clinical, although not in clinical populations (Barkus et al., Reference Barkus, Stirling, Hopkins and Lewis2006; Quinn et al., Reference Quinn, Wilson, Cockshaw, Barkus and Hides2017). Another limitation is that the PEs were rated retrospectively rather than as state measures (e.g. in an experimental design administering THC).
On the other hand, a strength of utilising retrospective self-report measures is that these are the experiences patients report to their clinicians during routine consultations. There were several differences between cases and controls, but the results persisted after adjusting for a wide variety of confounders. Perhaps most importantly cEEs were the same between patients and controls when accounted for extent of use: this indicates differences in cPLEs between FEP and controls to be specific to intrinsic biological differences between groups rather than to other confounders. One further limitation is that we did not account for non-psychosis comorbidities such as ADHD which may be synergistic with substance use for a psychotic outcome, as has been shown in the context of cocaine dependence (Carlos Roncero et al., Reference Roncero, Daigre, Gonzalvo, Valero, Castells, Grau-López and Casas2013a). This could be undertaken in future studies.
Clinical implications
We consider this study to have a number of important findings in the clinical context. Although easily elicitable, clinicians do not routinely inquire about cPLEs in the clinical context. Our study suggests there are important differences between FEP patients and controls. Firstly our study adds to previous work (Bianconi et al., Reference Bianconi, Bonomo, Marconi, Kolliakou, Stilo, Iyegbe and Di Forti2016), that patients experience cPLEs more frequently than controls. Secondly our work indicates that lower extent of use is associated with decreased cPLEs. This is in line with evidence suggesting that FEP who continue to use cannabis, especially daily high potency experience more relapses and worse clinical outcome than those who stop after illness onset (Schoeler et al., Reference Schoeler, Petros, Di Forti, Klamerus, Foglia, Ajnakina and Bhattacharyya2016). Thirdly we show that FEP patients are unlikely to derive greater euphoric effects compared to controls at increased levels of use, despite more frequent psychotic-like effects. In the absence of longitudinal data we are unable to definitively determine whether change in use effects experiences. However in the interim patients and particularly those with profound cPLEs should be advised that lower levels of use are associated with fewer PEs; and be advised that for high-potency cannabis there is limited evidence of the added euphoric effect.
Taken together we have shown that extent of cannabis use is associated with enhanced psychotic-like but not euphoric experiences in FEP patients compared to controls. This may suggest a gene × evidence interaction for extent of use and genetic risk for psychosis on cannabis experiences. Further research should aim to determine the biological mechanism underpinning differences between patients and controls.
Supplementary material
The supplementary material for this article can be found at https://doi.org/10.1017/S0033291720000847.
Financial support
This work was supported by the European Community's Seventh Framework Programme under grant agreement No. HEALTH-F2-2010-241909 (Project EU-GEI). The Brazilian study was funded by the São Paulo Research Foundation under grant number 2012/0417-0. The funder was not involved in design and conduct of the study; collection, management, analysis and interpretation of the data; preparation, review or approval of the manuscript, and decision to submit the manuscript for publication. Dr Marta Di Forti is funded by the Medical Research Council. Dr Sami was supported by a Medical Research Council Clinical Research Training Fellowship (MR/P001408/1). Dr Freeman was supported by a Senior Academic Fellowship from the Society for the Study of Addiction. Dr Marta Di Forti and Dr Musa Sami had full access to all the data in the study and take responsibility for the integrity of the data and the accuracy of the data analyses.
Conflict of interest
The authors have no conflicts of interest to declare in relation to the work presented in this paper.