Introduction
Tectonic-thermal processes of active fault zones involve rock fragmentations, grain-size reductions, as well as subsequent mineral alterations and authigeneses in sliding rock volumes; such occurrences being, therefore, found mostly in highly impacted gouges (Laurich et al., Reference Laurich, Urai, Desbois, Vollmer and Nussbaum2014; Carboni et al., Reference Carboni, Viola, Aldega, van der Lelij, Brozzetti and Barchi2020). Changing mineral compositions of faulted rocks have long been described, depending on specific tectonic contexts (e.g. Hobbs et al., Reference Hobbs, Means and Williams1976; Caine et al., Reference Caine, Evans and Forster1996; Holdsworth et al., Reference Holdsworth, Butler and Roberts1997; Scholz, Reference Scholz2002; Sanchez-Roa et al., Reference Sanchez-Roa, Jimenez-Millàn, Abad, Faulkner, Nieto and Garcia-Tortosa2016; Farrell et al., Reference Farrell, Debenham, Wilson, Wilson, Healy, King, Holford and Taylor2021). They show, for instance, that fault zones, and especially the gouge facies, often contain synkinematic phyllosilicates such as muscovite and smaller illite (Velde and Vasseur, Reference Velde and Vasseur1992; Meunier, Reference Meunier2005; Aldega et al., Reference Aldega, Viola, Casas-Sainz, Marcén, Roman-Berdiel and van der Lelij2019; Cutten et al., Reference Cutten, Zwingmann, Uysal, Todd and Johnson2021); geometric and timing constraints providing essential parameters to detail their evolution and that of their deformed host rocks.
Since the pioneering study by Hoffman et al. (Reference Hoffman, Hower and Aronson1976), many K-Ar dating attempts have been carried out on slaty cleavages in siliciclastic rocks, as well as on larger gouges, to address the timing and duration of folding/faulting events (e.g. Kralik, Reference Kralik1982; Kligfield et al., Reference Kligfield, Hunziker, Dallmeyer and Schamel1986; Kirschner et al., Reference Kirschner, Sharp and Masson1995; Vrolijk and van der Pluijm, Reference Vrolijk and van der Pluijm1999; Scheiber et al., Reference Scheiber, Viola, van der Lelij, Margreth and Schönenberger2019; Mottram et al., Reference Mottram, Kellett, Barresi, Zwingmann, Friend, Todd and Percival2020). Some interpretations of such studies have appeared inconsistent due mostly to incomplete isotopic resetting of the separated minerals, often due to an incomplete grain-size separation (e.g. Clauer and Chaudhuri, Reference Clauer, Chaudhuri, Frey and Robinson1998; Pevear, Reference Pevear1999). In fact, if size fractionation remains the most appropriate sample preparation to separate millimeter to nanometer-sized authigenic crystals from larger detrital minerals, especially in fine-grained meta-sediments, this technique reaches its limits in the case of mixtures of mineral types that are identical or similar, with similar sizes but with different crystallization times. The present study was an attempt to address this technical aspect of mineral mixtures in limited rock volumes of a fault system that hosted mineral–fluid interactions.
Recent mineralogical studies of larger gouge volumes describe how clay minerals, for instance, organize in such specific rock volumes (e.g. Sasseville et al., Reference Sasseville, Tremblay, Clauer and Liewig2008; Zwingmann et al., Reference Zwingmann, Han and Ree2010; Haines and Van der Pluijm, Reference Haines and van der Pluijm2012; Laurich et al., Reference Laurich, Urai, Desbois, Vollmer and Nussbaum2014). However, this genetic information does not necessarily solve all the difficulties associated with an isotopic dating attempt of small and fragile minerals, as the challenge depends on: (1) how efficient is the technique used for the size separation of the clay-type material; (2) how can the purification of authigenic clay crystals be achieved relative to an initial mixture with detrital crystals having similar compositions and grain sizes, and (3) to which extent may unexpected parameters interfere, depending on the type of faulting/folding, such as the size of the gouges and the supply of the flowing fluids. Decrypting such water–rock interactions in decimeter to centimeter-sized gouge volumes represents the core of the present study based on a large mineralogical and geochemical database, as well as on K-Ar dating of separated mineral fractions. To do so, the mineral compositions of centimeter-sized gouges were compared with those of the nearby undeformed protolith and the other structural elements of the Main Fault composed mainly of scaly clay lenses and an anastomosing network of slickensided shear surfaces, in order to evaluate the extent of the crystallographic-chemical impacts in these various rock types.
The geologic context
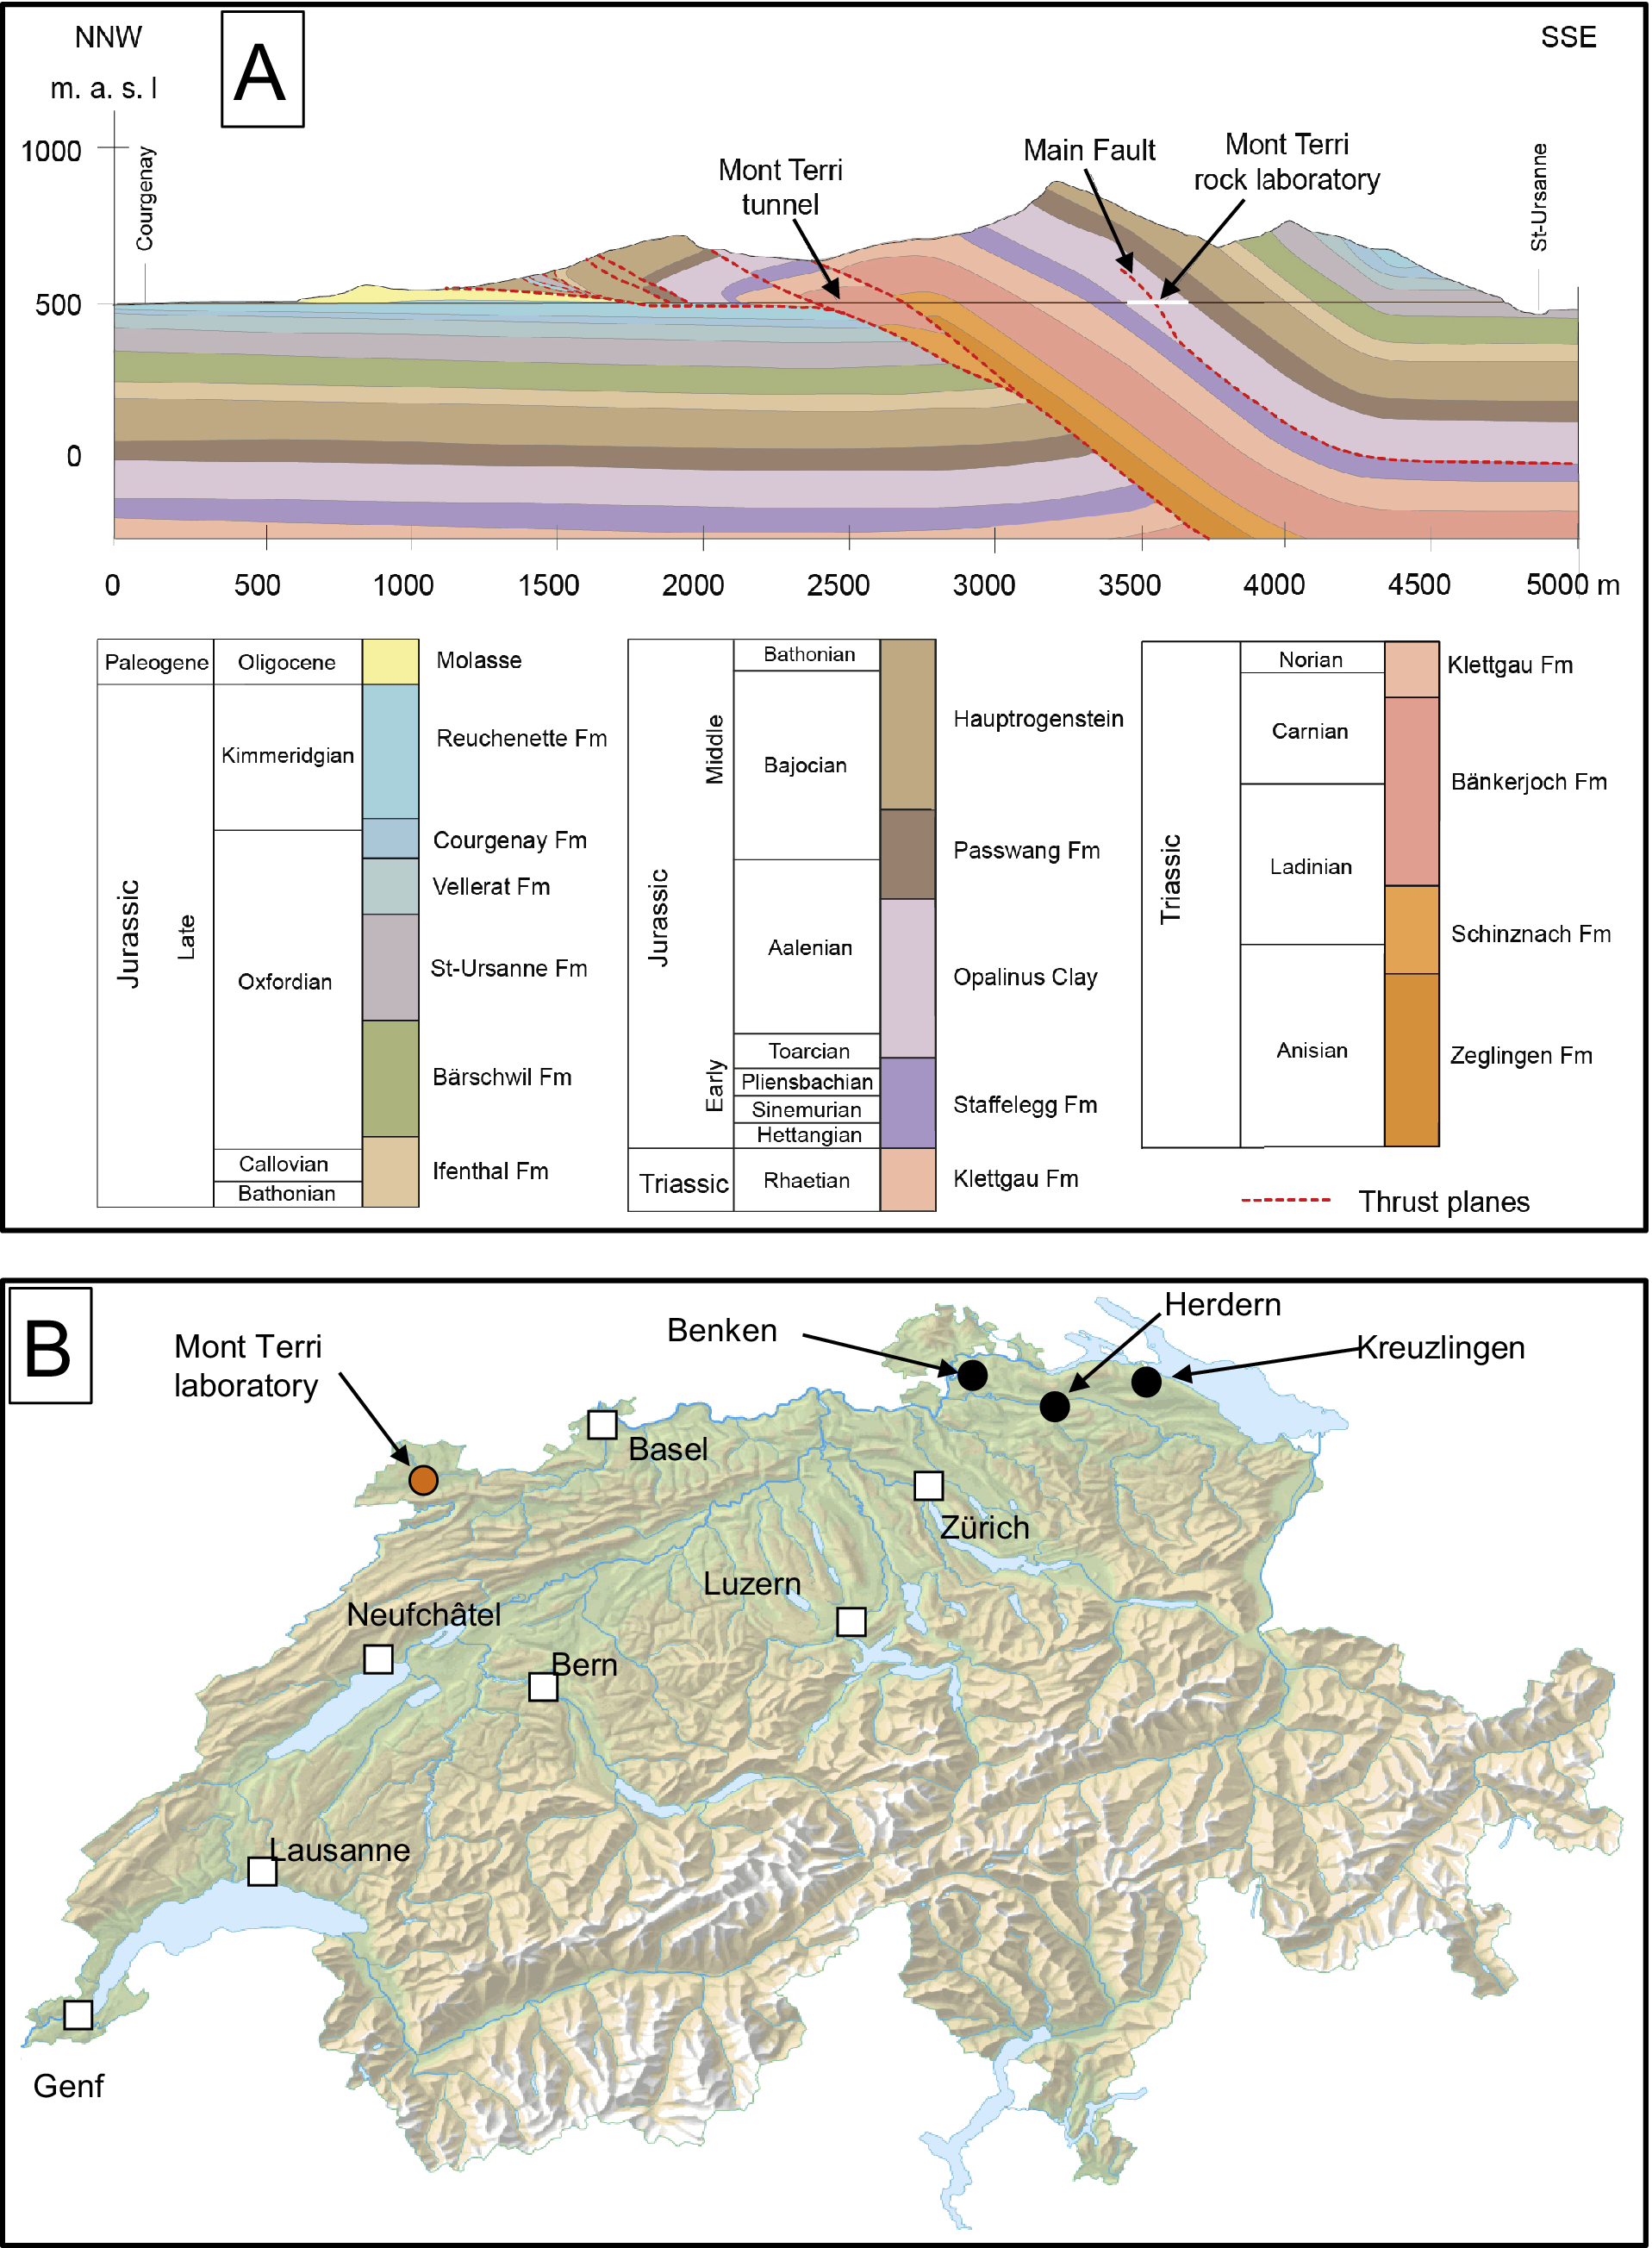
The Opalinus Clay formation (hereafter OPA) became of major regional interest after it was selected for preliminary studies in the search for potential deposition sites for nuclear waste in Switzerland along the Mont Terri highway tunnel (Bundesamt für Energie, 2008; Fig. 1A). In this context, a research laboratory was excavated in the back limb of the local anticline on the basis of a geological and a structural description of the region by Bossart et al. (Reference Bossart, Bernier, Birkholzer, Bruggeman, Connolli, Dewonck, Fukaya, Herfort, Jensen, Matray, Mayor, Moeri, Oyama, Schuster, Shigeta, Vietor and Wieczorek2017). Specifically, the OPA consists of incompetent, silty and sandy claystones that were deposited about 174 Ma ago (Fig. 1A) and intersected by a fault zone (up to 3 m wide) with a ~10 m reverse offset named the ‘Main Fault’. Considered as a blind thrust (Nussbaum et al., Reference Nussbaum, Kloppenburg, Caër and Bossart2017), this structure is interpreted as a secondary fault zone that has been transported passively into the hanging wall of the local anticline.
(A) Sketch of the Mont Terri folding with the locations of the rock laboratory (in white), the Main Fault (dotted red lines), and the Mont Terri tunnel (straight brown horizontal line) (modified after Clauer et al., Reference Clauer, Techer, Nussbaum and Laurich2017a); (B) sketch of the Swiss map with the locations of the rock laboratory (pink dot), the three drill cores at Benken, Herdern, and Kreuzlingen (black dots), and the main cities (white squares).

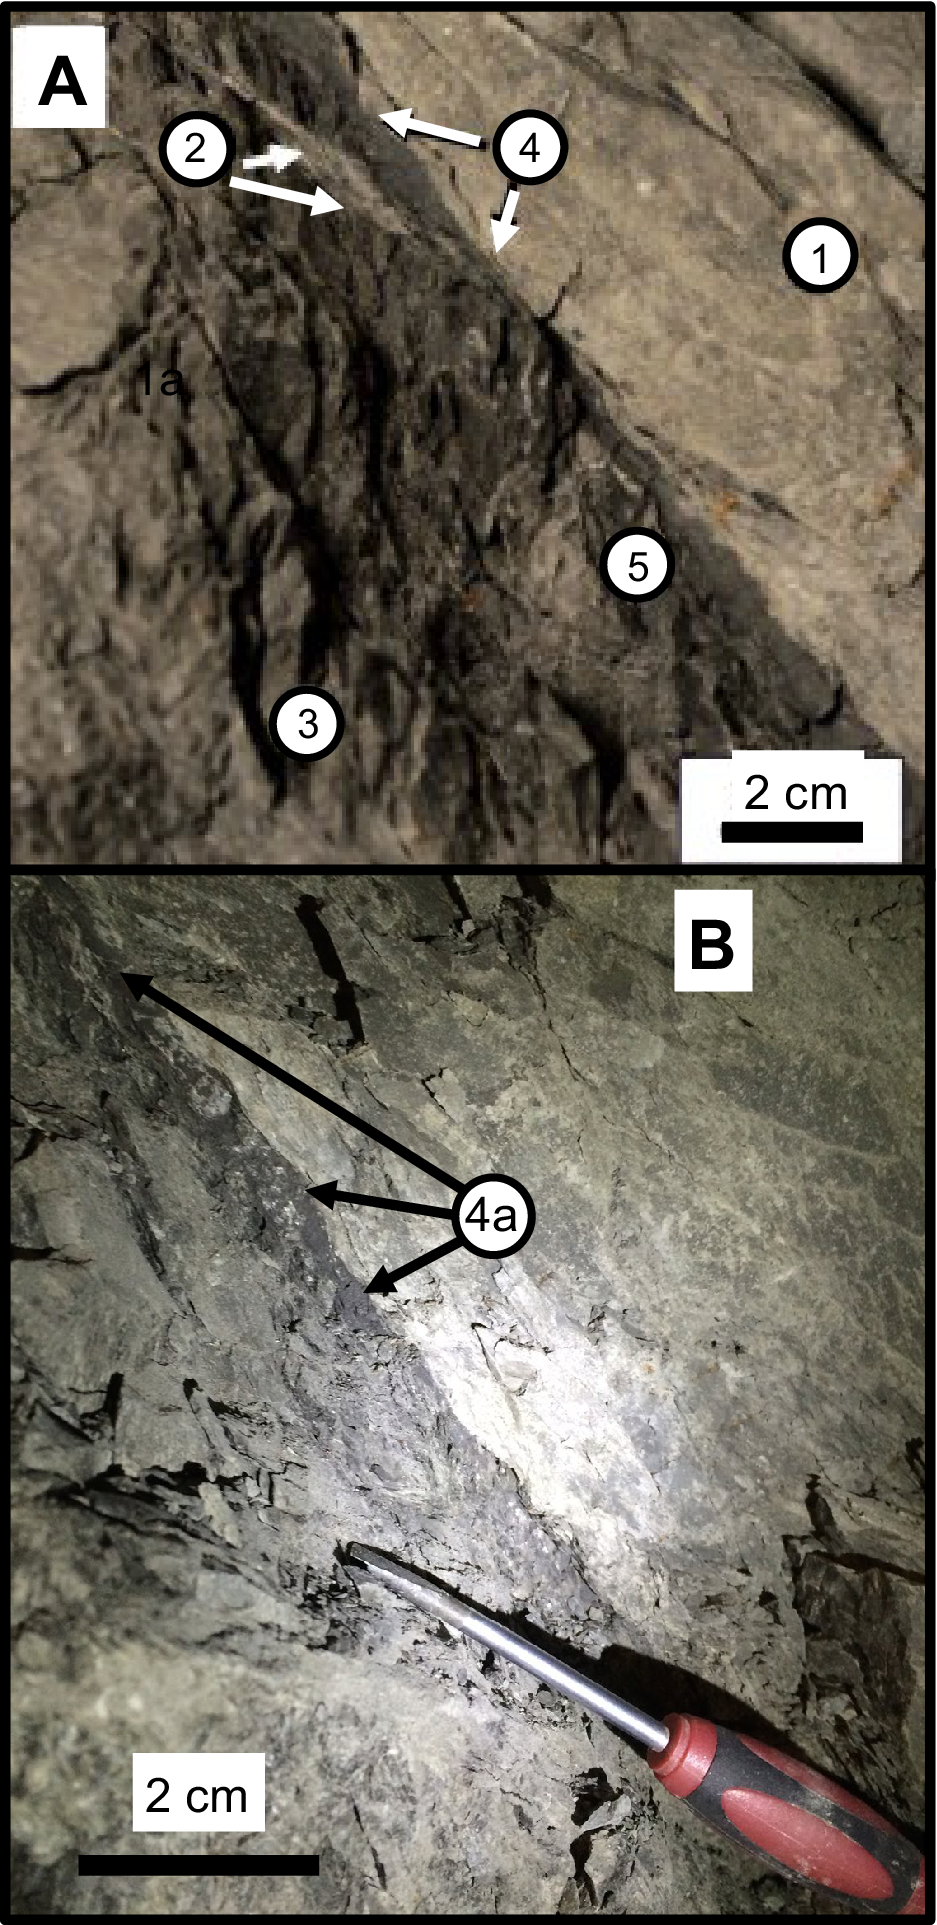
It is interpreted as the result of a detachment along the Rietheim Member of the Staffelegg Formation, while its timing has yet to be evaluated. From a geographical point of view, its location, as well as those of the additional selected samples from outside the laboratory, are widespread in northern Switzerland (Fig. 1B). The laboratory galleries provide a high-quality and unique outcrop to observe and study a fault zone intersecting a poorly permeable claystone, commonly affected by weathering at the Earth’s surface. The Main Fault is easily accessible and has been studied intensively and described extensively (e.g. Nussbaum et al., Reference Nussbaum, Amann, Aubourg and Bossart2011; Laurich et al., Reference Laurich, Urai, Desbois, Vollmer and Nussbaum2014; Laurich et al., Reference Laurich, Urai and Nussbaum2017; Nussbaum et al., Reference Nussbaum, Kloppenburg, Caër and Bossart2017; Jaeggi et al., Reference Jaeggi, Laurich, Nussbaum, Schuster and Connolly2018; Laurich et al., Reference Laurich, Urai, Vollmer and Nussbaum2018). It is characterized by discontinuous millimeter to centimeter-sized dark gouges and by sub-metric to metric scaly clay lenses/aggregates that can be considered to make up the fault core (Fig. 2A). Less deformed faulted blocks are also visible between the scaly clay lenses, consisting of a network of isolated slickensided fault planes often associated with millimeter-thick veins filled with calcite and/or celestite (Clauer et al., Reference Clauer, Techer, Nussbaum and Laurich2017a). The smaller gouges can often be identified optically by a slightly darker color than that of the surrounding undeformed lithology, presumably resulting from grain-size reduction and lower calcite contents (Laurich, Reference Laurich2015; Jaeggi et al., Reference Jaeggi, Laurich, Nussbaum, Schuster and Connolly2018; Fig. 2B). This facies consists mostly of clay-sized illite together with mixed-layer illite-smectite, kaolinite and chlorite, as well as of calcite occurring often as fossils and veins with quartz crystals (Pearson et al., Reference Pearson, Acros, Bath, Boisson, Fernández, Gäbler, Gaucher, Gautschi, Griffault, Hernán and Waber2003). The P-T conditions were variable throughout the formation of the OPA at the onset of the faulting. Evaluated by Mazurek et al. (Reference Mazurek, Hurford and Leu2006), the burial-induced thermal gradient was ~85°C km–1 in the eastern Herdern/Benken region relative to 30–35°C km–1 in the western area studied here.
(A) Recollection of the various studied OPA lithologies (modified from Clauer et al., Reference Clauer, Techer, Nussbaum and Laurich2017a). The numbers identify: (1) the undeformed OPA; (2) a vein filled with calcite; (3) scaly clays away from gouges; (4) gouges; (5) scaly clays away from gouges; (B) dark ‘smear’ gouge indicated by label 4a.

The challenge here is in the description and interpretation of the mineralogical changes occurring in various limited volumes by mineralogical and chemical data of gouges and of the associated highly deformed scaly clay lenses collected in and around the fault zone that are completed by very small illite-rich fractions in order to elaborate on their crystallization timing and formation conditions. The OPA was subjected, before the creation of the Jura fold-and-thrust belt, to temperatures of ~85°C during its Cretaceous maximal burial (Mazurek et al., Reference Mazurek, Hurford and Leu2006). A recent paleo-thermal study of the organic matter from these faulted OPA rocks also showed that its maturity was increasing next to the fault with a temperature estimate of at least 100°C that induced the crystallization of authigenic I-S. The calcite infillings of the gouges represent a supply, on top of a pressure-solution action, of fluids different from those of the vein and slickenside infillings, as well as from those of the diffuse OPA calcite around the veins (Clauer et al., Reference Clauer, Techer, Nussbaum and Laurich2017a). In turn, the tectonic activity responsible for the Main Fault was expected to be the driving force for such migration/injection of fluids.
The sampling
Twenty-one samples were selected for the present study, from various compositional and structural settings of the OPA formation within the fault volume, from the nearby sediments close to the Main Fault, as well as from undeformed facies and from scaly clays, a sheared facies in the Main Fault and from undeformed rocks far away from rock laboratory. This wide sampling was intentional to ensure a complete evaluation of the deformed material relative to undeformed rocks close to and far away from faulted rock volume, The selected samples cover the following distribution (Table 1):
-
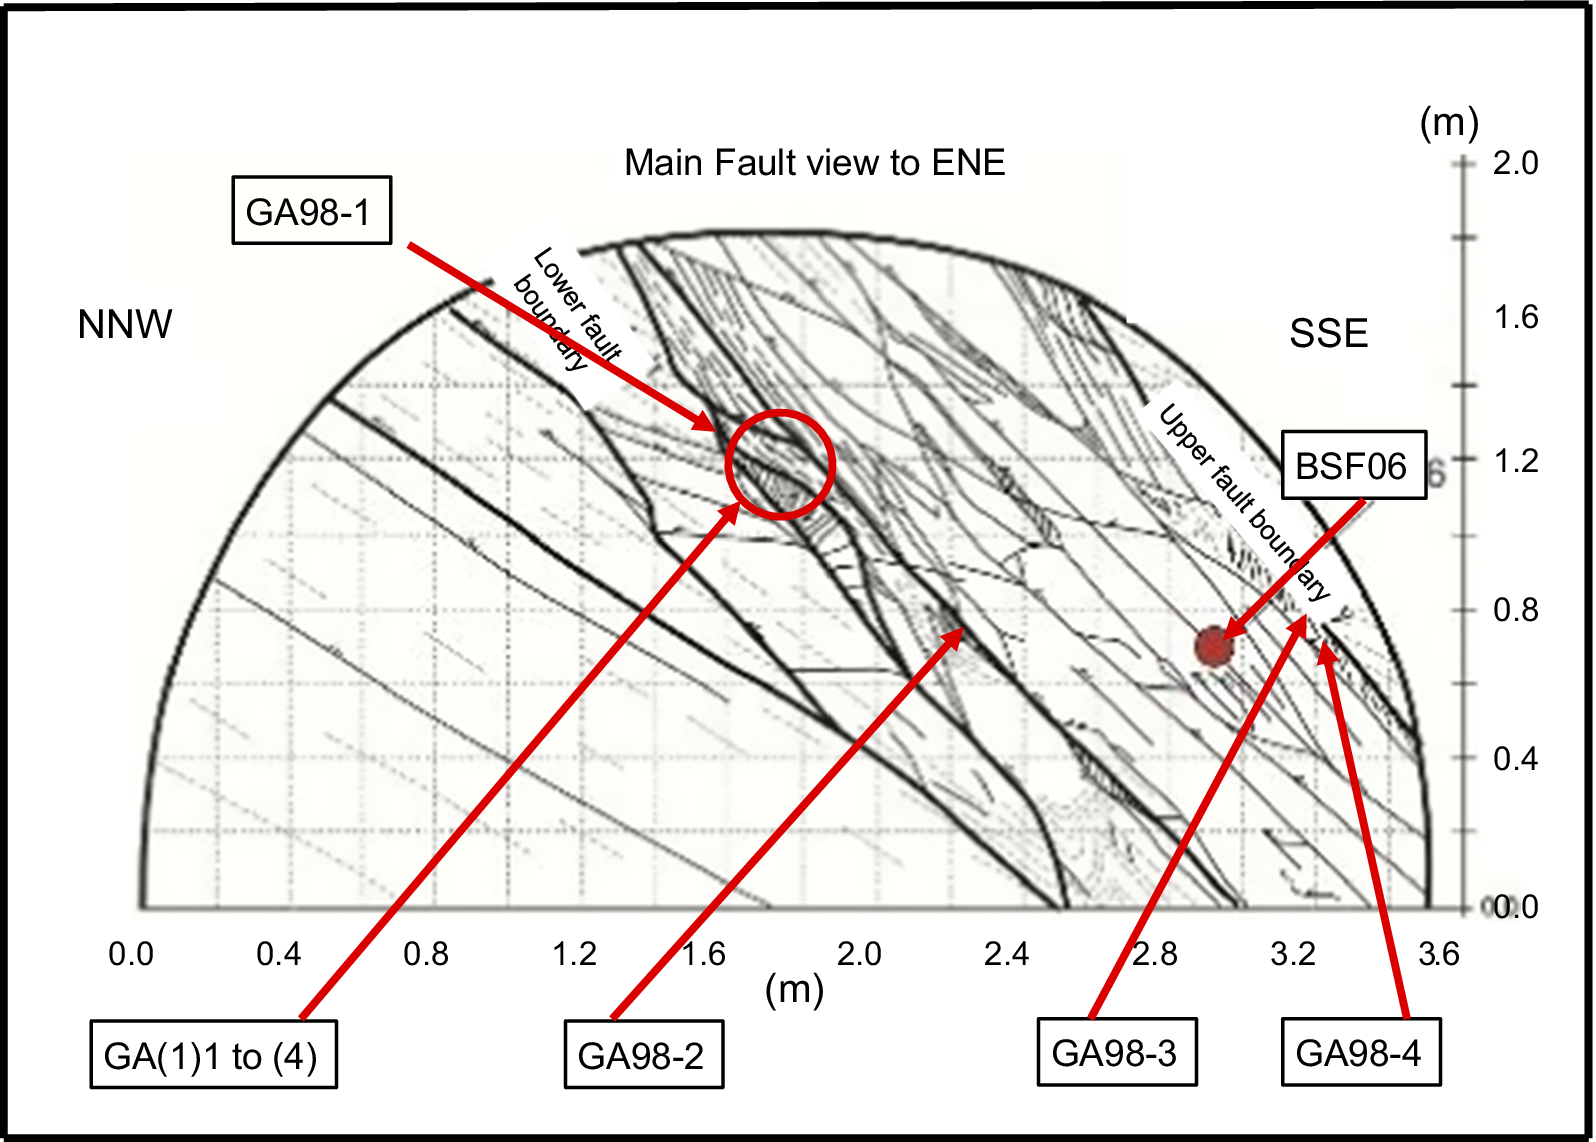
• Three slightly deformed OPA samples (C1, C2, and C3) were taken from cores of the BSF06 drilling into the fault (Fig. 3), as well as a sample (DR1) from a drill-core outside the Main Fault in gallery 98 of the rock laboratory, ~7 m away from any visible tectonic feature, as a further reference for the nearby undeformed OPA reference.
-
• Three highly deformed scaly clays (GA98(1), GA98(2), and GA98(4)) were collected from the Main Fault at the wall of gallery 98 from the rock laboratory (Fig. 3).
-
• Four small, dark, smeared gouges (GA98(1) to GA98(4)), as well as two highly deformed scaly clays (GA08-115 and GA98-70(3)) belong to the fault in the connected galleries 98 and 08 of the laboratory.
-
• Two more OPA samples were taken below the laboratory, in the BDB1 drilling directed from the laboratory toward the Staffelegg Formation; the slightly deformed BDB1-07 sample was collected at a depth of 236.5 m, close to the sliding sole of the Staffelegg unit; the other sample (BDB1-05), taken at a depth of 245.2 m, yields a scaly clay facies with visible pyrite and calcite crystals.
-
• Two further samples were collected outside the rock laboratory ~15 km to the west for a check of the regional evaluation of the faulting impact on sediments associated with the OPA; sample BDS-5/1 was collected on the BD-5 drilling at a depth of 91.9 m, just above the fault at the contact between the OPA and the marls and limestones below, as a slightly deformed OPA sample within the faulting zone, while the second sample BDS-5/2 was taken next to it at a 89.1 m depth in the same BD-5 drilling as local undeformed OPA just above the previous sample.
-
• Four supplementary samples were collected at a significant distance away from the laboratory as undisturbed references for comparison with the impact by the faulting on the OPA (Fig. 1B). Two, identified as Be1 and Be2, were collected from a core taken from a borehole near Benken, ~50 km to the East of Mont Terri in a carbonate-rich layer at a 571.4 m depth and from a clay-rich layer at a 645.1 m depth. The final two samples were taken, also in northeastern Switzerland, at a depth of 1727.1 m from a drill-hole at Herdern (referred to as He) and from a drill-hole near Kreuzlingen at a depth of 2173.4 m (referred to as Kr).
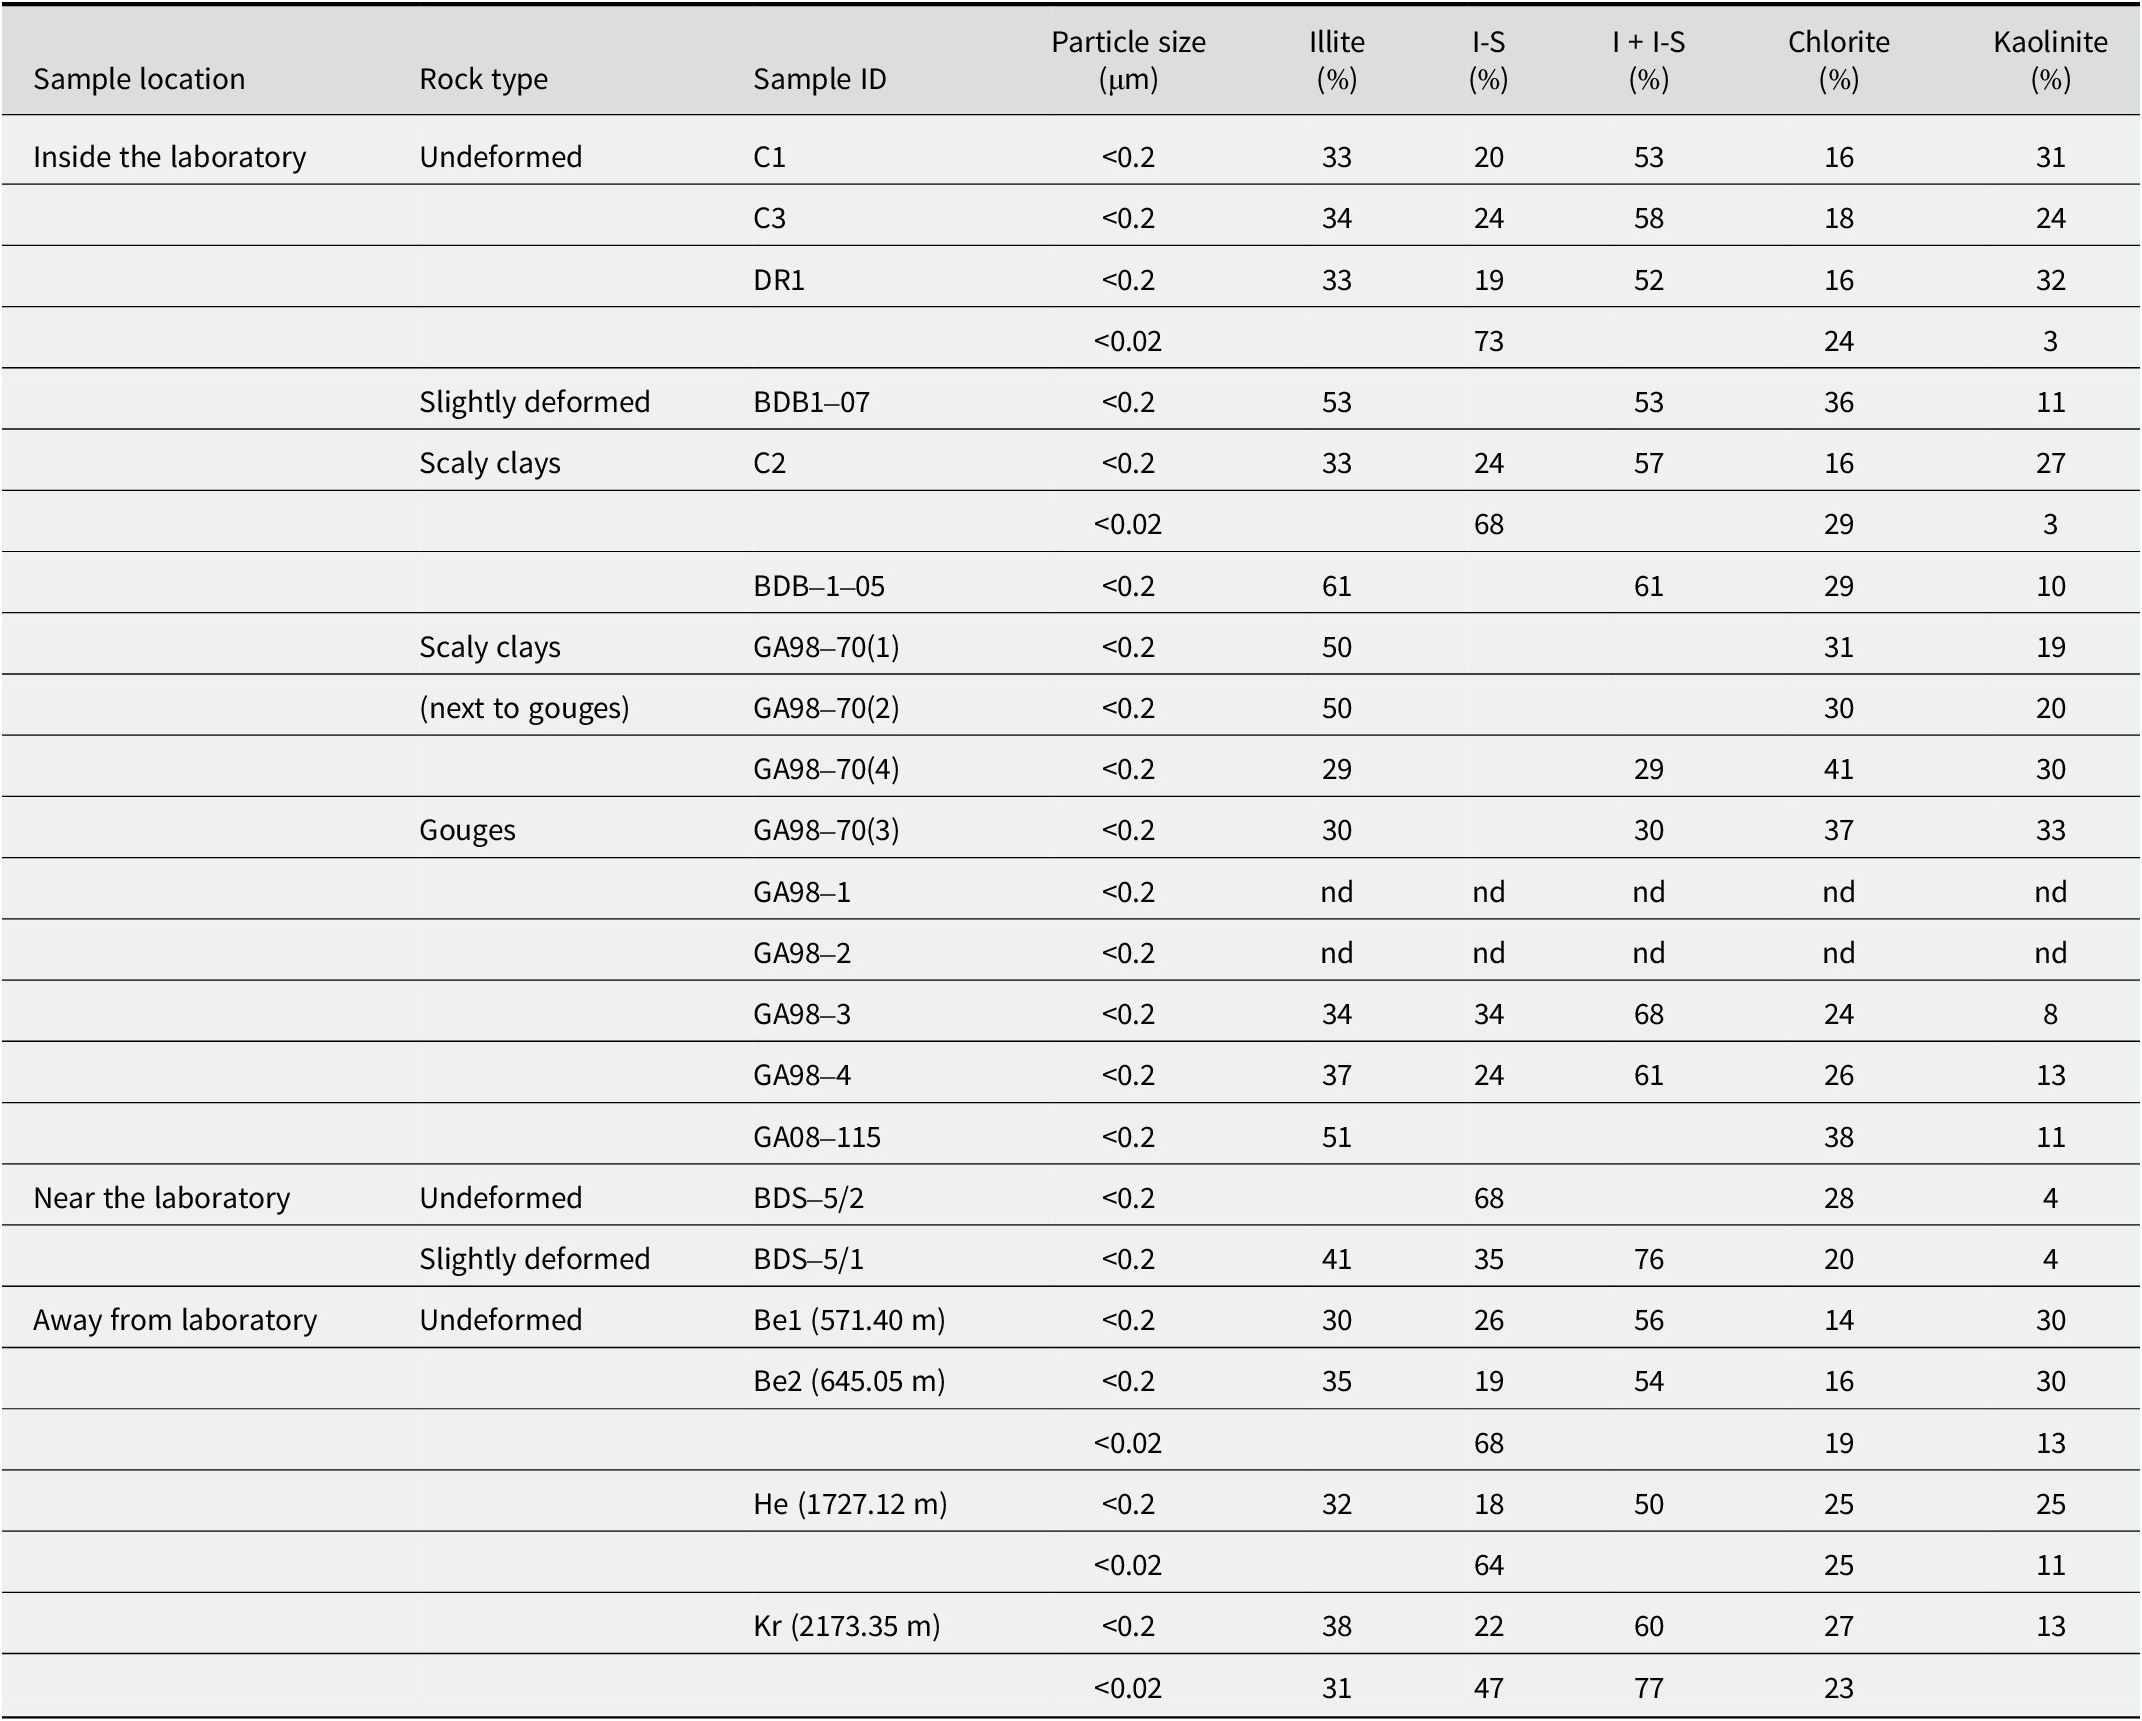
XRD data of the analyzed <2 μm, <0.2 μm, and <0.02 μm size fractions of the selected samples

nd=not determined.
Locations of the samples collected from the Main Fault visible in gallery 98 from the rock laboratory (modified after Laurich et al., Reference Laurich, Urai, Desbois, Vollmer and Nussbaum2014).

Not all of these samples were analyzed systematically by all the methods used. Analyses were completed depending on the information expected from each material in order to combine the best into a coherent history of the various structural features from the fault environment and surroundings; special attention was given to the gouge facies.
The analytical procedure
A scanning-electron microscope (SEM) with a cold-field emission gun at a 3 kV acceleration voltage and a working distance of 10 mm was used for detailed preliminary observations of some of the selected samples. Energy dispersive X-ray spectroscopic analyses were also obtained with a SiLi diode and a 15 kV acceleration beam. Images of the dispersed particles were collected using a secondary electron beam at 30 kV and a STEM detector at a working distance of 8 mm. To constrain the analytical precision as well as possible, the analyses were calibrated relative to albite, olivine, orthoclase, andradite, and spinel minerals as references.
Several analytical transects were carried out with an electron microprobe from which ~100 in situ chemical analyses of illite-type crystals were selected on the basis of arbitrarily constraining criteria such as <0.5% Na2O, <5.0% MgO, 6.5% K2O, 2.0% CaO, 2.0% TiO2 and 0.3% MnO. The Fe2O3 content allowed was set between 5.0 and 7.0% and the total elemental content had to be >85% for each selected analysis, considering that the analysis also had to include a loss on ignition of ~10% on the basis of the wet chemistry.
Small rock chips were gold- or carbon-coated for microscopic examination and specific slides were manufactured for the energy-dispersive X-ray (EDS) analyses and the micro-X-ray fluorescence (μXRF) mapping; analyses were obtained on a 5-mm thick section of the GA98(4) gouge. The X-ray tube consisted of a Rh anode operating at 400 μA with an acceleration voltage of 50 kV. Two EDS detectors with a resolution of <145 eV were used simultaneously to measure the fluorescence spectra. Chemical maps were recorded with a 30 μm step interval in both of the X–Y directions and a dwell time of 300 ms per pixel. The color scale added next to each map corresponds to the intensity of the Kα lines of the various elements analyzed. Detailed descriptions of the equipment and of the maps used to identify the mineral phases based on a routine MATLAB code were given by Ulrich et al. (Reference Ulrich, Munoz, Guillot, Cathelineau, Picard, Quesnel, Boulvais and Couteau2014).
For the wet chemistry, the whole-rock samples were successively hand-crushed gently into centimeter-sized chips, dispersed in deionized water, and disaggregated using the freeze-thaw technique (Liewig et al., Reference Liewig, Clauer and Sommer1987). The slurries obtained were treated with dilute Na-acetate buffer, Na dithionite, and H peroxide to remove the soluble mineral phases and the organic matter from silicate-type minerals, following Jackson’s (Reference Jackson1975) procedure. The <2 μm fraction was then separated from the treated whole-rock slurries by gravimetric settling in deionized H2O following Stokes’ law, while the <0.2 μm fractions were extracted and concentrated by centrifugation afterward. For a few further <0.02 μm separations, some recovered <0.2 μm slurries were diluted extensively at a concentration of 1 g per 40 L of deionized H2O to ensure an infinite osmotic swelling by continuous-flow high-speed ultra-centrifugation. The smallest <0.02 μm size fractions were then recovered from fluids by flocculating the suspended mineral matter with NaCl (1 M) and by afterward removing the excess electrolyte by repeated centrifugation and dialysis, following Środoń et al. (Reference Środoń, Elsass, McHardy and Morgan1992). Of course, any possible NaCl contamination was carefully controlled at the end of the procedure.
Each separated size fraction was analyzed subsequently four times by X-ray diffraction (XRD) to identify its mineral composition: air-dried, after treatment with ethylene glycol and a hydrazine-monohydrate impregnation for 12 h, and after heating at 490°C for 4 h (e.g. Brindley and Brown, Reference Brindley and Brown1980). The analyses were carried out on a diffractometer operated at 40 kV and 20 mA at a scanning rate of 0.02° 2θ/min with CuKα radiation. The powdery size fractions were then analyzed for their major element contents and some trace elements by inductively coupled plasma-atomic emission spectrometry (ICP-AES), the rest of the trace elements being determined together with the rare-earth elements (REEs) using inductively coupled plasma-mass spectrometry (ICP-MS). All sample handling and analyses followed the preparation, analytical and control procedures of Samuel et al. (Reference Samuel, Rouault and Besnus1985).
The powder of most size separates was also analyzed by the K-Ar method. The procedure applied to the coarser analyzed size fractions is that described by Bonhomme et al. (Reference Bonhomme, Thuizat, Pinault, Clauer, Wendling and Winkler1975), the Ar of the few nanometer-sized fractions being measured at CSIRO (Australia) following a similar analytical procedure. The selected samples were pre-heated at 80°C under vacuum for at least 12 h to remove the atmospheric Ar adsorbed on the particles during sample preparation and handling. The samples were then fused in a high-frequency furnace coupled to a glass line where the gases were purified and to a gas mass-spectrometer in which the Ar was analyzed. The reproducibility of the procedure and the accuracy of the results were controlled by periodic measurements of the GL-O international standard, atmospheric Ar loads, and the residual blank of the coupled extraction line and mass spectrometer. During the study, the radiogenic 40Ar of the GL-O standard amounted to 24.73±0.50 (2σ)×10–6 cm3 g–1 for six independent determinations, while the 40Ar/36Ar ratio of the atmospheric Ar averaged 298.5±4.5 (2σ), also for six independent determinations. The recommended values of the reference GL-O standard being 24.85±0.24×10⁻⁶ cm3 g–1 radiogenic 40Ar (Odin et al., Reference Odin1982) and 298.6±0.4 for the atmospheric 40Ar/36Ar ratio (Lee et al., Reference Lee, Marti, Severinghaus, Kawamura, Yoo, Lee and Kim2006), no discrimination corrections were applied to the individual determinations. Also, the amount of the 40Ar from blank analyses of the coupled mass spectrometer and extraction line never exceeded 1×10⁻⁸ cm3. The K contents were determined by flame spectrophotometry with an overall analytical uncertainty of better than 1.5%. The recommended decay constants were used for the age calculation (Steiger and Jäger, Reference Steiger and Jäger1977) with an analytical precision of better than ±2%. Note that a closed-system behavior of the analyzed minerals is required, as for any isotopic dating method, which is, of course, especially crucial in the case of K-Ar dating of nanometer-sized crystals. Indeed, Ar is not bound to other atoms or ions in the mineral structures like the other basic radiogenic isotopes. It is only squeezed into the mineral structure due to its large ionic radius, making it particularly susceptible to removal by any incipient alteration change often related to temperature increase.
Results
Examination by electron microscopy
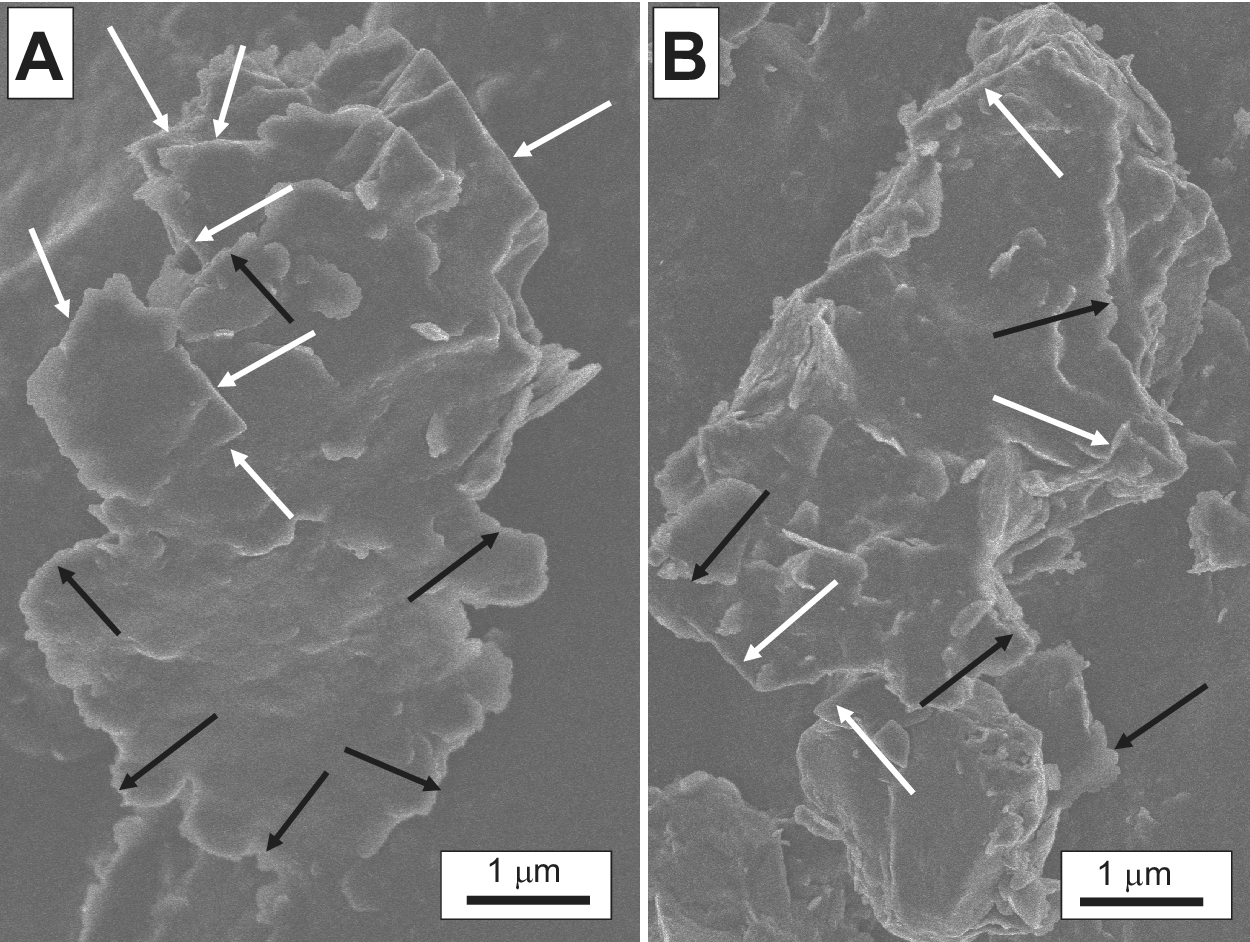
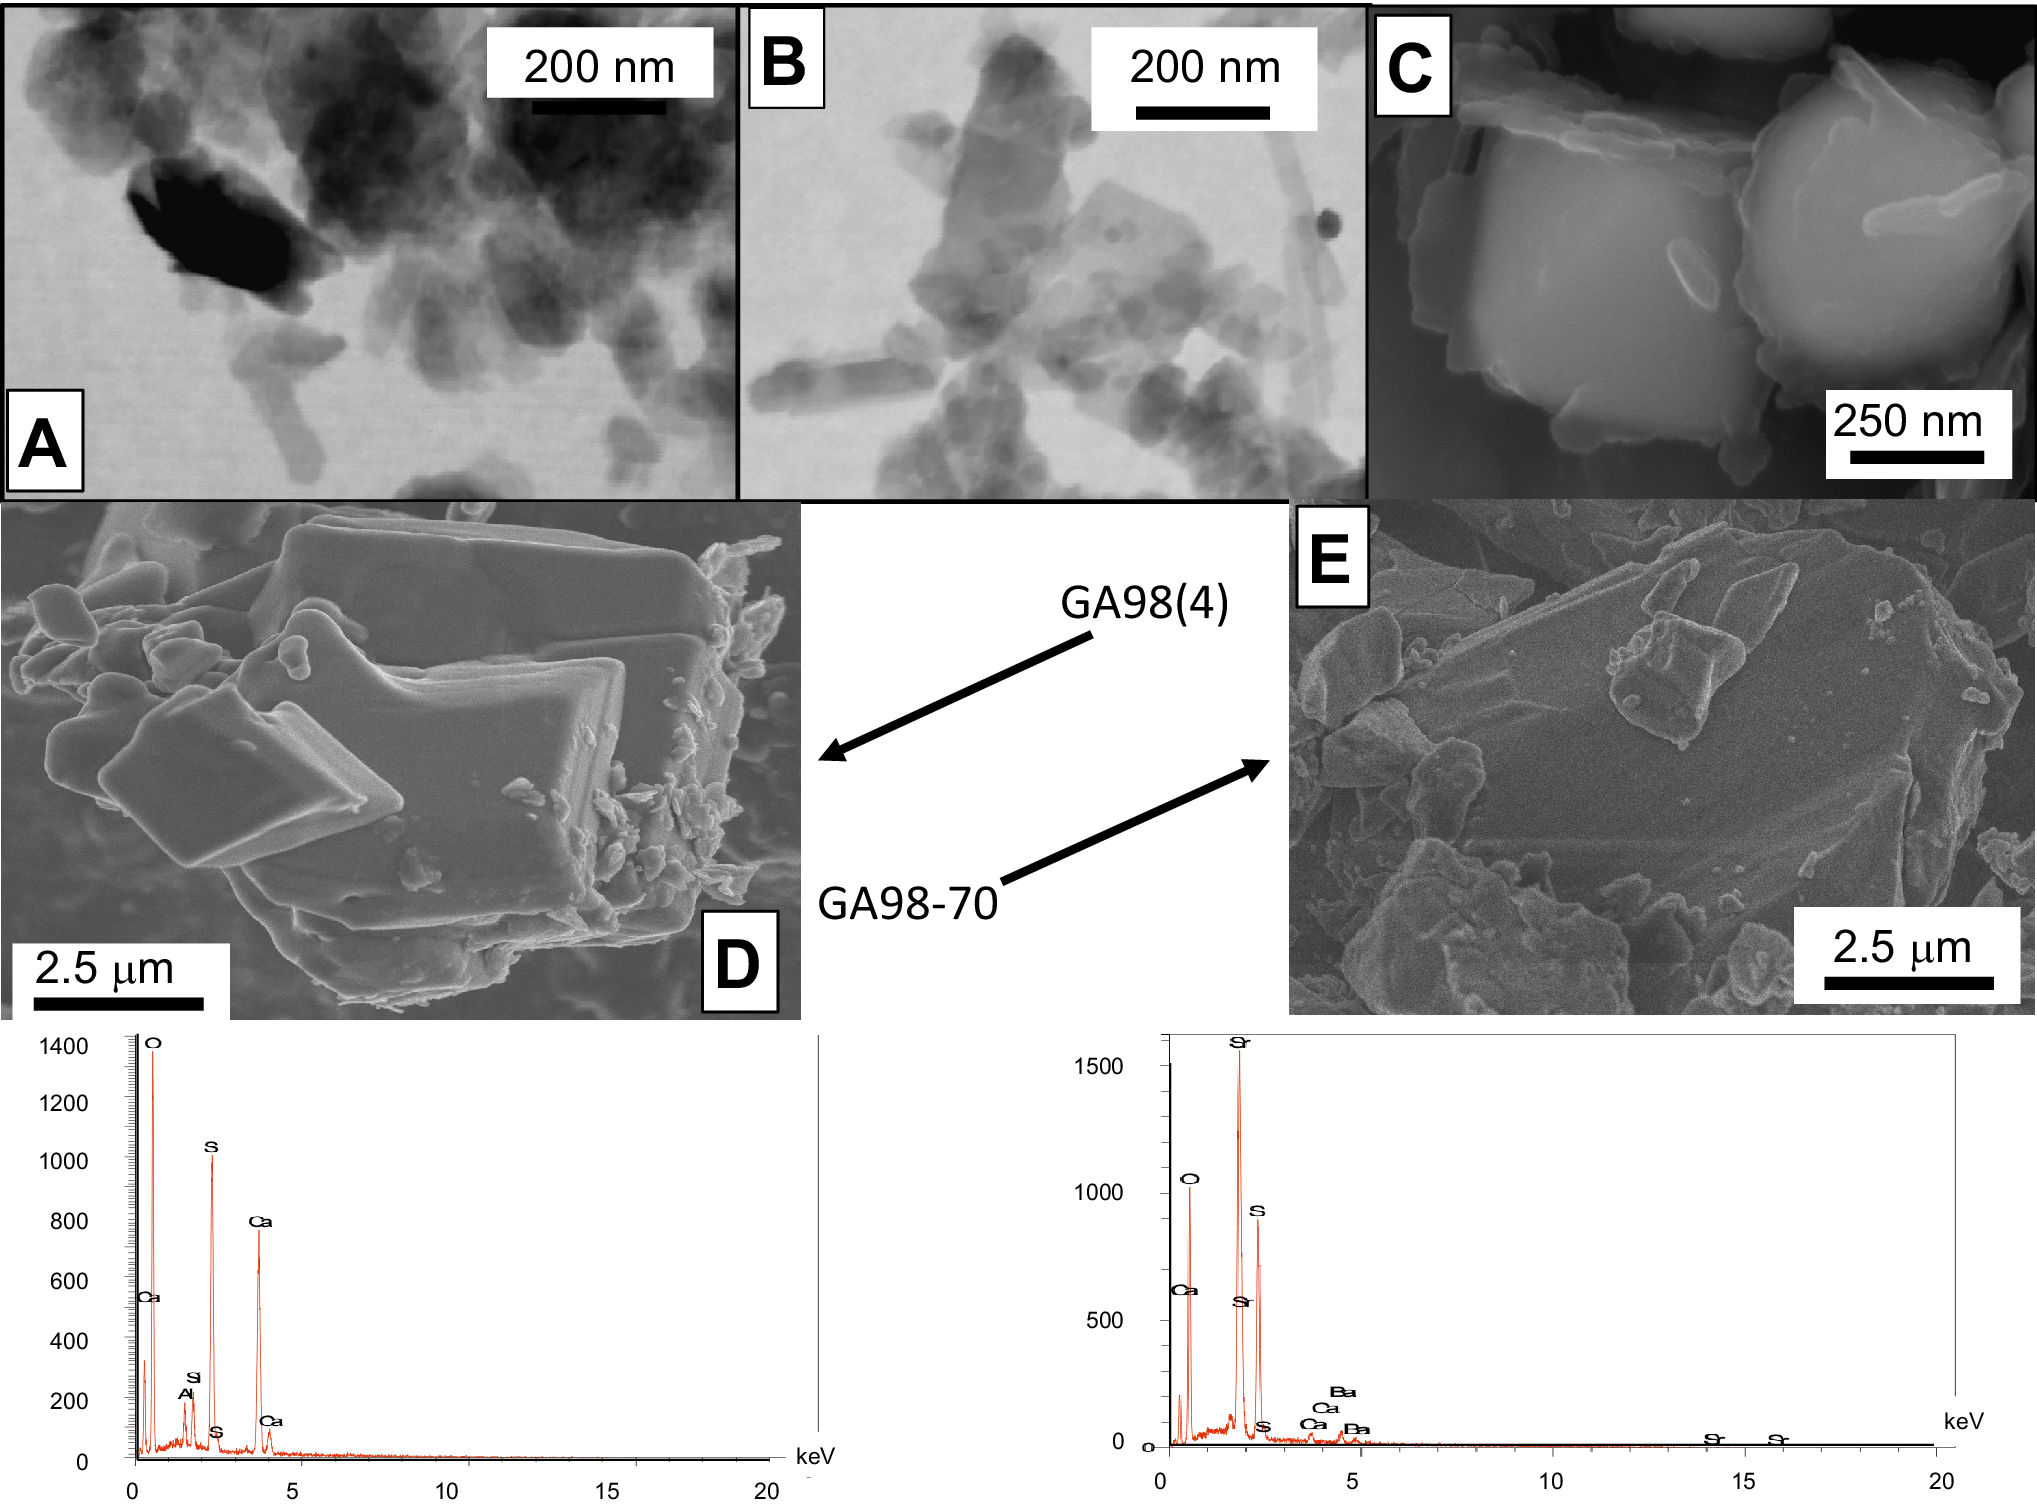
Examination of the gouge and scaly-clay samples by SEM showed millimeter-sized crystals with straight and/or diffuse edges (Fig. 4A,B). No completely independent authigenic precipitates with only straight borders were detected in the open voids, whereas TEM observations showed thin idiomorphic crystals overgrowing thicker particles with diffuse borders (Fig. 5A,B). Note that McCarty et al. (Reference McCarty, Sakharov and Drits2008) already described such mixed agglomerates of illite-smectite (I-S) in Gulf Coast sediments, showing that nucleation of smectite-rich particles can occur on detrital crystals or composite grains and not in interlayer or open sites of detrital sheet silicates. Consequently, a straight authigenesis of I-S crystals can be excluded here as a complete dissolution-crystallization of the co-existing detrital material obviously did not occur, as visible in the TEM images (Fig. 5C).
Clayey agglomerates of intergrown detrital and authigenic illite crystals from sample BDB1-07. The white arrows indicate the authigenic overgrowths and the black arrows denote the detrital components.

(A,B) TEM images of clay crystals from samples GA98(4) and GA98-70, respectively; (C) SEM image of pyrite crystals from sample 98-70 wrapped in a veil consisting mostly of P as shown in Fig. 8; (D) SEM image and analytical spectrum of gypsum from sample G98-04; (E) SEM image and analytical spectrum of celestite from sample BDB1.

Authigenic gypsum grains were also identified directly in the gouge G98(4) by their chemical in situ spectrum (Fig. 5D), as well as isolated idiomorphic celestite grains in the slightly deformed BDB-5/1 sample by their in situ chemical spectra (Fig. 5E).
XRD data of the powders
The <0.2 and <0.02 μm size separates are characterized by: (1) illite-smectite mixed layers (hereafter I-S) in the smallest <0.02 μm fractions; (2) 50–76% illite and illite-rich I-S, together with 14–41% chlorite and 7–33% kaolinite in the <0.2 μm fractions (Table 1); (3) kaolinite in the <0.2 μm fractions but not in the smaller <0.02 μm fractions except in samples collected ~50 km away from laboratory; (4) dispersed chlorite without any specific trend; and (5) an occasional occurrence of accessory minerals such as quartz and feldspars. In summary, the XRD analyses did not point to determining differences between the varied size fractions of the undeformed OPA, the scaly clays, and the gouges in and around the rock laboratory. Collected in, near, or away from the fault system, and within, close to, or far away from the rock laboratory, the size fractions contain similar mineral associations except those of the Herdern site located >50 km away from the fault system which contain more chlorite than the other separates.
Energy dispersive X-ray spectroscopic data
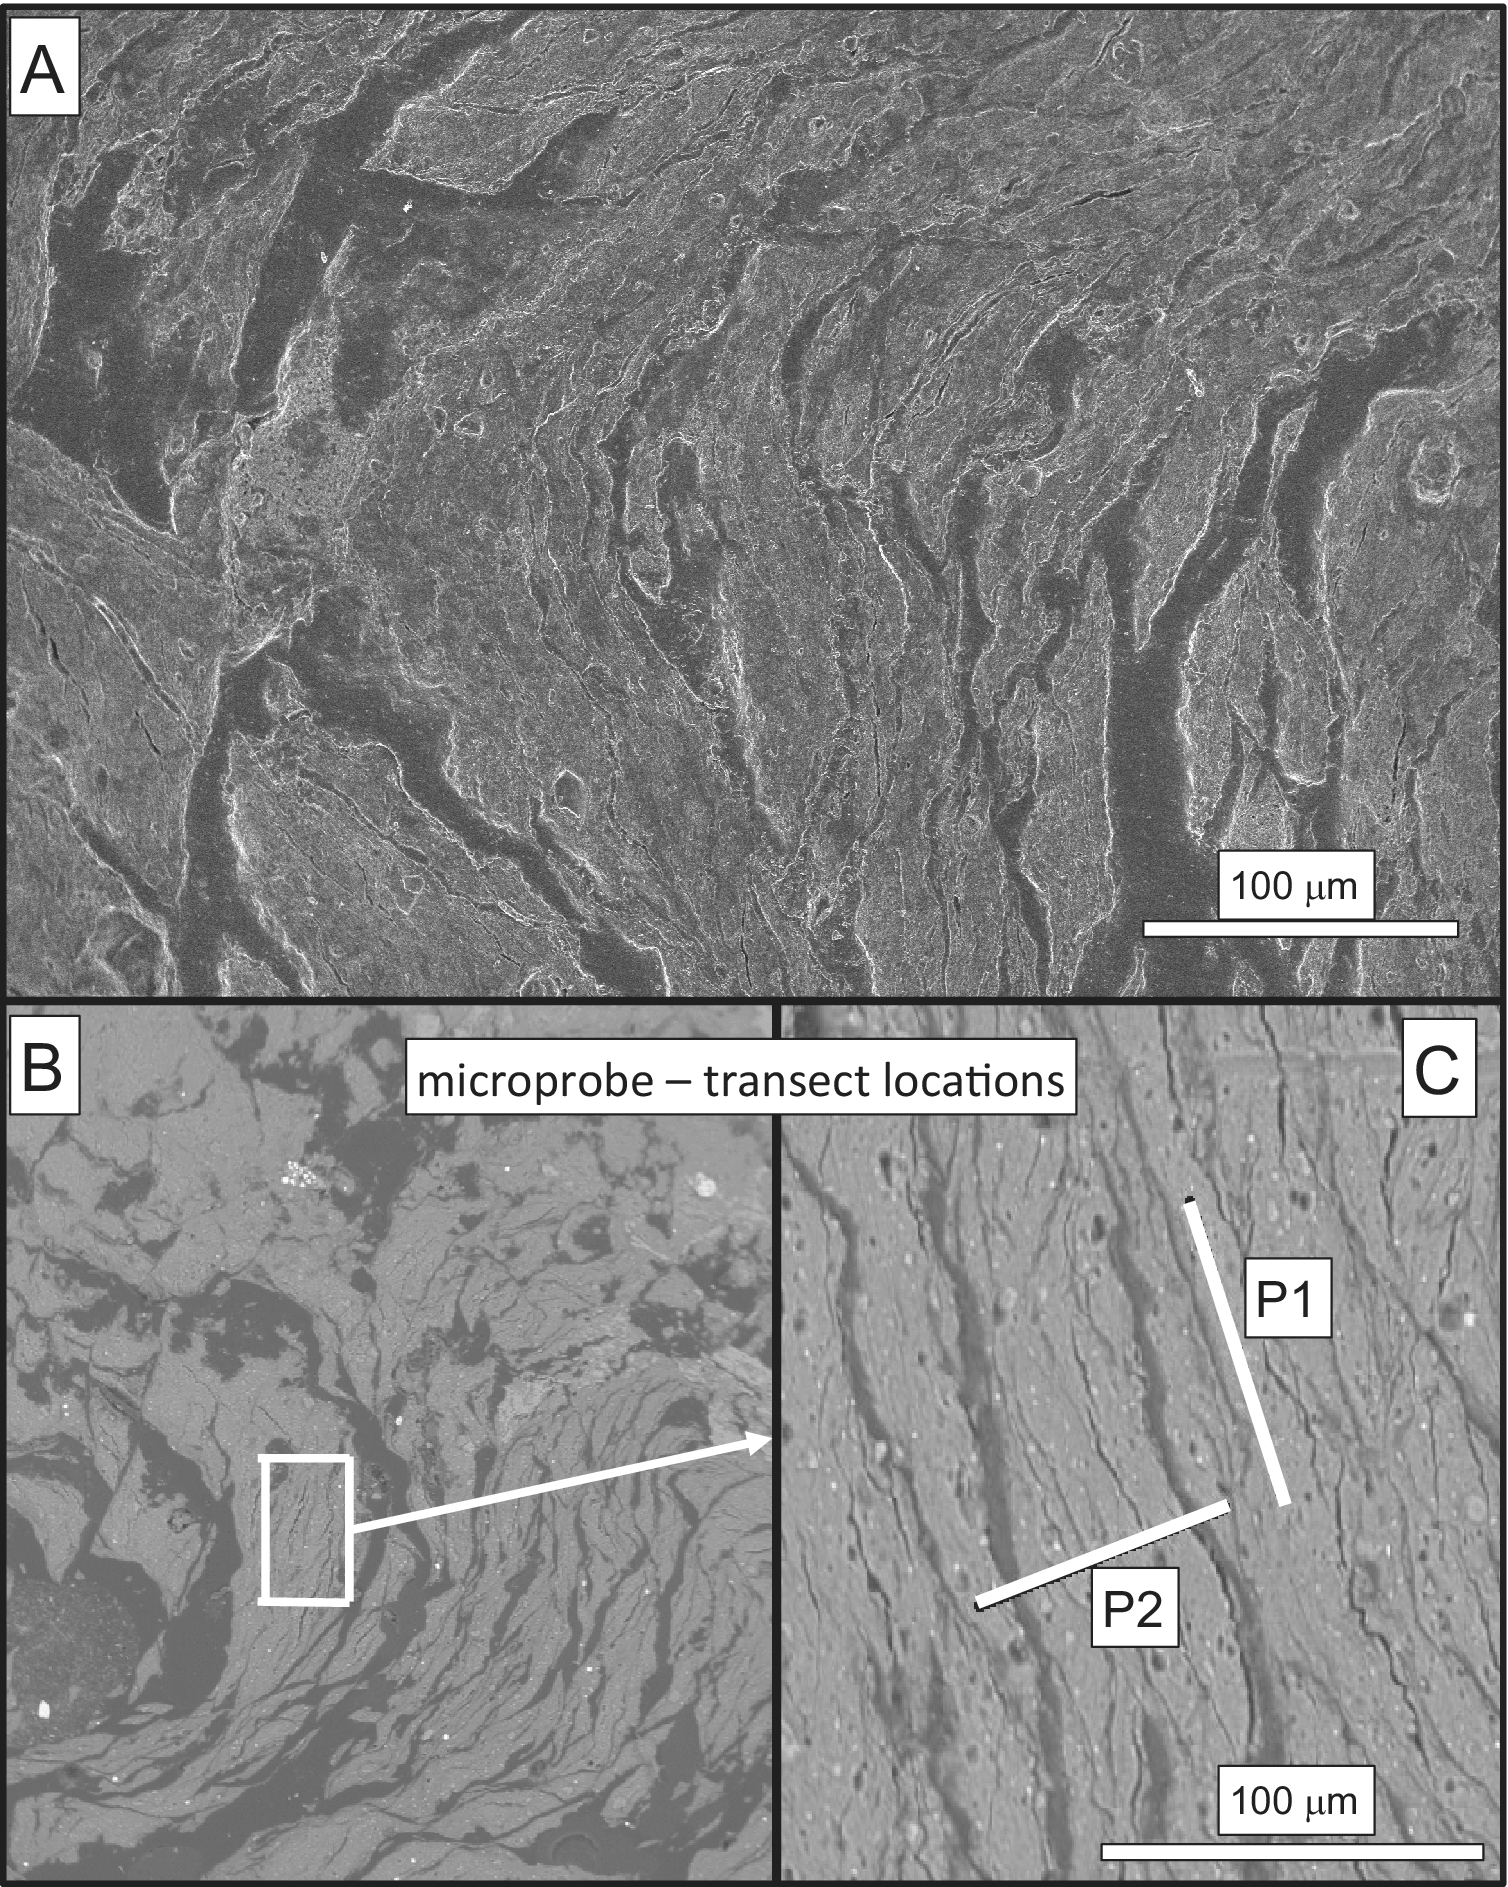
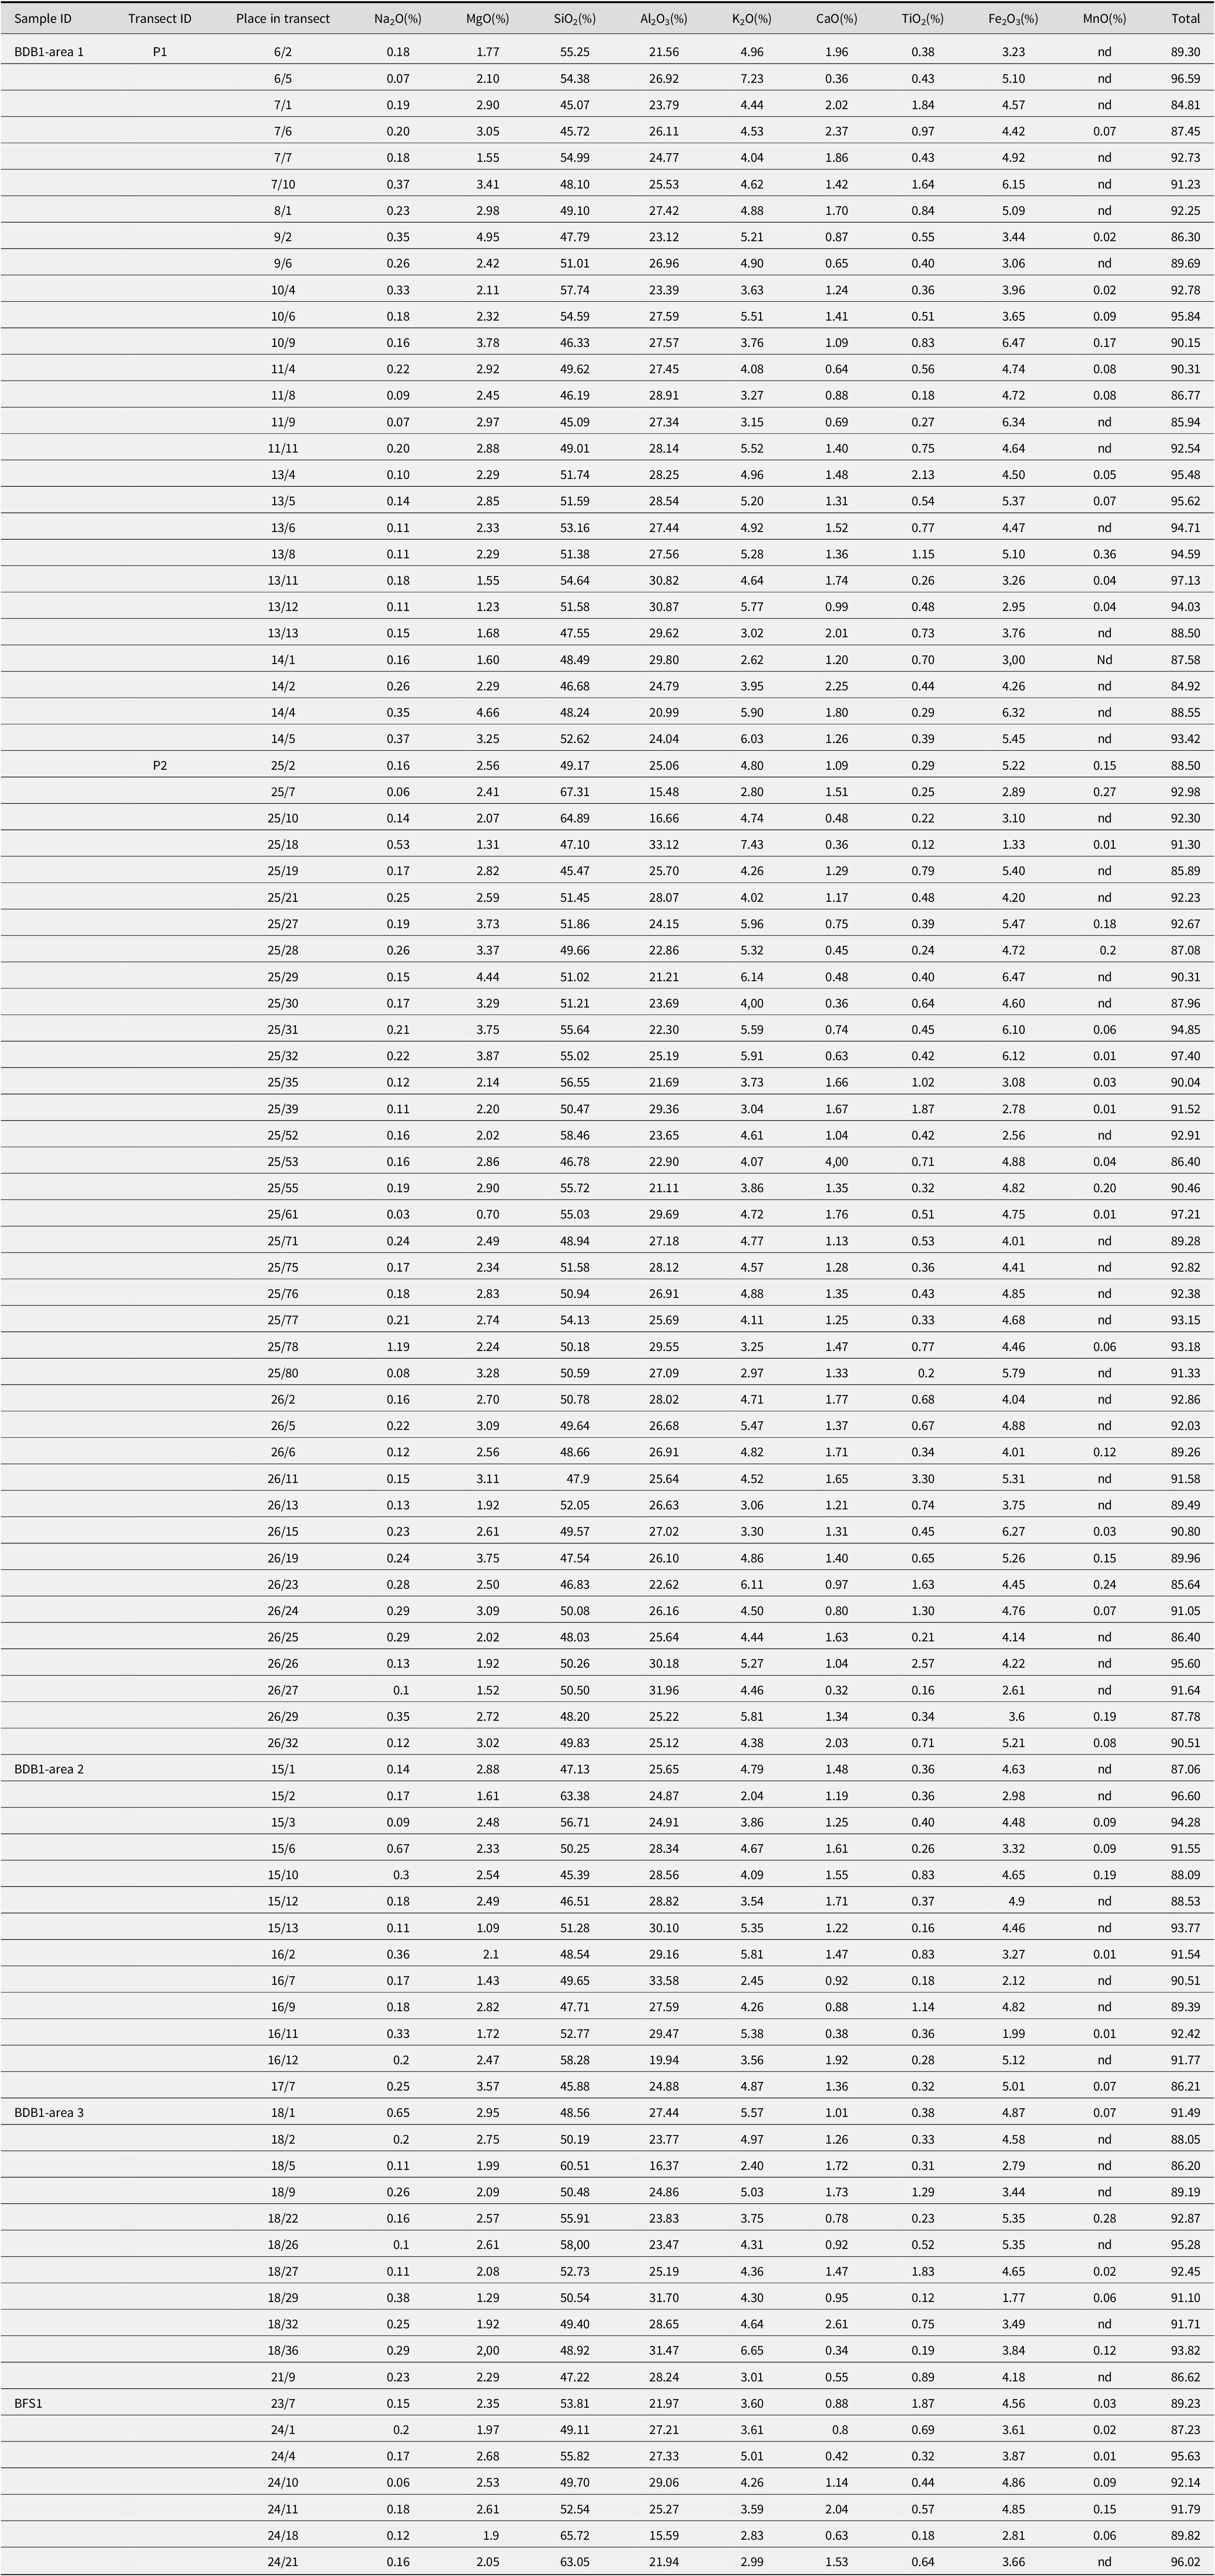
One of the goals of the present chemical study was the determination of two potential generations of illite crystals. In situ spectroscopic analyses were completed along transects in highly deformed scaly clays, as well as along transects in the undeformed OPA for a comparison of elemental variations that could correspond to detrital vs. authigenic trends. In fact, the polishing step of the sample surfaces for the X-ray spectroscopic analyses encountered unexpected problems as most of the samples, even those apparently undeformed, crumbled into small centimeter to millimeter-sized imbricated lamellae due to the earlier fault shearing (Fig. 6A). As the best-polished sample chips were those from core BDB1, the spectroscopic analyses of the scaly-clay lithology were completed along two nearby transects in one area and randomly in two other nearby locations (Fig. 6B). One of the two transects was set parallel to the rock structure and the second perpendicularly, across three successive lamellae. A polished piece of rock from undeformed OPA matrix of sample BDB1 within the Main Fault was also used for further determinations (Table 2).
(A) The heterogeneous surface of sample BDB1-07 where the ion microprobe analyses were carried out; (B) enlargement of the spot where the analyses were obtained; (C) the two white bars indicate the trajectories along which the analyses were carried out.

Ion microprobe data of the various spots along the two selected transects

nd=not detected. More details about the individual locations of the spots are available from authors upon request.
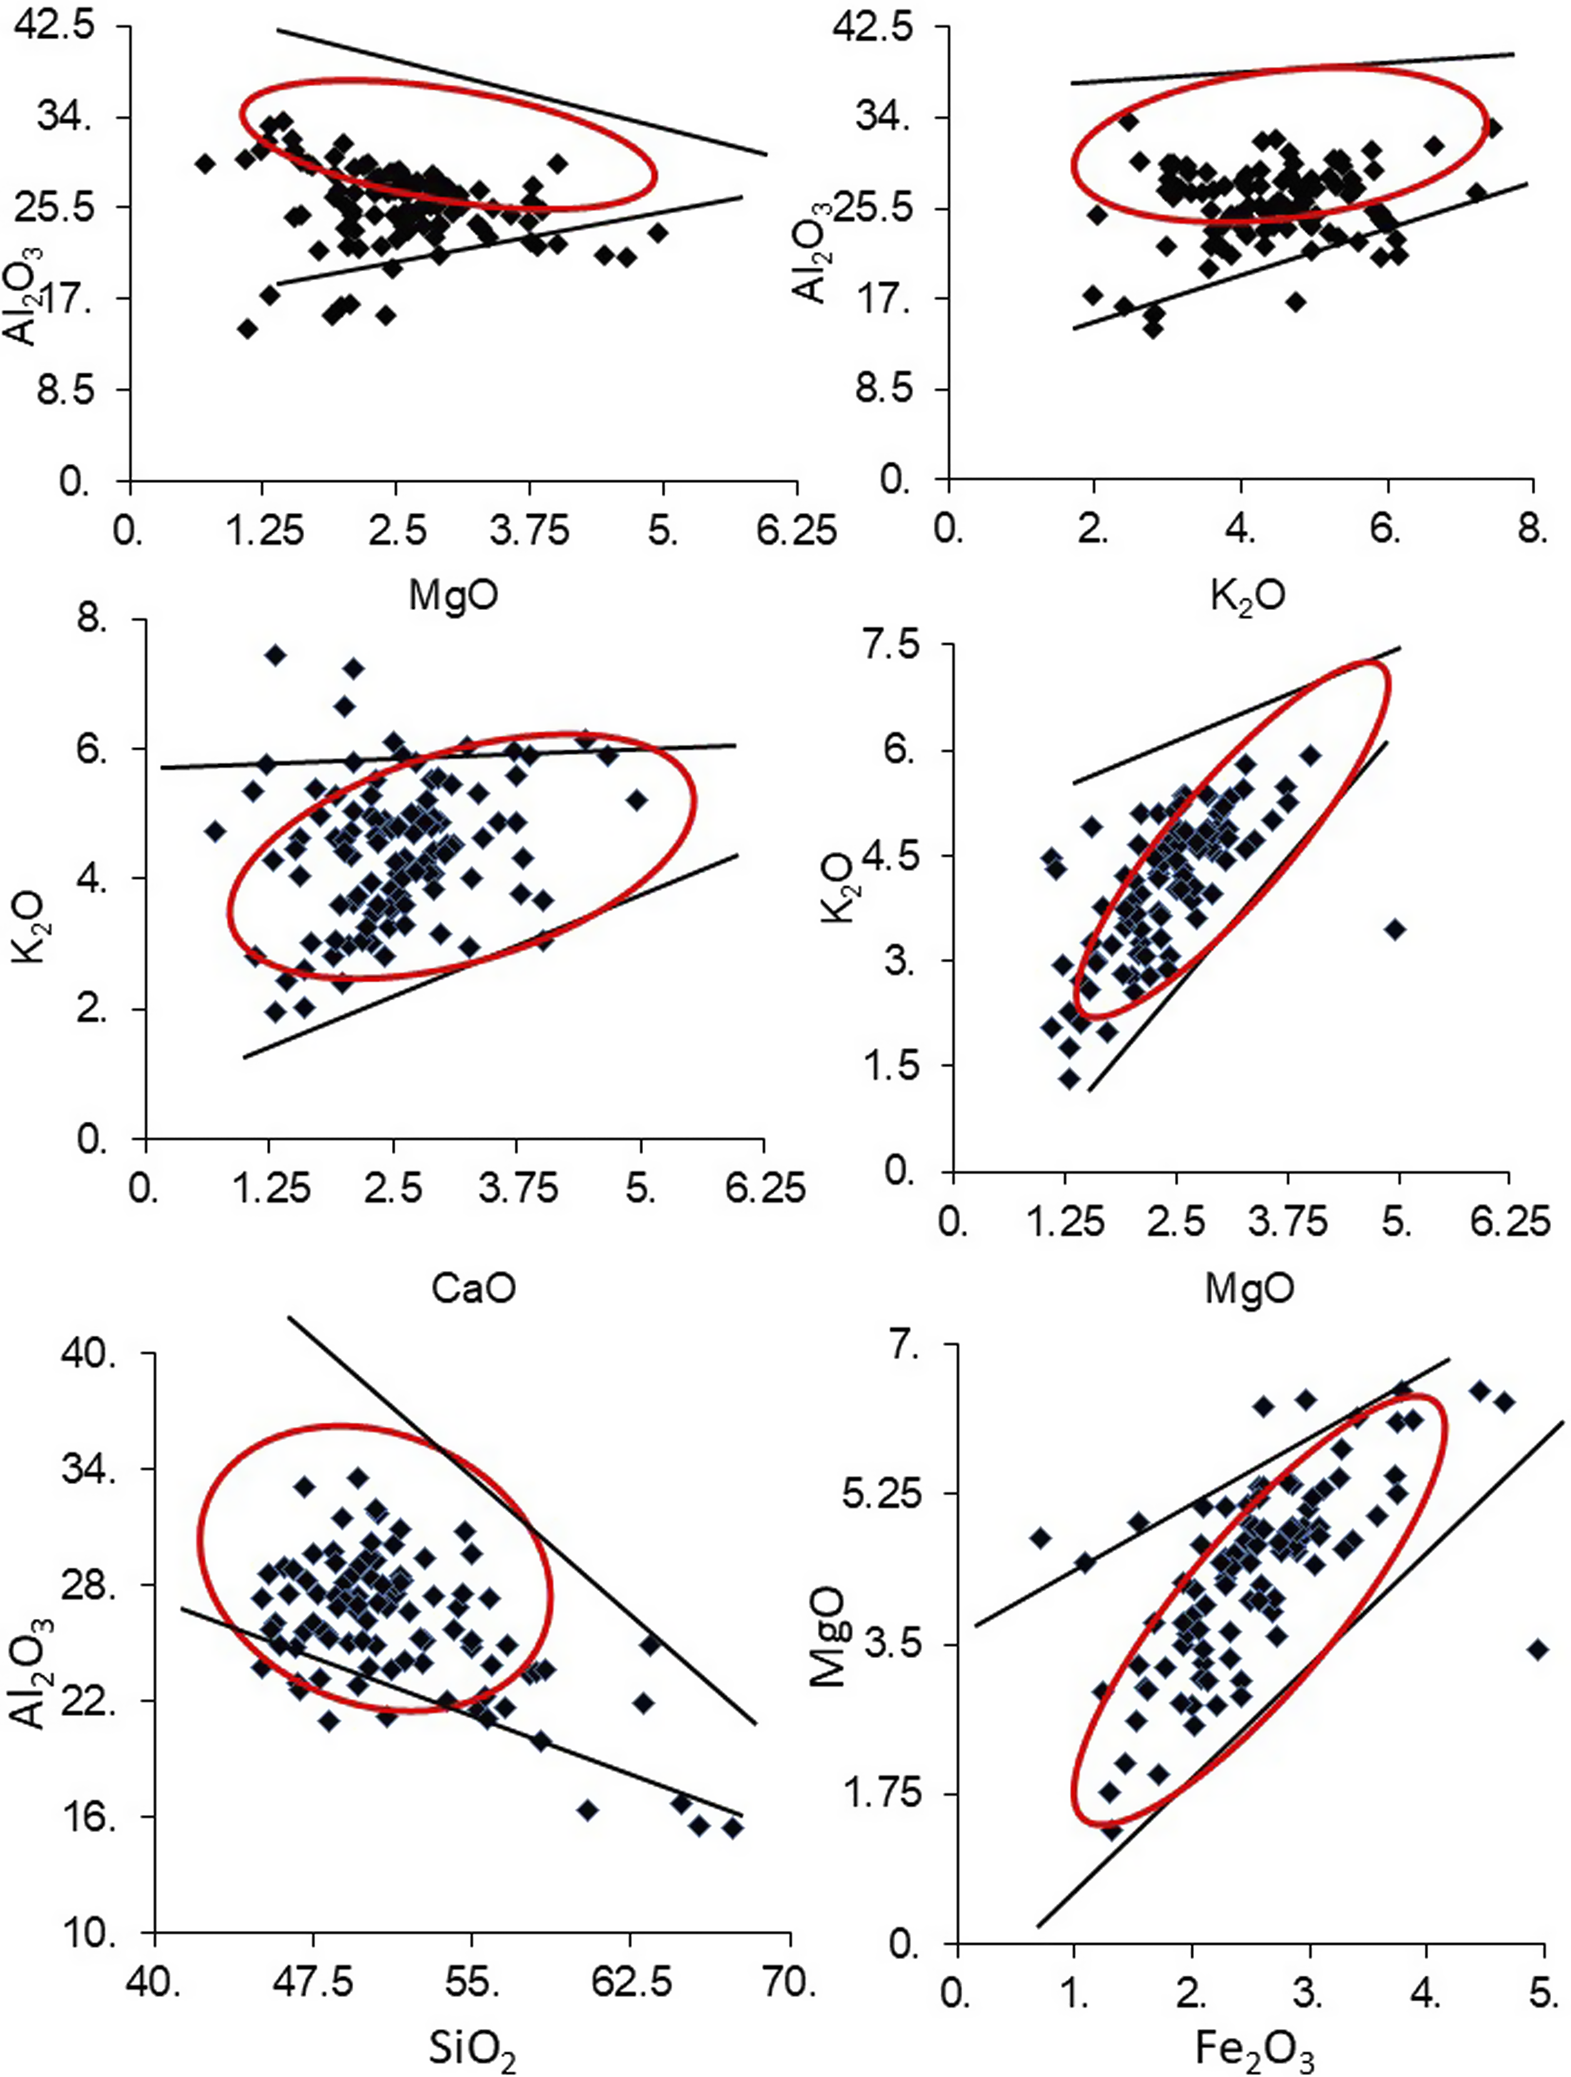
The data selected from various elemental amounts showed a fairly homogeneous SiO2 vs Al2O3 correlation for most analytical plots between ~45 and 55% SiO2 and ~22–32% Al2O3. These contents match quite well those of the overall illite compositional trend (Table 2). The K2O contents range roughly between 2 and 6%, but no clear correlation could be seen with either the Al2O3 or the CaO contents (Fig. 7). In fact, another interesting result is the correlation between the K2O and the MgO contents that shows that illite with the larger K2O contents is also enriched in MgO and Fe2O3 relative to those depleted in K2O and probably of detrital origin. This positive correlation is corroborated indirectly by a weak negative correlation with the Al2O3 and MgO contents (Fig. 7). In summary, two generations of illite-type crystals can reasonably be identified on the basis of their K2O, Al2O3, MgO, and Fe2O3 contents: the first type yields less K2O, MgO, and Fe2O3, and similar Al2O3 amounts than the second one. However, while two types of illite support the hypothesis of an authigenesis of one of these types in the gouges, they need to be separated physically for isotopic dating of the authigenic generation induced by the faulting.
Major elemental data analyzed by ion microprobe. The two lines in each case delineate the in-between surface where the combined data are significant.

Elemental wet chemistry
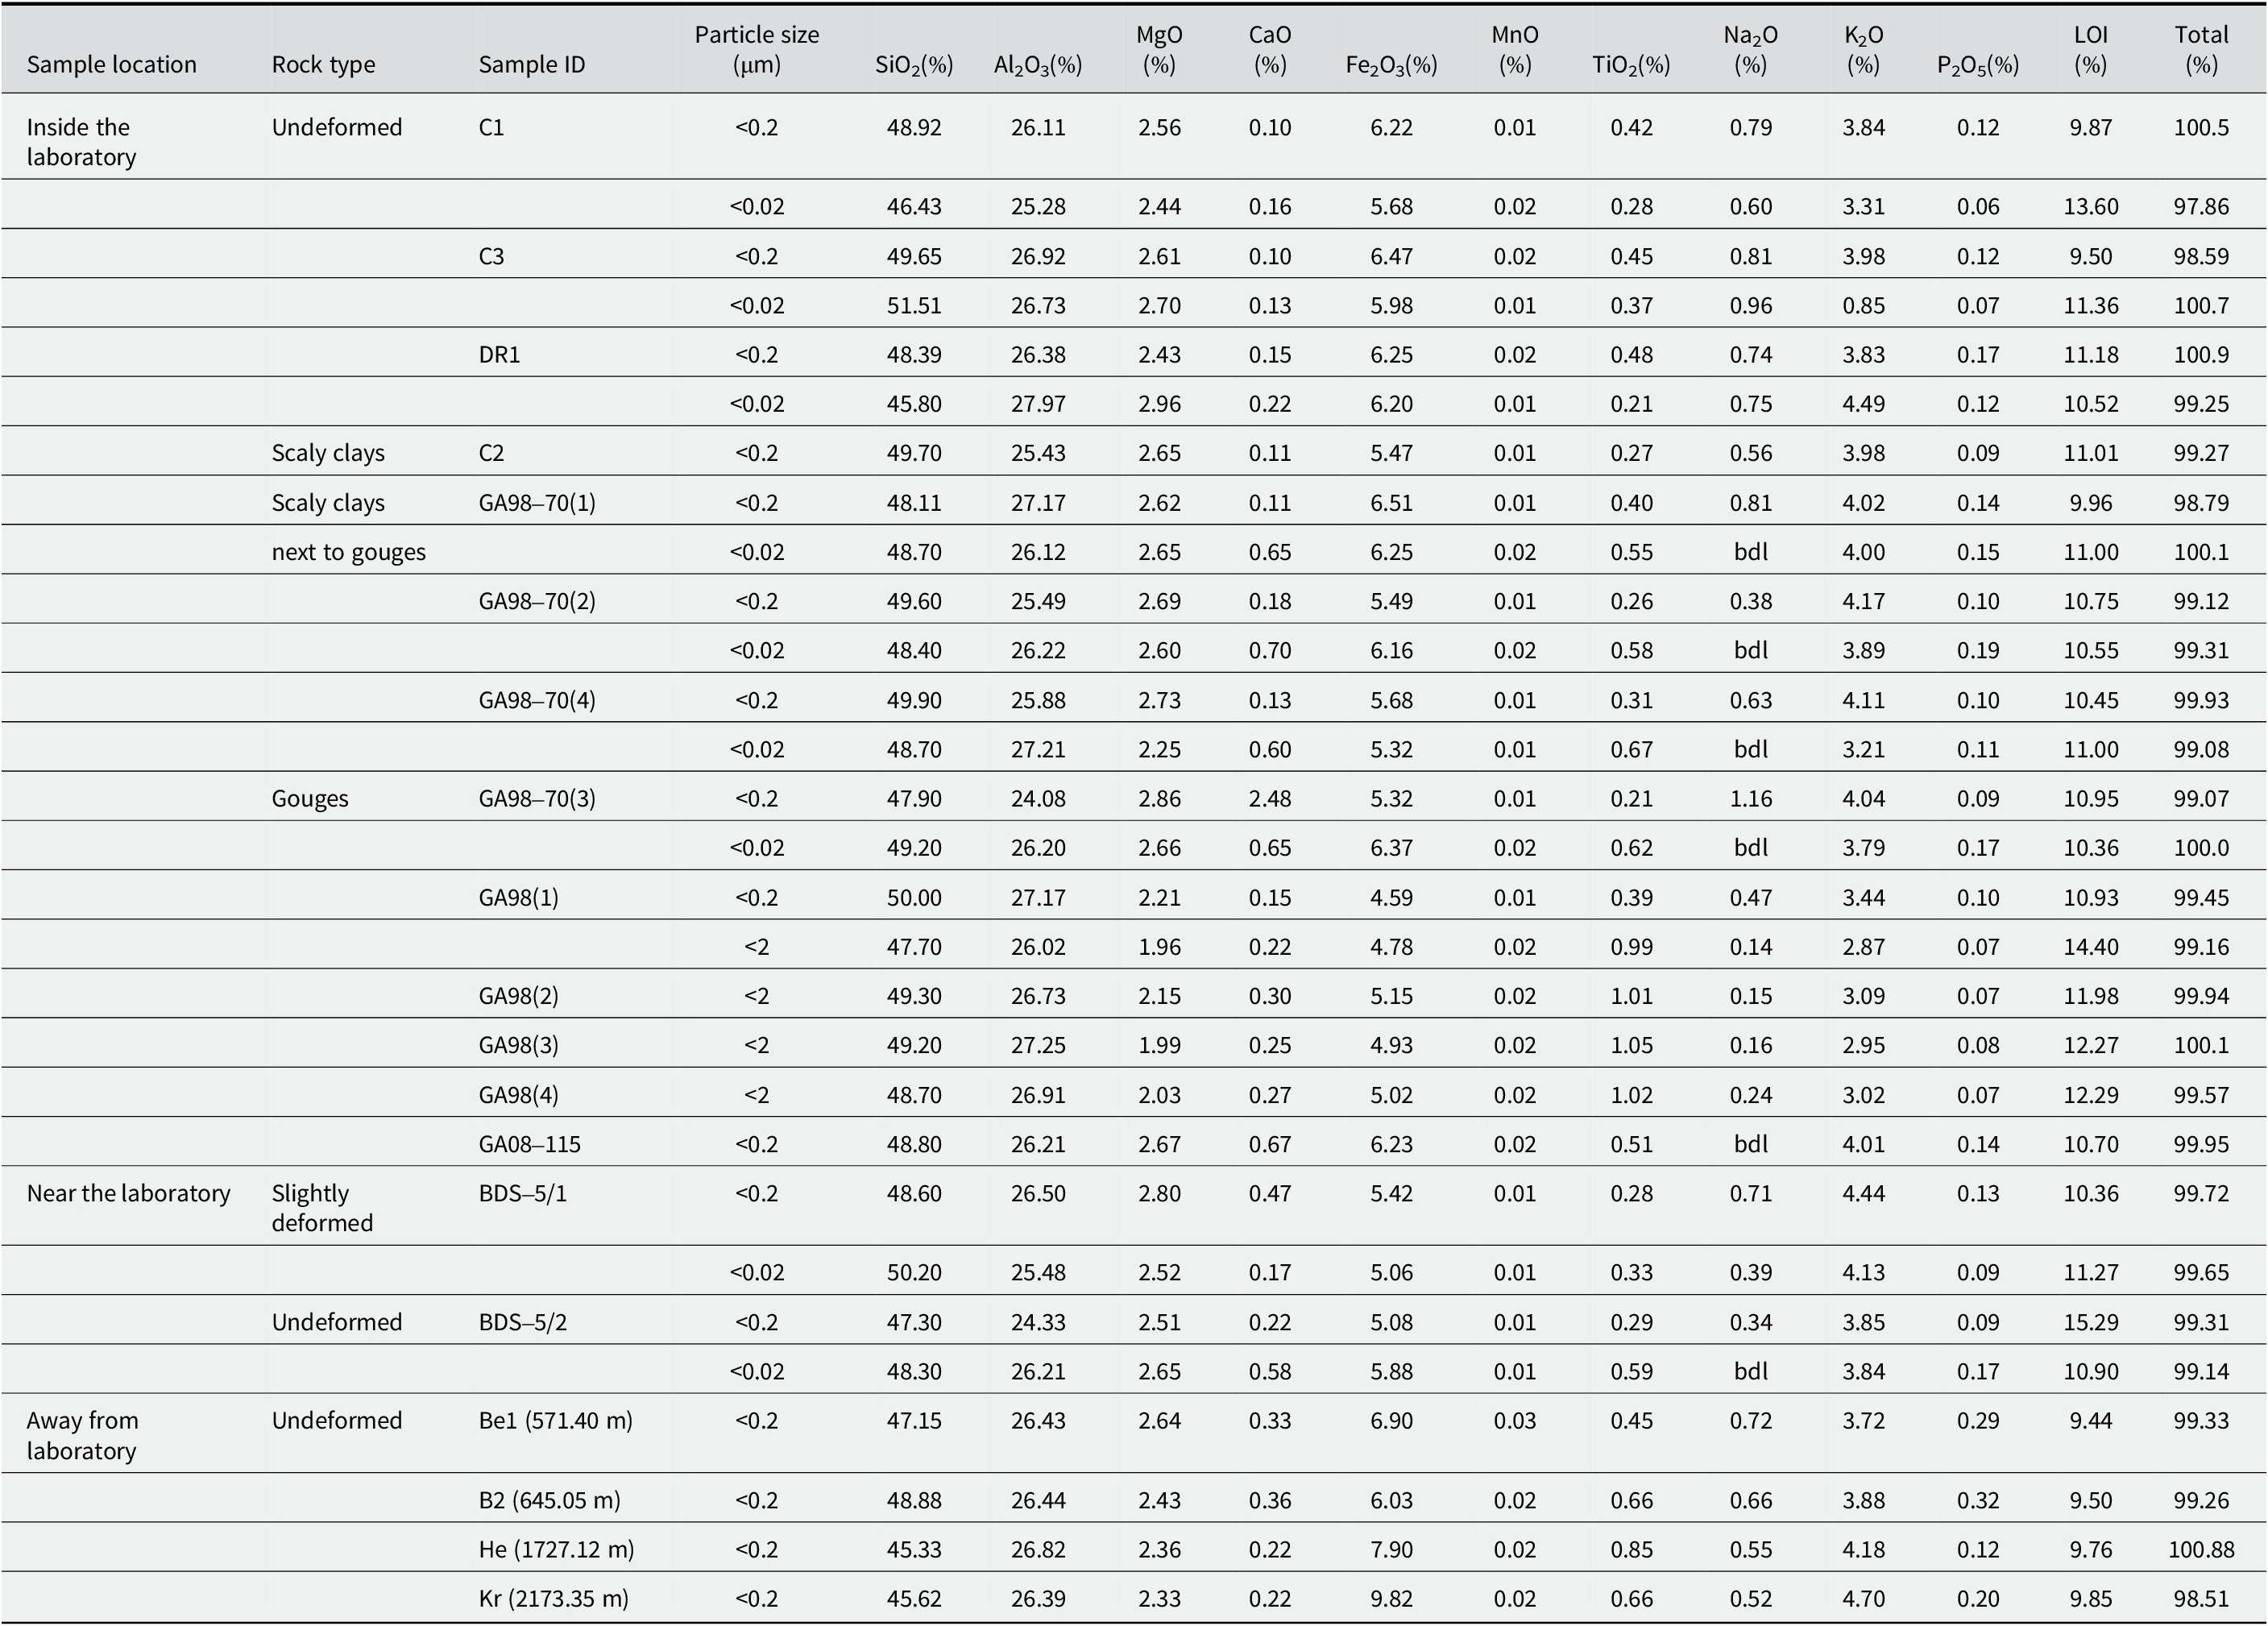
The <0.2 μm size fraction of the undeformed Herdern sample collected far away from the fault yields a significantly lower MgO content than the other analyzed samples; the decrease being compensated by an increase in Fe2O3. This combination implies that the chlorite crystals mixed with the illite are probably of an Fe-rich type, explaining in turn the higher TiO2 content (Table 3). On the other hand, this size fraction contains more K2O, but no more illite relative to I-S, suggesting that I-S is enriched in illite-type layers. The <0.2 μm fraction of the nearby undeformed Kreuzlinger sample, also located far away from the fault, yields about the same chemical composition with less MgO and more Fe2O3 than the other fractions, suggesting again the occurrence of an Fe-chlorite.
Major element contents of the <2 μm, <0.2 μm, and <0.02 μm size fractions of the selected samples by wet chemistry

bdl=below detection limit.
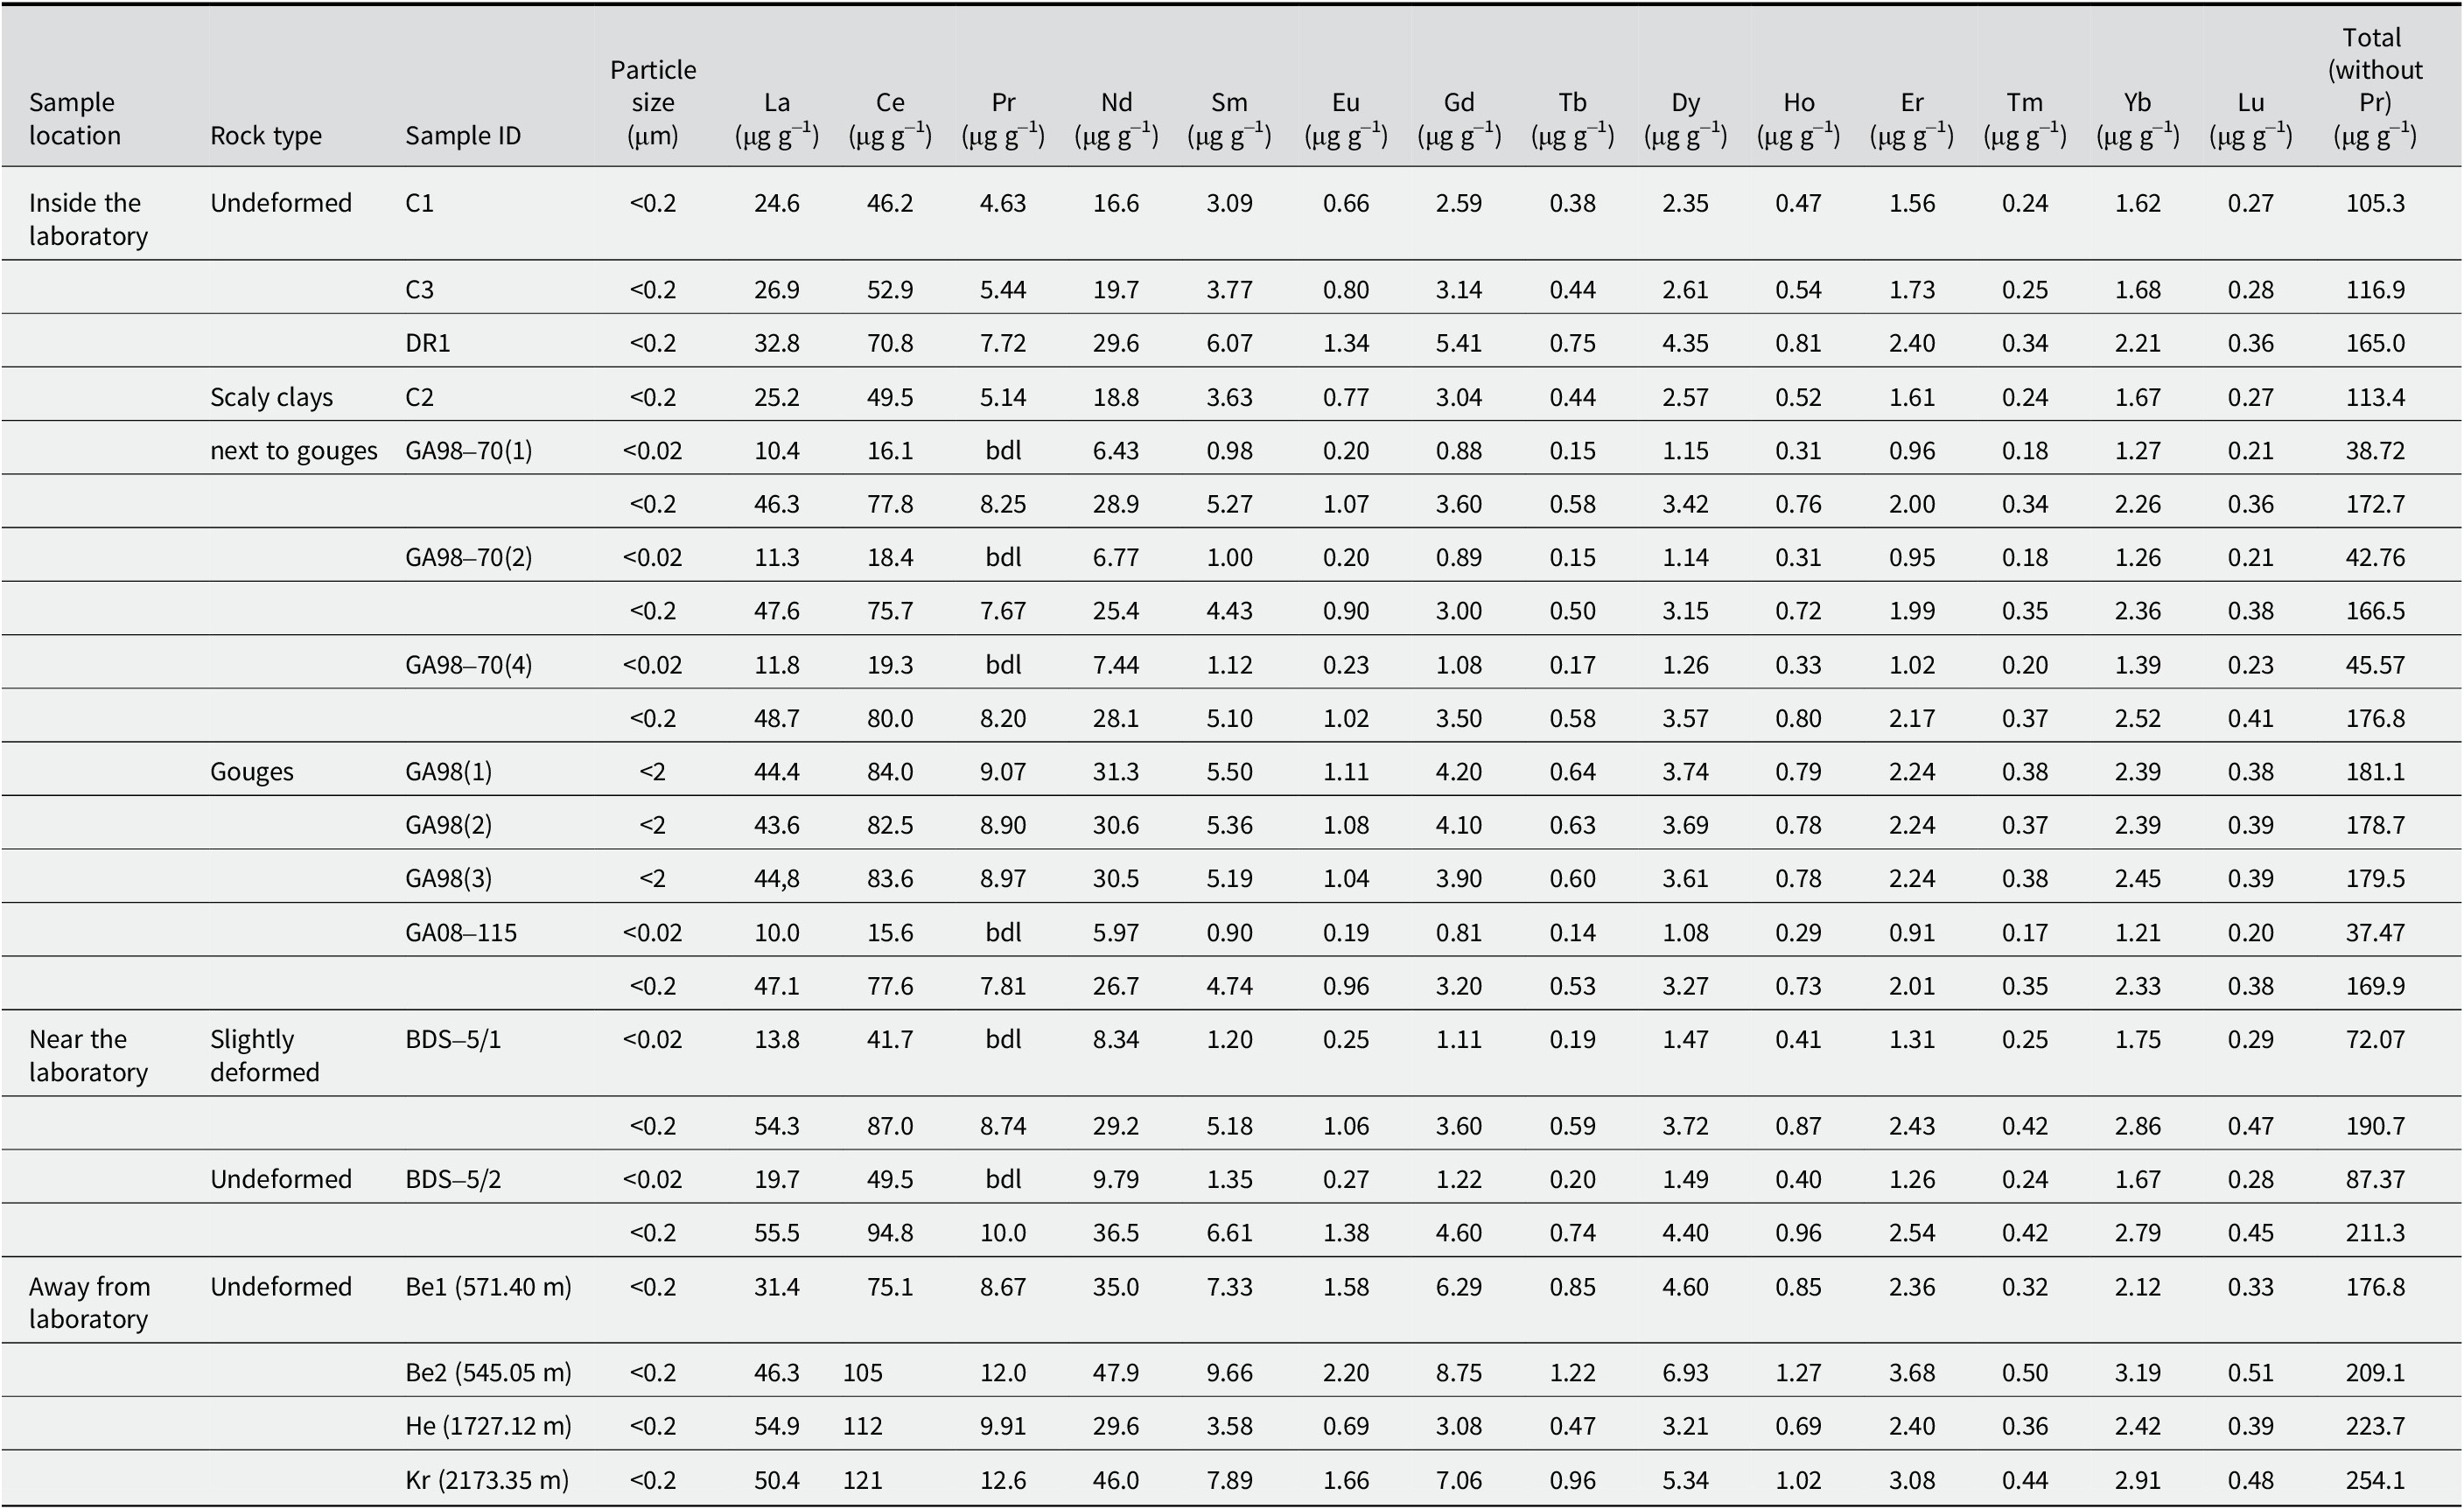
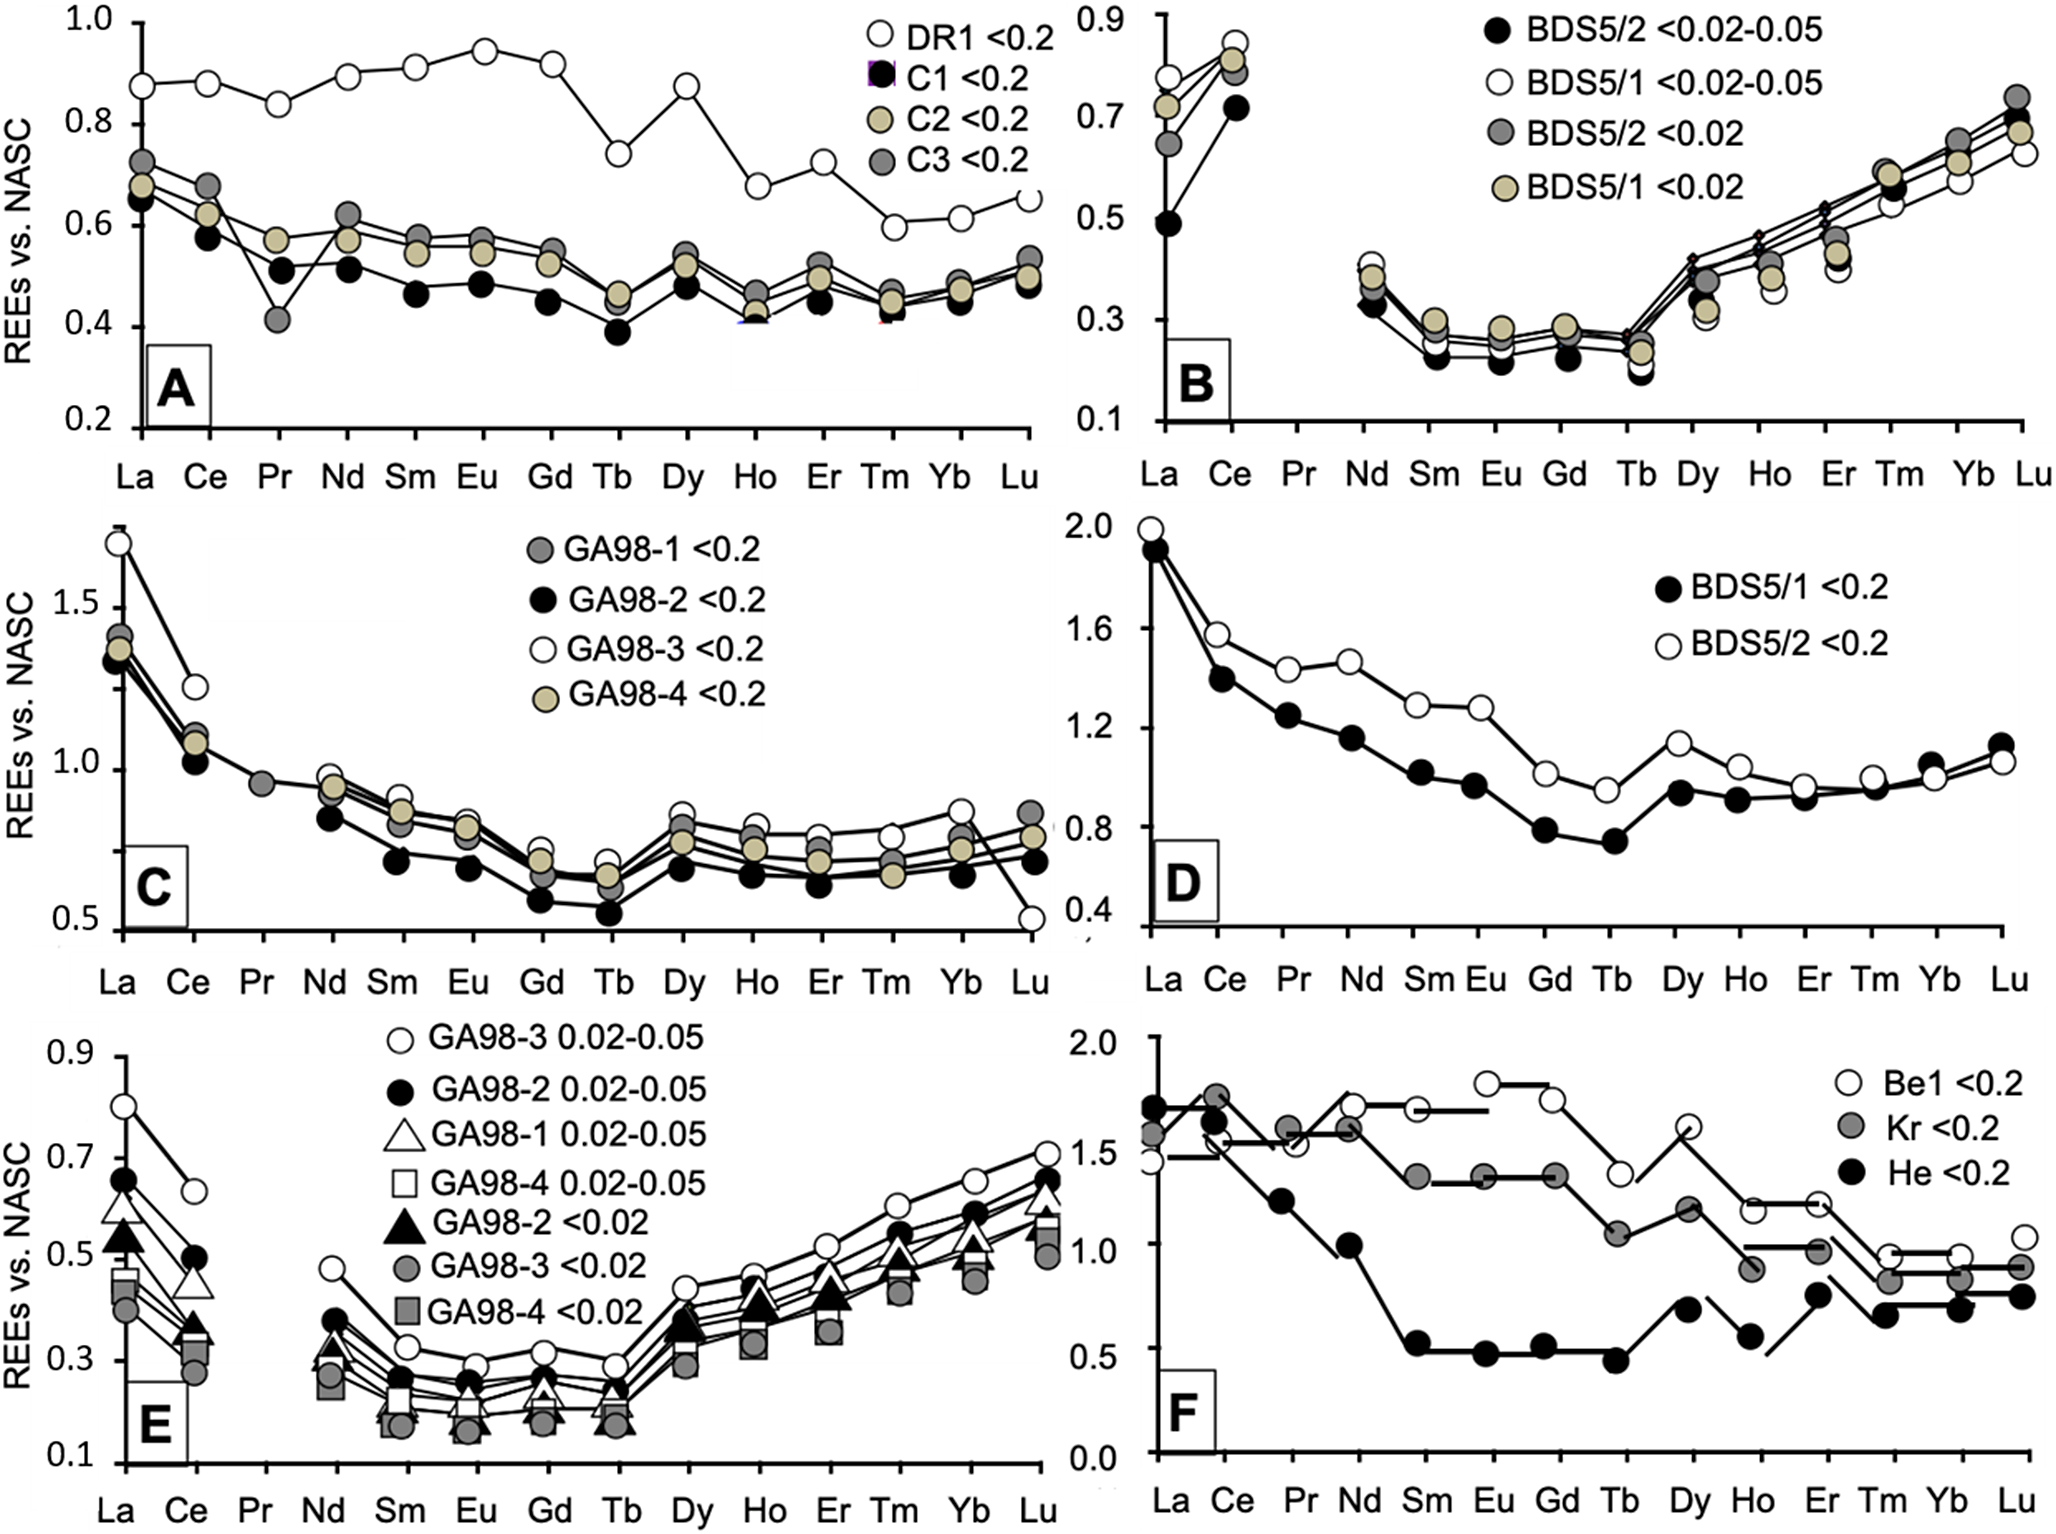
Some trace elements, such as Ba and Sr, yield large amounts. Among them, the REE were organized into several groups with large contents characterizing samples that were collected far away from the laboratory and, therefore, far from the fault. The size fractions of the undeformed C1 and C3 samples and of the C2 scaly clays yield low REE concentrations (<125 mg g–1). Those of the undeformed DR1 and of the scaly clays taken next to the gouges, together with those of the two far away Benken samples yield intermediate concentrations (125–200 mg g–1), while those of the Herdern and Kreuzlingen samples, also located far away from the fault, are characterized by high concentrations (>200 mg g–1; Table 4). In fact, the REE concentrations are known to depend on the occurrence of their mineral or organic carriers, which can be traced best by comparing the contents of each REE with those from a standard rock, chosen here as the North American Shale Composite (NASC; Gromet et al., Reference Gromet, Haskin, Korotev and Dymek1984; Fig. 8). Comparing the data of the <2 and <0.2 μm fractions of samples from within and around the fault allowed three types of patterns to be identified: one is characterized by a continuous decrease from La to Gd-Tb and a flat distribution beyond until Yb or Lu for the patterns of the 98(2), 98(3), 98(4) <0.2 μm separates, and of those of the BDS/5/1 and BDS5/2 samples (Fig. 8). In fact, the patterns are similar to those of the <0.2 μm separates from the C1, C2, and C3 samples, the last of them also showing a marked Nd decrease. The second type of pattern is quite similar with a decrease from La to Sm, a flat trend from Sm to Tb and a steep increase until Lu for the <2 and <0.2 μm fractions of the scaly clays 98-70(1), 98-70(2) and 98-70(4). A further type of pattern yields a high, almost flat distribution from La to Tb followed by an irregular decrease until Tm and a flat end until Lu (Fig. 8). Similar patterns were obtained for the <0.2 μm size fraction of the undeformed samples DR1, Be1, and Kr, located either next to the fault system for the former or far away for the latter two.
The REE contents of the <2 μm, <0.2 μm, and <0.02 μm size fractions of the selected samples by wet chemistry

bdl=below detection limit.
The REE distribution patterns of the analyzed size fractions relative to the NASC reference. Displays of (A) the <0.2 μm fractions of undeformed OPA and one scaly clay (C2); (B) the two smallest size fractions of the two samples from near the rock laboratory; (C) the <0.2 μm fractions of the gouge samples; (D) patterns of the two coarser <0.2 μm fractions of the two samples collected next to the laboratory; (E) diagram of the two smallest size fractions of the gouge samples; and (F) spectra of the <0.2 μm fraction of the samples collected far away from the fault. As some Pr contents were below the detection limit, all Pr data were deleted from the patterns.

In summary, on top of the dispersed REE patterns of the OPA size fractions from the Main Fault and of those far away, which confirm the already suggested mineral heterogeneity, all others are quite similar except the Ce anomaly of the BDS5/1 and BDS5/2 fractions. Attributed to variable redox conditions of the analyzed materials (e.g. Tostevin et al., Reference Tostevin, Shields, Tarbuck, He, Clarkson and Wood2016), this Ce fractionation suggests reducing conditions in the fractions analyzed here. Furthermore, Eu failed to yield the generally positive anomaly relative to its immediate neighbors Sm and Gd, which confirms the low occurrence and even the lack of feldspar crystals that are responsible for this anomaly. Note that the Pr content was sometimes below the detection limit of the equipment used, and that these lacking data were intentionally not added to the drafted diagrams (Fig. 8).
The micro-X-ray fluorescence mapping
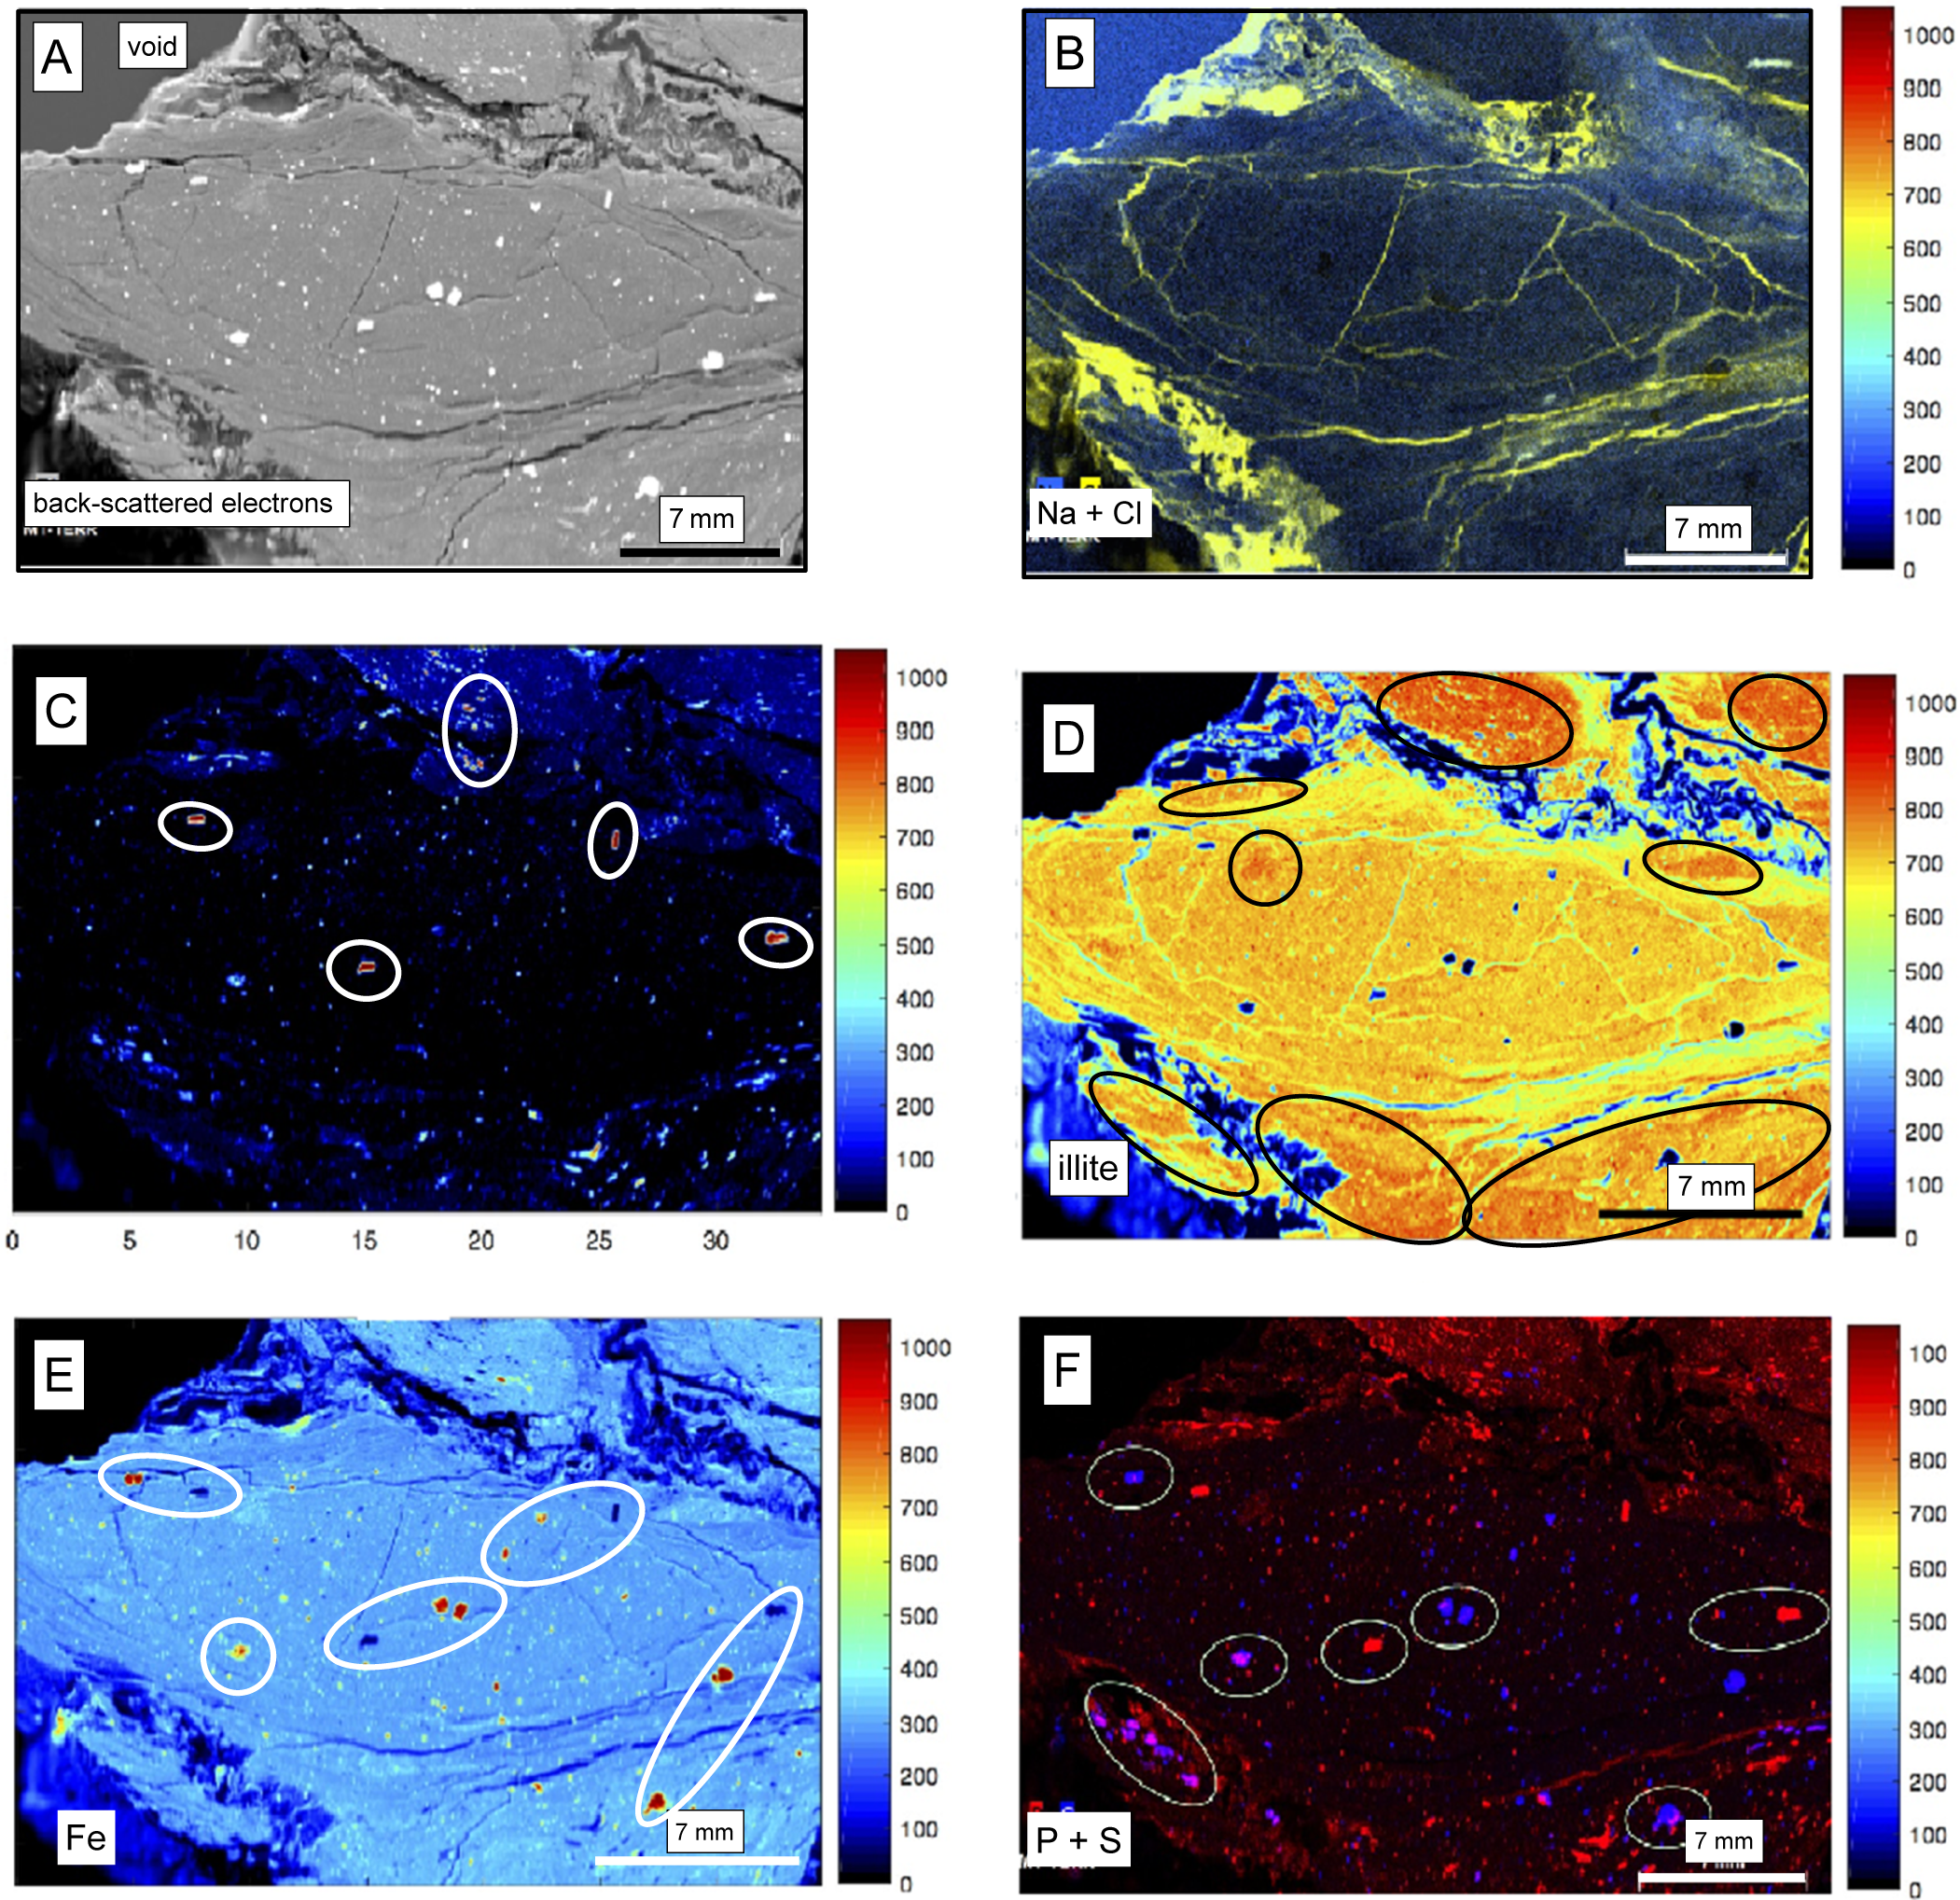
Various μ-XRF elemental maps were selected to evaluate the distribution of the major elements and that of the corresponding host minerals in and around a selected tiny gouge. An initial image of the gouge by back-scattered electrons shows a uniform fabric in the center of the gouge, surrounded by a centimeter-wide zone apparently very disturbed, above and below the gouge to the left (Fig. 9A). The lower right-side border of the gouge consists of a rim apparently less disturbed than those of the upper and lower-left sides. The E–W oriented fine cracks underline the oblong form of the gouge, some also being oriented N–S. Numerous white bulky clusters visible in the central matrix of the gouge correspond to various metallic concentrates. The superposition of the Na and Cl distribution maps testifies to the presence of NaCl salt in the highly disturbed area around the gouge (Fig. 9B), filling also most of the thin and straight cracks/veins visible within the central matrix on the backscattered electron image. These NaCl occurrences are not analytical artifacts.
(A) Surface of the analyzed gouge and its immediate environment by BSE imaging; (B) the μ-XRF map of the combined Na and Cl spectra in yellow with the frequency color chart to the right; (C) μ-XRF map of the Ca spectrum with the clusters in brighter reddish colors corresponding to the frequency color chart to the right, and circled in white on the map; (D) The μ-XRF maps of the combined low-K and high-K illite spectra with the frequency color chart to the right and the areas of high-K illite circled in black; (E) the μ-XRF map of the Fe spectrum with the clusters in either a bright red color or a dark black color corresponding to the frequency color chart to the right, and circled in white; and (F) the combined μ-XRF maps of the P and S spectra with the clusters circled in white and in either a bright red color or a dark blue color corresponding to the frequency color chart to the right, and circled in white.

Unlike the Na and Cl contents, the Ca contents are low in the gouge matrix and in the highly disturbed surrounding rims, mainly as dispersed clusters (Fig. 9C). As no diffuse Ca carbonate or sulfate is visible in most of the gouge or its surroundings, these aggregates are probably detrital feldspars of plagioclase type. They are mostly visible around the gouge itself. Detrital in the gouge, those of the surrounding highly disturbed zones could be authigenic, at least partly. While lacking in most of the dark blue zone of the studied area, the low K contents correspond to the green color as seen in the chart next to the map (Fig. 9D). The absence of or the small amount of K matches the deformed zones around the gouge, the small cracks and veins, as well as some larger clusters also characterized by Ca contents. Conversely, most of the background yields a quite uniform K content given by the yellow color together with reddish patches, with greater K concentrations highlighted by black circles in the picture.
The wide range of K contents in the in situ chemical analyses encouraged the authors to compile the μ-XRF maps of high-K with those of low-K contents, as the K-Ar data discussed in a later section suggest that the low-K illite separates might correspond to the detrital end-member and the authigenic illite separates to higher K contents. Mapping together a K-poor and a K-rich illite gave a contrasted image (Fig. 9D) with most of the gouge characterized by a yellowish color corresponding to a majority of low-K illite crystals with more reddish K-rich zones in the upper zone and dispersed spots in the lower left area of the picture. Note that the gouge volume analyzed by μ-XRF mapping does not appear to contain an overwhelming amount of K-rich illite of probable authigenic origin. The relative amounts of high-K and low-K illite suggest that high-K illite apparently is not predominant the detrital illite population in most of the central oblong gouge. The high-K content is concentrated only in specific places of the central gouge such as those circled in the picture (Fig. 9D). The analyzed gouge also contains a few more clusters of K-rich agglomerates which have geometrical shapes and probably correspond to the above-suggested detrital K-rich feldspars. The deformed rock volume around the gouge that is identified by the blue color in the map also apparently does not contain visible illite; nor do the cracks and veins. In fact, spots of high-K illite occur in two wide surfaces of the image; one above the upper deformed surface and one to two spots in the lower deformed volume at the lower right corner of the image where K-rich illite apparently concentrates (Fig. 9D). In turn, the μ-XRF mapping outlines an inhomogeneous illite distribution in the gouges. Among the three to four spots of the picture related to the gouge, some appear to contain more authigenic high-K illite than detrital low-K illite, while the amounts of both are approximately similar in others. Iron-rich, red-colored clusters in the blue environment probably correspond to dispersed pyrite crystals; these are also circled in the nearby outline of the same image (Fig. 9E). This pyrite occurrence was confirmed by bright S-rich agglomerates that are often, but not always, associated with P and Ca concentrations (Fig. 9F), confirming an organic contribution, especially in the alteration veils that wrap the pyrite concentrates and observed by SEM (Fig. 5C).
In summary, back-scattered electrons identify a gouge matrix with a reasonably uniform distribution of high- and low-K illite. This gouge volume is wrapped in a centimeter-wide disturbed fringe, above and partly below, without visible illite crystals. The other gouge-like volumes at the top and the bottom of the picture beyond the highly deformed rims contain overwhelming amounts of high-K illite. The superposition of the Na and Cl maps demonstrates the occurrence of salts in the highly disturbed zones above and below the central volume where they fill thin and straight cracks/veins. The Ca content is low in both the gouge and the surrounding disturbed rims with highly punctuated concentrates in only a few clusters, probably as Ca-rich feldspars that could be detrital in the gouge and possibly authigenic in the surrounding highly disturbed rims. Note that the heterogeneous repartition of K in the central part of the gouge does not support the overwhelming occurrence of authigenic illite. On the other hand, the significant amount of K around the gouge and in the nearby cracks does support a greater occurrence of authigenic illite. S is often associated with P and Ca, which confirms another determining environment during the formation of the gouges, namely, an organic contribution on the veils wrapping around the pyrite crystals. This confirms the percolation of fluids enriched in organics from outside the gouges as already suggested by Clauer et al. (Reference Clauer, Boiron, Nussbaum and Techer2017b).
K-Ar data
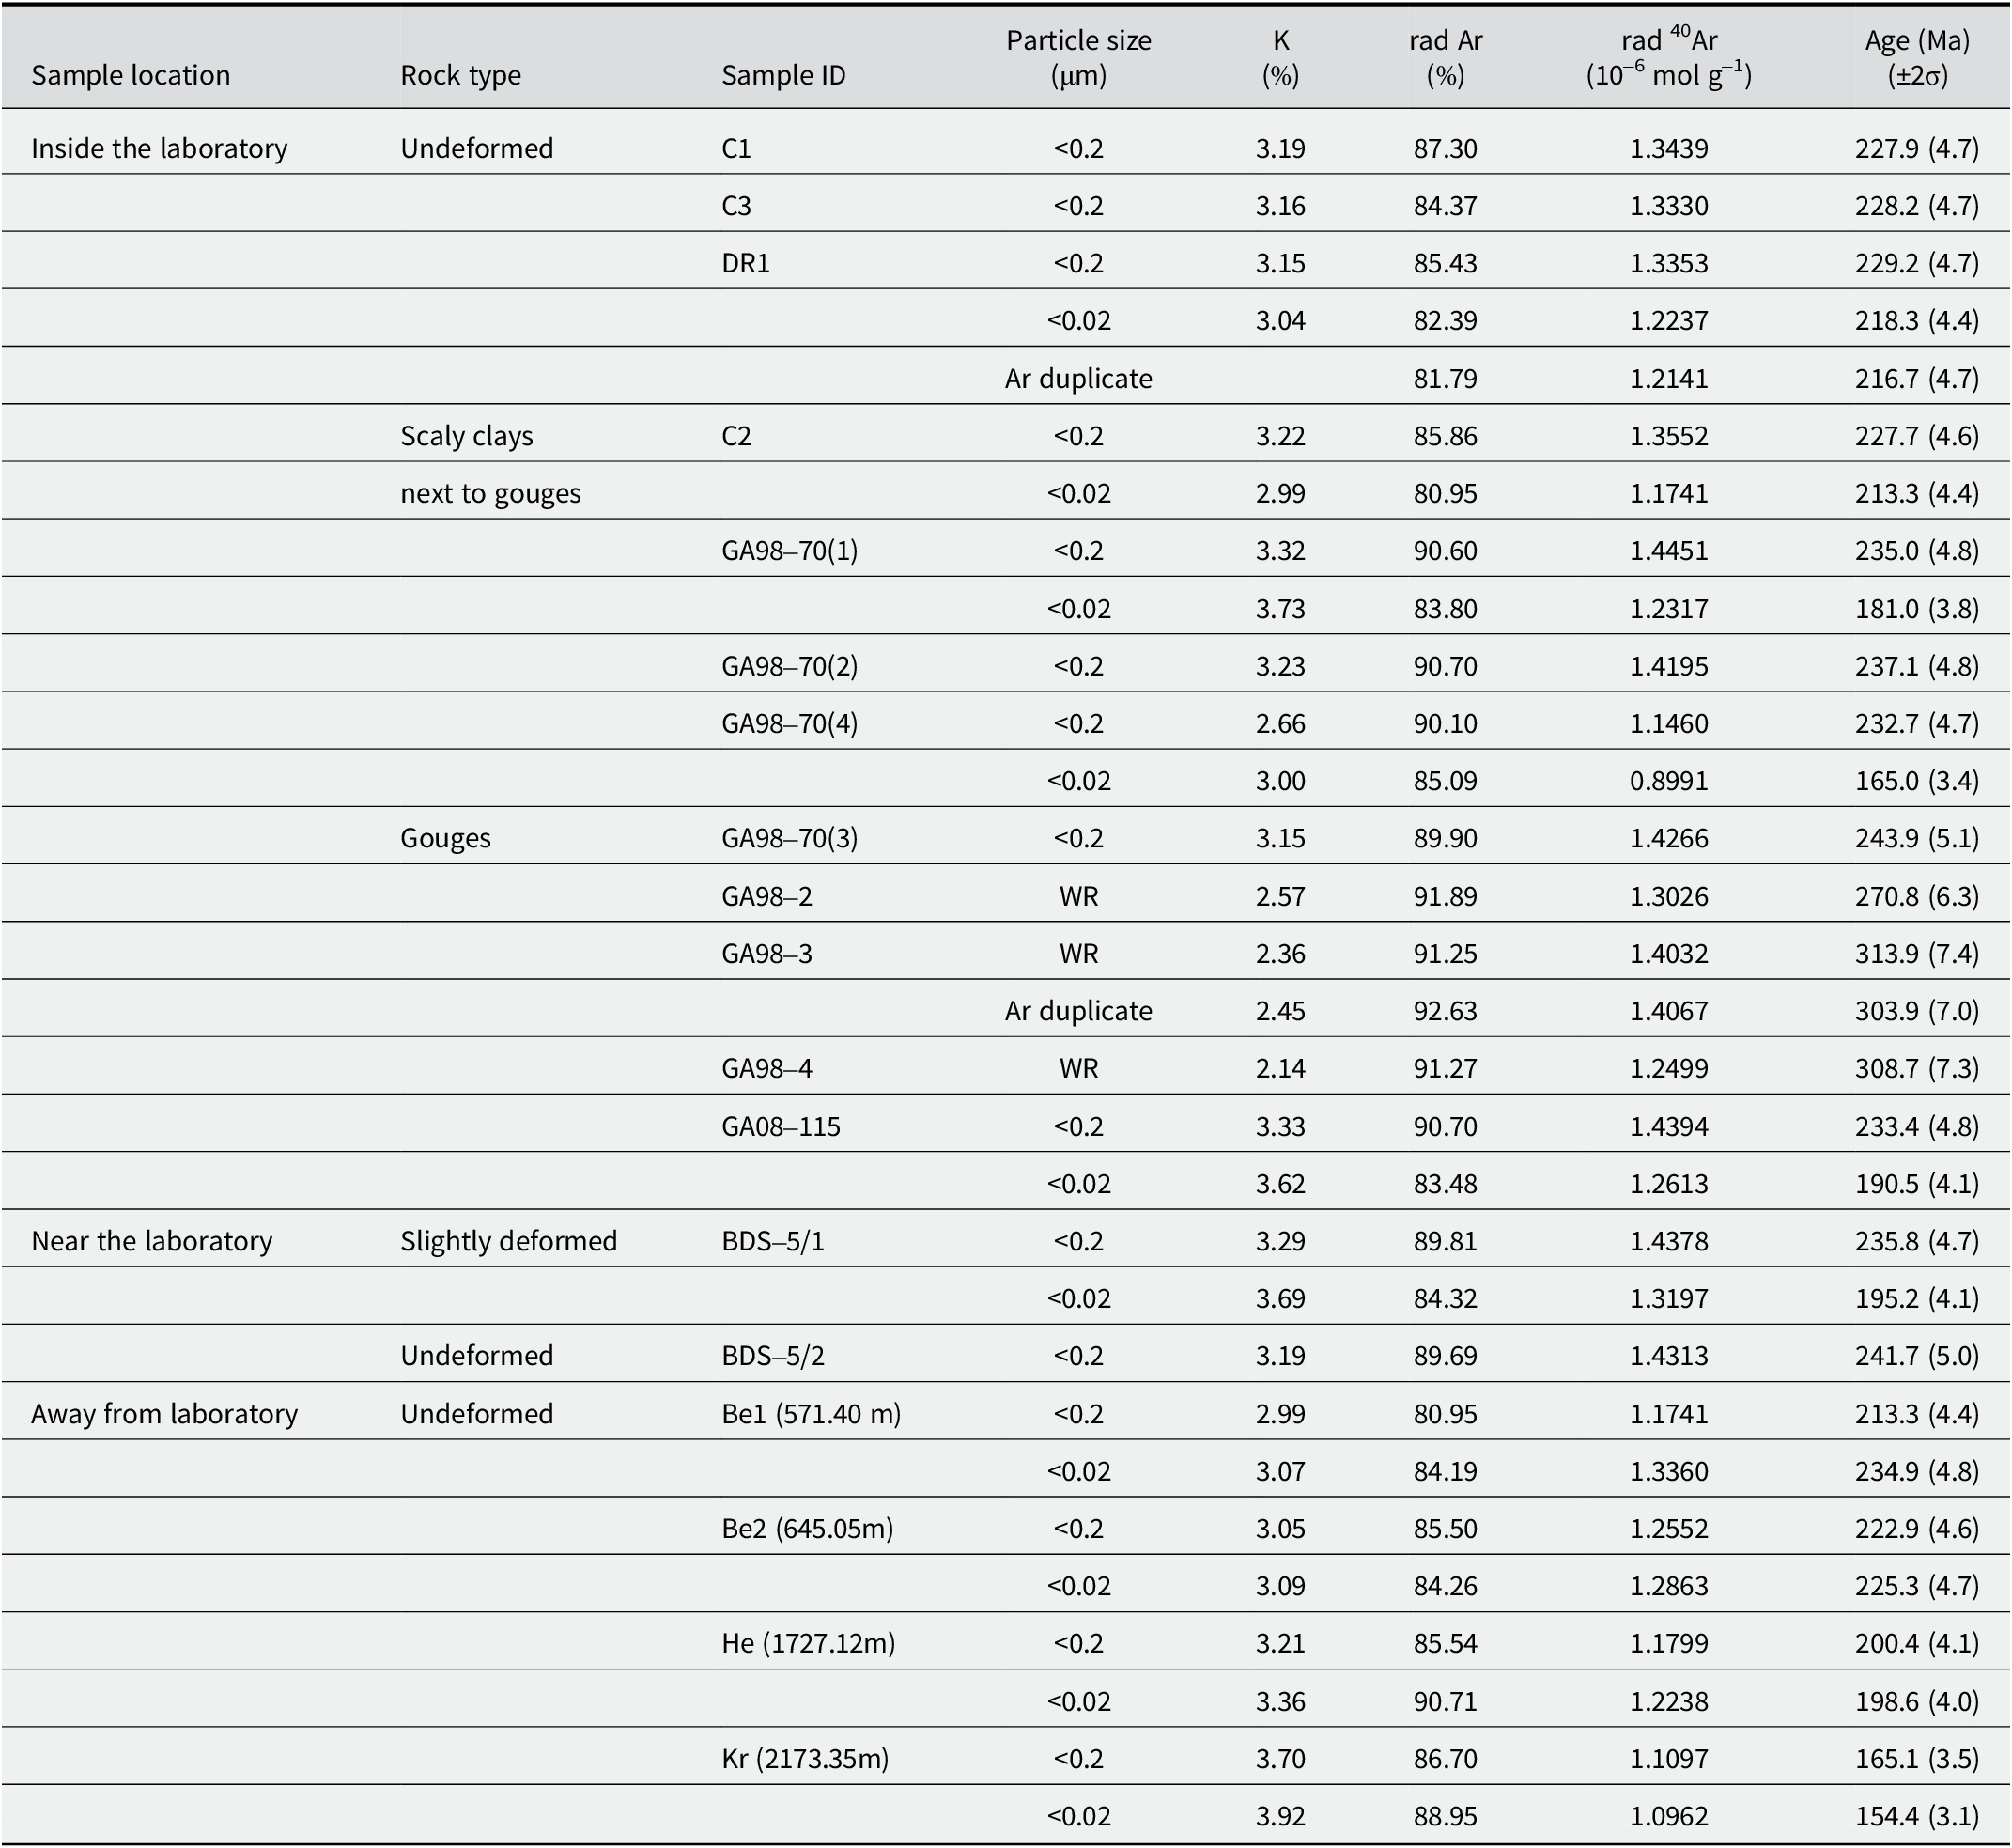
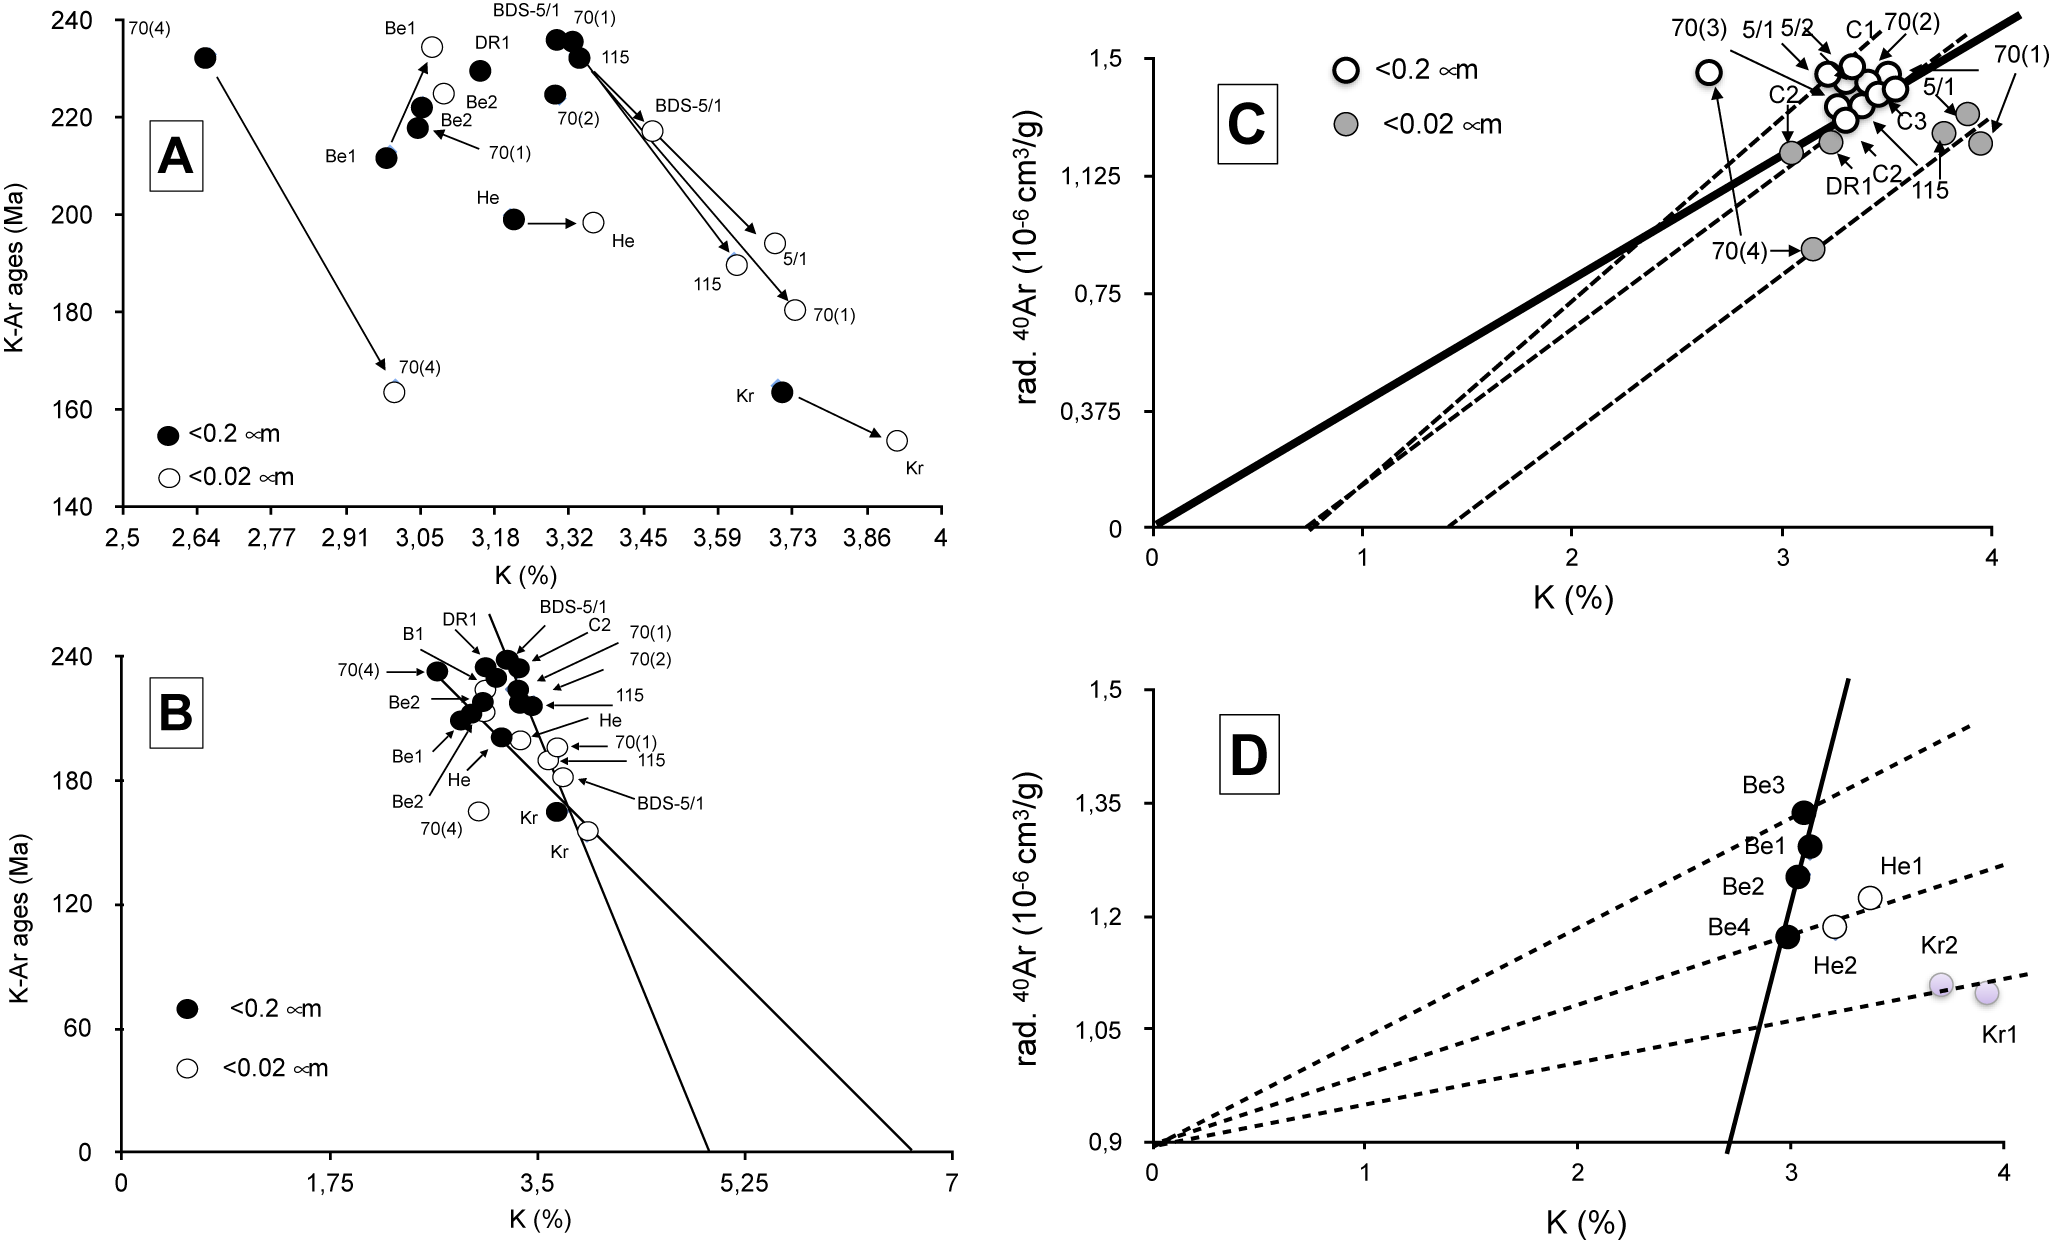
The SEM and TEM observations, together with the wet-chemical analyses of various size separates, explain the difficulty in isolating the authigenic from detrital illite crystals in the gouge volumes. As the in situ chemical determinations confirm this problem for isotopic dating, the K-Ar method was applied to various size fractions of several gouge samples consisting of various mixtures of authigenic and detrital illite in order to elaborate on a trend giving a reasonable age estimate for the authigenic illite. From a preliminary observation of the data, the K-Ar data of the <0.2 μm size fractions appear to be systematically greater than those of the corresponding <0.02 μm fractions from the same samples within and around the rock laboratory (Table 5). These two average age data are also greater than the deposition age of the OPA formation (Aalenian/Toarcian at ~175 Ma), while within the isotopic data obtained by Zwingmann et al. (Reference Zwingmann, Berger, Eggenberger, Todd and Herwegh2017) for similar size fractions. Far away from laboratory to the NE of Switzerland, the K-Ar data of the two Benken size fractions are similar to those of samples collected near the laboratory. Only the two size fractions of the Kreuzlingen sample buried deeper than the nearby Benken ones yield distinctly younger K-Ar values, even below the stratigraphic reference, implying either some stronger alteration of the small detrital K carriers or a larger amount of authigenic illite, not resulting from tectonic activity but rather from a stronger local burial diagenesis (Fig. 10A). The fact that illite agglomerates consist of mixed odd detrital and idiomorphic authigenic crystals means that the K-Ar data obtained are not of any stratigraphic value. On the other hand, all <0.02 μm size fractions consist of a constant 2/3 illite-rich I-S and 1/3 chlorite mixture, with no other K-bearing minerals. This could mean that the K contents of the detrital and authigenic illite-type crystals scatter between ~2.5 and 6.5%, on the basis of the available in situ analyses.
The K-Ar data of the <0.2 μm and <0.02 mm size fractions from selected samples

rad=radiogenic; WR=whole rock.
(A) The K-Ar data of the <0.2 and <0.02 μm size fractions from samples in, near, and far away from the rock laboratory in a diagram combining the K-Ar ages with the K2O contents. (B) plot in a similar diagram extrapolating the K2O contents to a 0-Ma age. (C) Plot of the K-Ar data from <0.2 and <0.02 μm fractions of samples within and next to the laboratory, also in a Harper (Reference Harper1970) diagram; the bold line represents the theoretical locations of samples with corresponding K2O and radiogenic 40Ar contents while the dashed lines are the theoretical locations of samples with excess K relative to radiogenic Ar. (D) Plot of the K-Ar data from <0.2 and <0.02 μm size fractions of the samples collected far away from laboratory still in a Harper (Reference Harper1970) diagram.

The chemical data of the undeformed and the faulted OPA in and near the laboratory provide two main K2O trends that end at ~5.2% and 6% for a theoretical lack of radiogenic 40Ar, which relate to a theoretical 0 Ma age (Fig. 10B). The samples collected far away from the laboratory provide some complementary information, namely the clay material of the Benken samples that is the least buried among the samples collected far away also contains authigenic illite not affected by the faulting but due to burial. In a Harper (Reference Harper1970) diagram that combines the contents of the radiogenic 40Ar with those of K, the lines through data points representative of equivalent contents of both factors, that is to say with meaningful K-Ar ages, intersect both analytical coordinates at their origins. This is not the case here for the four separates of the Benken samples, while those of the Herdern and Kreuzlingen samples crosscut the initial intersection (Fig. 10C). In detail, the line integrating the four data points of the Benken samples points toward a 2.3% K2O content for a 0% content of radiogenic 40Ar, suggesting that either some radiogenic 40Ar escaped from clay-type fractions, which is not the usual behavior of such material (e.g. Clauer et al., Reference Clauer, Środoń, Francú and Šucha1997), or this diagenetic illite collected far from the Main Fault crystallized very recently, after the faulting. Such a loss of radiogenic 40Ar could also have occurred in the fine-sized crystals of the GA98-70(1), GA98-70(4), GA08-115, and BDS5/1 gouge and scaly clays, the data of which also plotting on an array intersecting the K2O ordinate at a content of ~1.3% K2O when no radiogenic 40Ar is theoretically occurring (Fig. 10C). Such a lack of radiogenic 40Ar in the highly deformed facies could have been induced by a post-tectonic alteration due, for instance, to the progressive temperature decrease and related physical-chemical constraints that may theoretically induce post-tectonic clay recrystallizations and/or alterations. The almost present-day illite-type crystallization of the buried Benken material is due to different conditions as no post-tectonic conditions are expected there. In fact, one cannot rule out the possibility that the conditions for some illitization induced by continuous burial lasted longer there, favoring very recent to present-day discrete illitization.
Discussion
The chemical and isotopic data, as well as the electron-microscopic observations and analyses, all point to specific conditions for illite authigenesis in the gouges and in some of the closely associated, highly deformed OPA scaly clays. However, none of the separation techniques used here allowed complete separation of the observed authigenic components from their detrital equivalents. This incites us to consider that the crystallization that occurred in the centimeter-sized gouges, their rims, and in the associated scaly clays of similar size was quite discrete.
K-Ar dating of illite authigenesis in the small gouges
As suggested by the changing K2O contents of the illite-rich size fractions, the non-removable detrital clay material of the OPA biases the K-Ar data. On the other hand, the clay material of the selected shale-type OPA cannot yield a conventional uniform cluster of K-Ar data because of its complex post-depositional evolution. Indeed, the initial OPA clay material results from a probable mixing of discrete authigenic crystals with plutonic to metamorphic detrital fine-sized material representing residues of a continental alteration and of riverine and marine sands. The post-depositional history also includes long periods of burial to the SE of the country, with the sequence also overprinted by at least two tectono-thermal events in the Mont Terri region that probably favored also the crystallization of authigenic material. The 85°C thermal impact due to burial estimated by Mazurek et al. (Reference Mazurek, Hurford and Leu2006) for the OPA sediments of the eastern country near Lake Constance, i.e. far away from the Mont Terri faulting, is theoretically strong enough to initiate a crystallization of I-S mixed layers with probable adjustments of their K-Ar system, especially of the smallest <0.02 μm crystals, as confirmed by the data of the Kreuzlingen size fractions. Greater K2O contents in the size separates give younger mixing ages, and this can be discerned from the two trending lines when the K-Ar ages are correlated with the K2O contents (Fig. 10B). In summary, both the faulting event(s) within the rock laboratory and the burial episode away from tectonic activity induced changes in the K-Ar system of the illite-rich crystals, but with different intensities and durations and probably at different periods of time. In fact, they did not completely homogenize the clay separates even down to the <0.02 μm size. Finally, the fact that the <0.2 μm size fractions yield systematically greater age data than their corresponding <0.02 μm size fractions confirms the occurrence of younger authigenic illite with greater K2O contents than in the coarser counterparts, considering that the illite-rich crystals did not lose radiogenic 40Ar (e.g. discussion and references in Clauer et al., Reference Clauer, Środoń, Francú and Šucha1997). The data points of the size fractions from within the rock laboratory and nearby, fit two trending lines that indicate contents of 5.2 and 6.5% K2O for a theoretical 0 Ma age. The steeper line ending at 6.5% K2O passed through most data points of illite from the laboratory site, whereas the second line ending at 5.2% K2O includes the data points, except one, of the size fractions from samples taken far away from the laboratory that were not subjected to the Main Fault tectonic episode (Fig. 10B). Based on the assumption that the authigenic illite size fractions generated by the faulting episode yield greater K2O contents and that the fractions far away from the fault have smaller contents, a simple age calculation provides an age range from 7.8 to 9.7 Ma with an average of 8.8±0.9 Ma for the illite-type material that theoretically crystallized during the faulting. K-Ar dating of illite size fractions from sediments and meta-sediments show that an appropriate separation of authigenic illite crystals from detrital equivalents could be achieved in many studies (e.g. references and discussion in Clauer and Chaudhuri, Reference Clauer and Chaudhuri1995). Such separation was not successful here even in processing the separation to the nanometer size, because, as shown by SEM observations, the authigenic crystals grew on the detrital precursors and not next to them, in the specific conditions of the gouges. The evaluation of a crystallization age of any authigenic illite crystal, as attempted here, was then only possible by assuming an appropriate K2O content for the authigenic material obtained by the in situ determinations relative to the measured K contents and K-Ar data for separates consisting of mixed authigenic/detrital aggregates.
Some constraints on the physical-chemical formation of the gouges from OPA sediments
As already suggested by Clauer et al. (Reference Clauer, Techer, Nussbaum and Laurich2017a), the physical-chemical conditions in the gouges during the Jura faulting episode appear different from those in the contemporaneous slickensides, veins, and fractures in and around the fault, as well as from those of rock matrices located far away from the laboratory that were only buried. As the burial episode(s) was (were) similar for all these features, it may be expected that the differences were in the fluid supply, amount and/or flow, larger in the more open microstructures than in the more confined gouges. The various slickensides, veins, and micro-fractures probably acted as did the scaly clays here, at least in their highly deformed parts. However, if it can be assumed that both the gouges and the microstructures of the scaly clays acted successively as open and then closed volumes, it remains to be discovered when and how opening and closing occurred relative to the recent faulting episode.
Independent evaluations of the recent to present-day porosity of the gouges do not seem to agree (Orellana et al., Reference Orellana, Violay, Henry, Guglielmi and Nussbaum2017; Laurich et al., Reference Laurich, Urai and Nussbaum2017). In turn, whatever their permeability, which does not appear to be overwhelming in the gouge volumes on the basis of the μ-XRF mapping above, fluids had to access the heart of the gouges at least once during the past, which is supported by the chemical data and electron microscopic observations. Note also the absence of a positive Eu anomaly that is usually due to its re-precipitation in the 3+ state under high oxidation conditions, such as those potentially occurring in gouges due to over-pressured and over-thermal conditions (MacRae et al., Reference MacRae, Nesbitt and Kronberg1992). As no Eu anomaly is visible here in the REE patterns despite a discrete occurrence of feldspar minerals identified by μ-XRF mapping in and around the examined gouge, the conditions during the fluid flow(s) were probably not oxidizing. Such non-oxidizing conditions are also suspected, independently, by the alteration of the pyrite crystals wrapped in their veils (Fig. 5C) and are supported by the plausible occurrence of organics.
In summary, no determining argument can be raised here about the present-day permeability of the gouges. The only available fact is the occurrence of authigenic K-rich illite in a gouge matrix for which an approximate K-Ar age suggests a crystallization at ~8.8±0.9 Ma during the last faulting. In turn, the only hard fact is that the gouges had to be accessible at least once by external fluids even if they were described elsewhere as being only partially porous by now. By taking into account the illite K-Ar data of the smallest and the coarsest analyzed size fractions of the samples for which at least two fractions were K-Ar dated, a simple calculation allows a fair evaluation of the amount of authigenic illite that crystallized during the late fluid occurrence. About 15–17% of authigenic illite apparently occurs in the analyzed <0.02 μm fractions of the studied gouges and the associated scaly clays. Note also the SEM observations that visualize newly formed illite crystals sticking on detrital material (Fig. 4) with a precipitation apparently not dependent on the permeability of the gouge which is supported by the μ-XRF mapping. Generally, illite authigenesis occurs in clay-type sediments when the physical-chemical conditions are changing markedly during either burial or tectono-thermal events, which is visible by isolated idiomorphic crystals that apparently precipitate in open voids (e.g. Sasseville et al., Reference Sasseville, Tremblay, Clauer and Liewig2008; Laverret et al., Reference Laverret, Clauer, Fallick, Mercadier, Patrier, Beaufort and Bruneton2010; Haines and van der Pluijm, Reference Haines and van der Pluijm2012). This generally observed combination does not occur here, possibly because of the small size of the studied gouges, or there may be other reasons because the physical and chemical conditions also have an important role to play.
Also of interest in small gouge volumes with an external supply, as in the current study, is the alteration of pyrite that results from changing redox conditions due to the occurrence of organic matter recognizable by the occurrence of Sm and P associated with the sulfites or the sulfates. The alteration of pyrite and the crystallization of celestite relate to this opening (Fig. 5), as the presence of P and Sm in the gouges can only be attributed to a supply from outside, unless the small dark gouges were parts of the Rietheim unit known to contain organic matter and called ‘bituminous schist’ on purpose. The term schist might not be the most appropriate, but it explains the occurrence of organics and the shiny aspect of this unit also affected by the faulting. The μ-XRF elemental mapping of the tectonized OPA rock volume strongly suggests that the material of the boudin-like gouge was significantly less affected by the tectonic stress than the surrounding rims. Interestingly, both the gouges and their walls obviously interacted with fluids that induced variable assemblages by percolating apparently more along the drains and the flanks, then diffusing into the more homogeneous gouge matrix. The former contains salts as evaporation relicts of the earlier fluid flows, and the latter hosts fewer authigenic illite crystals. Therefore, the redox conditions were probably not the same in the gouges as in their rims where reducing conditions, probably due to the occurrence of organics, suggest that the Rietheim unit could have been involved in the formation of the gouges and their rims, or at least contributed somehow.
Conclusions
The clay-type agglomerates of various tiny gouges from the Main Fault in the Mont Terri anticline suggest a discrete overgrowth of authigenic illite-type crystals with straight borders on previous detrital illite-type particles recognizable by more diffuse contours and not the usual, independent crystallization/precipitation conditions in open voids. The chemical and physical conditions were varied depending on the gouges, rims, scaly clays, and undeformed OPA sediments far away from the fault which were studied here. This physical intergrowth of detrital and authigenic illite excluding any strict quantitative evaluation, an approximate crystallization age of the authigenic illite crystals was estimated by extrapolating a K-Ar age of 8.8±0.9 Ma based on a K2O content of the authigenic material measured by in situ microprobe determinations relative to evaluated K2O contents and K-Ar average ages for the detrital counterparts. This age can be attributed to the faulting/folding event during which the observed gouges formed.
The superposition of the μ-XRF Na and Cl maps confirms the occurrence of veins filled with salts across and around the observed gouge matrix. Such occurrences suggest a temporary infiltration of fluids probably during the faulting episode. Combined Fe and S on the μ-XRF maps of the examined gouge specimen also suggest numerous pyrite clusters associated with P that reveal the presence of organic matter in the faulting volume. This organic matter was introduced once, probably during the faulting episode, unless parts of the gouges consisted of tectonized Rietheim material.
No argument allows one to state confidently that the gouges are, at present, more or less permeable than the surrounding undeformed OPA sequence. However, they had once to be permeable, probably during faulting, because they were cut by micro-drains and an external supply of K2O is necessary to explain the observed illite authigenesis. Evidence for the opening of the gouge volumes is also found in the systematic occurrence of salts in micro-veins within the observed gouge matrix and in its highly disturbed surrounding walls.
Author contributions
NC was responsible for the interpretation and for the chemical analyses and the K-Ar data. He also prepared the final written version. CN was responsible for the geological framework. MCB was responsible for the in situ analyses and MU for the micro-fluorescence data.
Acknowledgements
The engineers and technicians of the Laboratoire d’Hydrologie et de Géochimie de la Surface (Université de Strasbourg) are thanked sincerely for the XRD, elemental wet data, and most K-Ar analyses; as well as the engineers and technicians of the Service Commun de Microscopie Electronique et de Microanalyses from GeoRessources Unit (Université de Lorraine) for assistance during the SEM observations; and the engineer of the CSIRO organization for some final K-Ar dates. In addition, we are grateful to the Mont Terri Consortium for funding the FI project, Dr R. Freeman for improving an earlier draft of the manuscript and one of the two anonymous reviewers whose comments helped to improve the discussion and the presentation of this contribution. Special thanks to K. Murphy, Managing Editor, who helped to get the manuscript into its current conformation.
Financial support
The financial support by the Mont terri Consortium is mentioned in the acknowledgements.
Competing interests
The authors declare none.
Data availability statement
Further data available upon request.