Background
Uttar Pradesh (UP), with a population of over 220 million, is the most populous state in India and accounts for 16.0% of the country’s population. It is also one of the most economically disadvantaged states, and has 78.0% of the population being rural. The Total Fertility Rate (TFR) of the state as per the National Family Health Survey-4 (NFHS-4, 2015-16) was 2.7 as compared to 2.2 for the country. Despite a high level of unmet need for modern contraceptive methods in UP (18.0% in UP as compared to 12.9% in India in 2015-16), the state has witnessed a significant fertility decline from 4.06 (NFHS-2, 1998-99) to 2.7 (NFHS-4,2015-16). In UP, while the increase in the prevalence of modern contraception was marginal, the prevalence of traditional methods (TMs) increased significantly from 1.0% (NFHS-1, 1992-93) to 13.3% (NFHS-4, 2015-16). For the same period, the prevalence of traditional family planning methods in India remained relatively stagnant, 4.3% (NFHS-1) to 5.9% (NFHS-4).
Historically, during fertility transitions in other parts of the world, such as Europe (Rossier and Corker, Reference Clementine and Corker2017), Turkey and Sri Lanka (Tsui et al., Reference Tsui, de Silva and Marinshaw1991; Goldberg and Toros, Reference Goldberg and Toros1994; Gribaldo et al., Reference Gribaldo, Judd and Kertzer2009), the fertility decline occurred as a result of the use of TMs and abortion in case of failure of TMs. Similarly, in the Indian states of West Bengal and Kerala, the use of TMs was high when fertility was low (Basu, Reference Basu2002). It is possible to draw parallels between the fertility transitions in Europe and UP, as recent estimates also point to a high proliferation of abortion, with an estimated 30% of pregnancies ending up in an abortion (Susheela Singh et al., Reference Susheela Singh, Chander Shekhar, Moore, Melissa Stillman, Frost, Manoj Alagarajan, Kalyanwala and Ball2018).
Given that the fertility decline in UP occurred at the same time as the increase in the use of TMs, it is important to understand whether the use of TMs played a role in the decline or whether it is an indication of a spurious association. It is also important to understand if the use of TMs was due to lack of availability of modern methods. This would also raise a number of important programmatic and policy-relevant questions. Is the increasing prevalence of TMs challenging the conventional wisdom that women use TMs due to barriers to availability?
Materials & Methods
Data Sources
Data from different rounds of National Family Health Surveys and the Family Planning Survey, and the facility mapping survey conducted by the Uttar Pradesh Technical Support Unit (UP TSU) have been used for the analysis. The primary narrative in the paper is based on the family planning survey conducted by the UP TSU. However, different rounds of NFHSs have been used to examine trends, to get the family planning and fertility picture of entire Uttar Pradesh as the UP TSU family planning survey represented only 25 High Priority Districts and for validation of the UP TSU family planning survey results.
NFHS
The NFHS is a large-scale multi-round survey conducted in a representative sample of households throughout India. Four rounds of the survey have been conducted between 1992-93 and 2015-16. The NFHS provided data for a wide range of indicators in the areas of population and health. The survey design was developed in such a way that it should provide maximum precision on fertility and family planning indicators. The sample was selected through two-stage stratified sampling, and selected eligible women were interviewed by trained research investigators. All the data used in this paper has been archived in the Demographic and Health Surveys (DHS) public repository, where the data is easily accessible using the link: https://www.dhsprogram.com/data/available-datasets.cfm.
UP TSU Surveys
The UP TSU was set up with support from the Bill and Melinda Gates Foundation by the University of Manitoba, Canada, in partnership with the India Health Action Trust to provide techno-managerial support to the Government of Uttar Pradesh in 25 High Priority Districts (HPDs). The high priority districts as identified by the Government of India in the “Call to Action: For Every Child in India” summit were selected by taking 25% of the districts which scored poorest in a composite index based on socio-economic and health indicators (National Rural Health Mission, 2013). Data from two surveys: Family Planning Survey, 2016, and the Facility Mapping Survey, 2018, conducted by UP TSU, have been used in the analysis.
The Family Planning (FP) survey of 2016 was administered to currently married women between the ages of 15-49 in 25 HPDs of UP. The required sample size for each district was estimated using the prevalence of modern contraceptive users as per the Annual Health Survey (AHS 2012-13). The survey adopted a two-stage cluster sampling design – the first stage involved selecting five blocks in each district using a PPS method. The second stage involved the random selection of primary sampling units (PSU). The Accredited Social Health Activists (ASHA) areas (each area with a population around 1000) were considered as PSUs in the survey. From the selected PSUs, five eligible women were interviewed per PSU. If more than one eligible woman was found in the household, one respondent was selected randomly using the KISH grid (Lewis-Beck et al., Reference Lewis-Beck, Bryman and Futing-Liao2004). In total, 13,182 eligible women participated in the survey. The survey was conducted by independent research investigators trained under the UP TSU project.
The Facility Mapping Survey was conducted in 2018 across all 75 districts of UP to cover all public facilities up to the block Primary Health Centre (PHC) level to assess the situation of facilities for delivering family planning services. This included all District Hospitals (DH), First Referral Unit Community Health Centers (FRU CHCs) other Community Health Centers in addition to block PHCs (Non-FRU CHCs). While lower facilities do provide family planning services, the scope was limited to cover facilities that could provide the entire basket of contraceptive choices, including sterilisation. A total of 1109 facilities were surveyed across 812 blocks.
Facilities were identified through lists provided by state and district officials. The mapping tools (specific to facility types) were developed. and were finalised in consultation with a team of experts. The tools were designed to capture details of physical infrastructure, staff, drugs, equipment, supplies and certain service indicators. The medical officers’ in-charge at the PHCs and CHCs and the chief medical superintendents at the DH were the primary respondents. A family planning service was deemed to be available at a block if at least one public health facility surveyed in the block provided the service in either routine or outreach mode as per the respondent. Overall availability of FP services in a block was calculated based on the availability of at least four out of the seven services (Male/Female Sterilisation, Condom, Intrauterine Contraceptive Devices, Postpartum intrauterine contraceptive devices, Oral contraceptive pills, Condoms, Emergency contraceptive pills, Injectable depot medroxy progesterone acetate,) available in the public health basket of choice.
The Bill & Melinda Gates Foundation funded these surveys. Ethical approval was obtained from the Institutional Review Board of Sigma, India and the University of Manitoba’s Institutional Ethics Board.
Data Analysis
The data were analysed using bivariate and multivariate statistical methods. The bivariate analysis has been used to assess the association between the traditional and modern contraceptive methods users by background characteristics. In the bivaroiate analysis, the current non-uers of contraception (all those women who were pregnant or who wanted to get pregnant were excluded) were also included. Multivariate analysis has been used for assessing the likely effects of each of the background characteristics on the TMs (lactational amenorrhea method, coitus interruptus withdrawal method, calendar method or rhythm method, cervical mucus method and abstinence) users compared to modern methods users among the reproductive women after controlling for the other characteristics. In case of categorical background characteristics, the choice of a reference category was guided by theoretical considerations as well the findings of bivariate analysis.
Results
Fertility and family planning
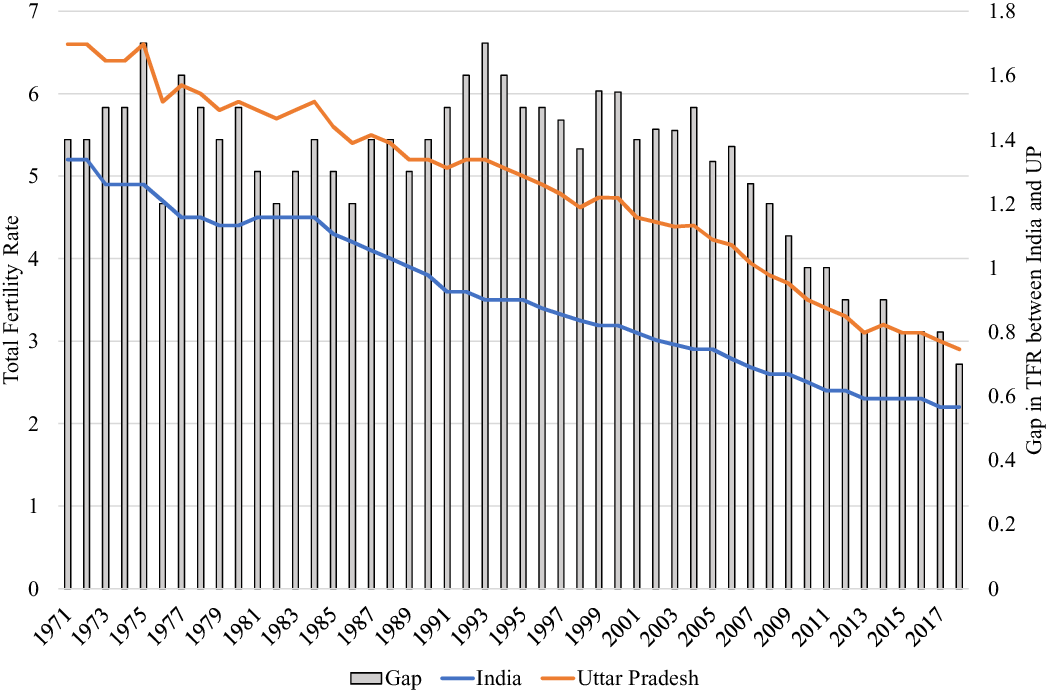
Figure 1 provides a comparison of historical fertility trends in UP and India and throws light on the remarkable fertility transition in UP. Uttar Pradesh (UP) has followed the Indian trajectory in terms of decline in total fertility rate, but the gap in total fertility between India and UP has narrowed in recent years. The rate of decline in TFR in UP has been persistent and steeper in the mid-seventies as well as in the last decade.
Total Fertility Rates (TFR) trends in India and Uttar Pradesh from 1971 to 2018, Sample Registration System, India.
Note: TFR between 1971 and 1998 was computed for undivided Uttar Pradesh

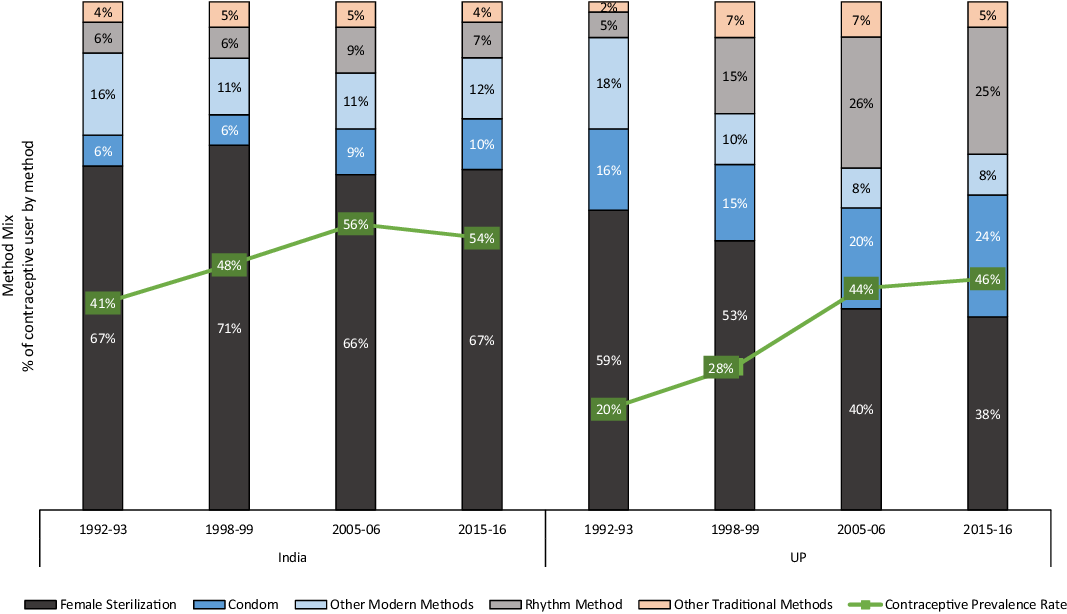
The contraceptive method mix and the prevalence rate from 1991-92 to 2015-16 in India and UP have been summarised in Figure 2. While the contraceptive prevalence rate increased across both India and UP, there is a contrast in how the method mix has changed between the two. In both India and UP, between NFHS-1 and NFHS-4, Female Sterilisation (FST) was the dominant method. However, over the years, while the contribution of FST has remained stagnant at around 67.0% in India, it has decreased from 59.0% to 38.0% in UP. Similarly, the contribution of TMs in India remained stagnant at around 10.0%, whereas in UP, it increased from 7.0% to 30.0%. Rhythm Method was the main TMs contributing to 25.0% out of the total 30.0%.
Method mix and prevalence of contraceptive methods in India and UP between 1991 and 2016, NFHS-1, NFHS-2, NFHS-3 and NFHS-4.

Profile of respondents
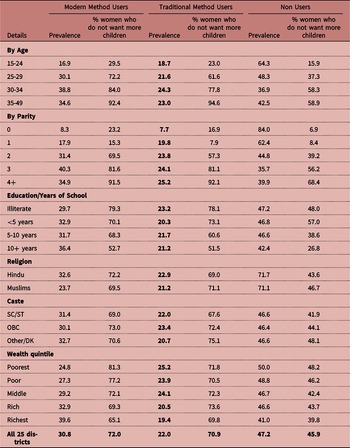
Socio-demographic characteristics of contraceptive users based on the UP TSU FP Survey data has been presented in Table 1. The percentage distribution for each category of a variable by use of modern and traditional contraceptives is included in the table. The overall prevalence of modern methods, TMs and non users of contraception were 31.8%, 22.0% and 47.2% respectively. With the exception of those belonging to the 15-24 age group, parity 1 and Muslim religion, in all other categories such as Scheduled Caste (SC), Scehuled Tribe (ST) and Other Backward Caste (OBC) the use of modern methods was higher than TMs. While there were differences in the prevalences of use of modern methods and TMs across age, parity and education the differences were small. Wealth was observed to have a positive association with the usage of modern methods but the reverse is true for usage of TMs. Table 1 also revealed that the majority of women who used modern methods (72.0%) and TMs (70.9%) did not want any more children.
Distribution of use and purpose of contraception among women by selected socio-demographic factors in 25 High Priority Districts of Uttar Pradesh, UP TSU Family Planning Survey 2016

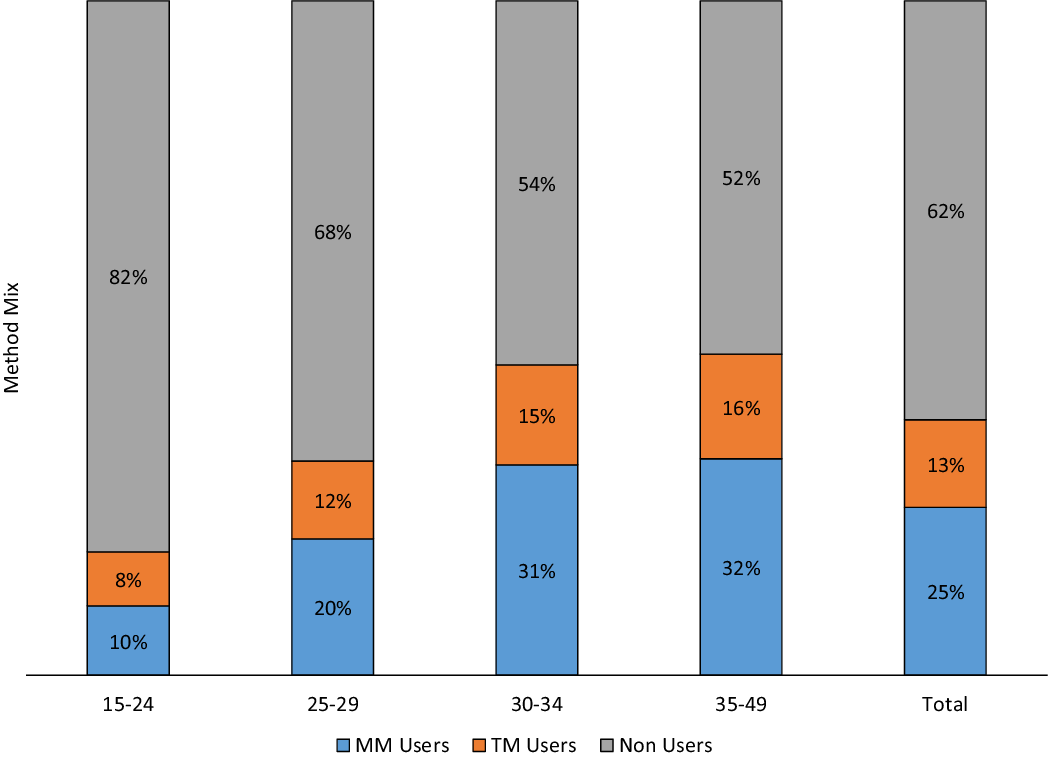
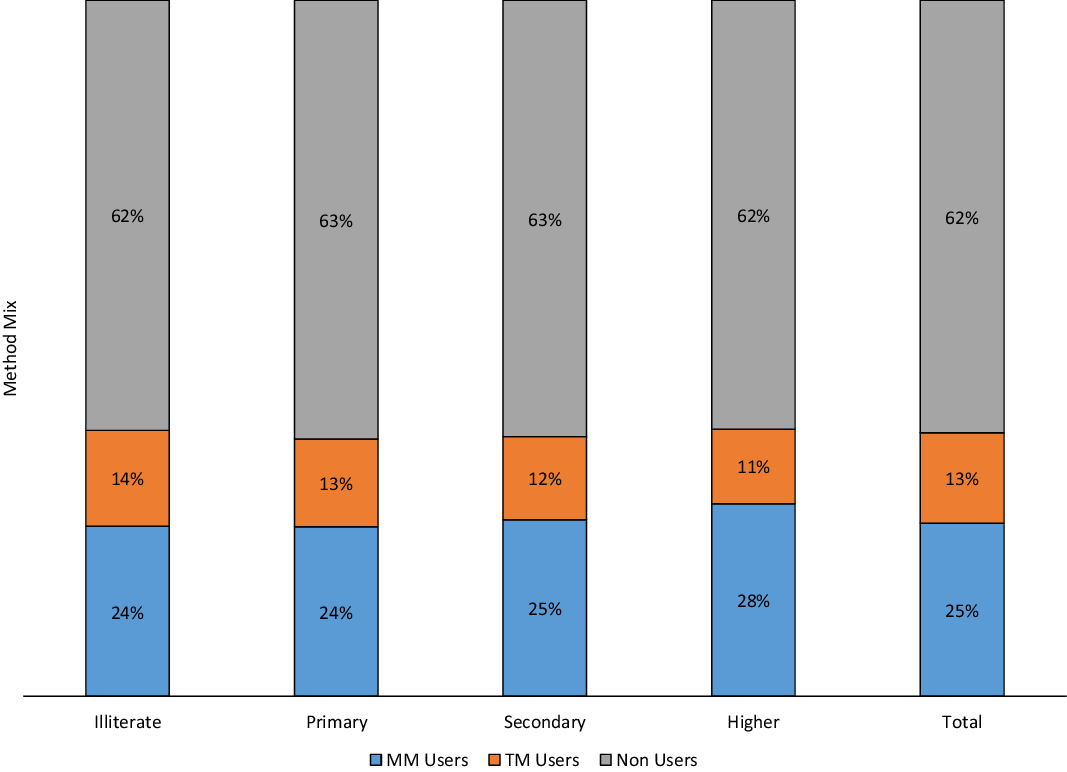
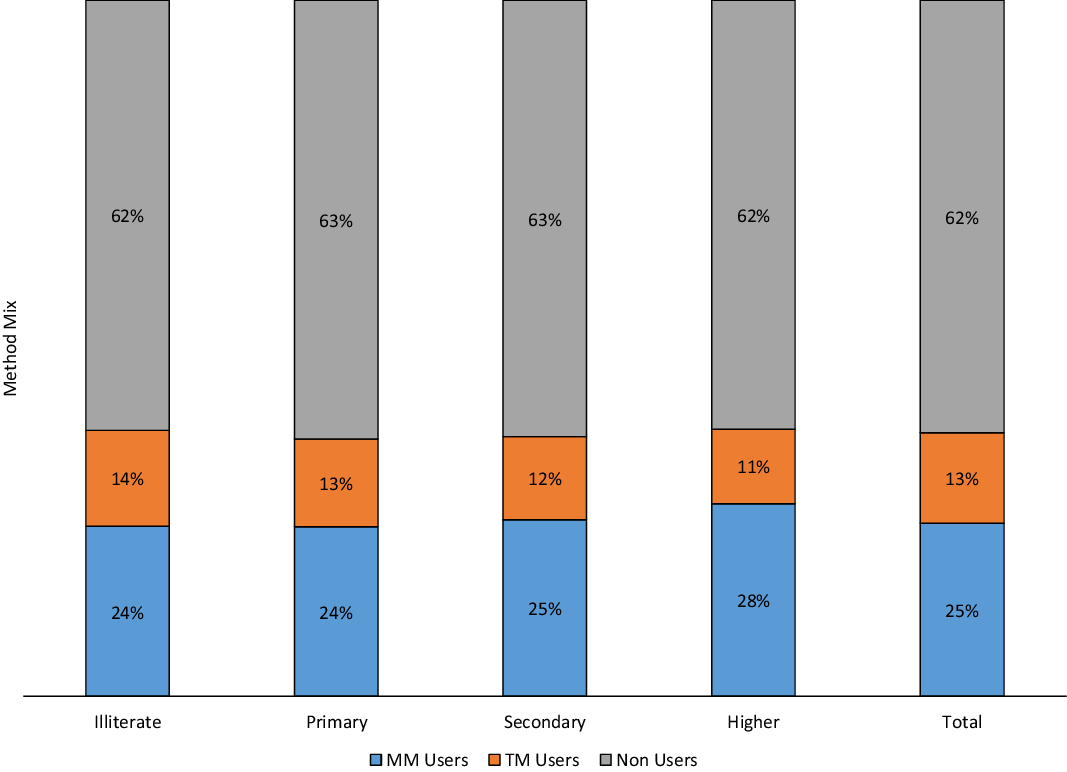
Table 1 was derived from FP Survey data and Figures 3 and 4 were created using NFHS-4 data for age and education for validation purpose. Percentage distribution of modern and traditional methods users within each age category are provided in Figure 3. This shows that the percentage differences between modern and traditional methods within each age category were similar to the corresponding Table 1 differences. For instance, for the four age categories, percentage differences as shown in the table were -1.8, 9.5, 14.5, 11.6 and the corresponding differences from the figure were 2.3, 8.7, 16.4 and 16.6, respectively. Similar to age categories, percentage distribution of modern and traditional methods users within each educational category were provided in figure 4. It is observed that the percentage differences between modern and traditional methods from the figure within each educational category were more or less similar to the corresponding Table 1 differences. However, in both the figures, the percentages of TMs users across categories of age and education compared to Table 1 were underestimated due to the large scale nature of NFHS (Rossier et al., Reference Rossier, Senderowicz and Soura2014).
Distribution of modern and traditional family planning usage by women’s age groups in 25 High Priority Districts of Uttar Pradesh, NFHS-4.

Distribution of modern and traditional family planning usage by women’s years of education in 25 High Priority Districts of Uttar Pradesh, NFHS-4.
FP methods awareness and availability
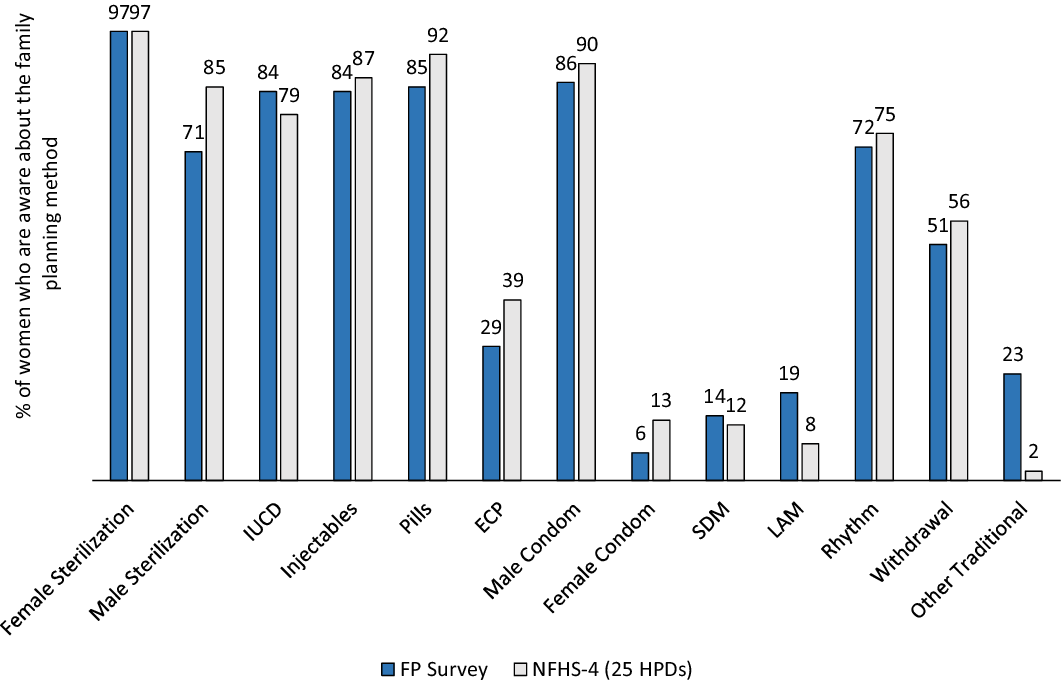
Awareness of family planning methods as per NFHS-4 and the UP TSU Family Planning Survey is presented in Figure 5. Almost all women surveyed were aware of terminal methods, especially female sterilisation. According to the UP TSU Family Planning survey, awareness of TMs of contraception was 78.0%, and 67.0% in NFHS-4. Among TMs users, nearly 80.0% of the women used the rhythm method according to NFHS-4 data (data is not shown here). However, knowledge about the ovulatory cycle which is critical to the effectiveness of the rhythm method, was found to be low as per NFHS-4. Analysis of NFHS-4 shows that only 20.0% of the women who were using the rhythm method were able to correctly identify the period in the menstrual cycle when they are most likely to get pregnant (data not shown).
Awareness of family planning methods among currently married women in Uttar Pradesh, NFHS-4 and UP TSU FP Survey.

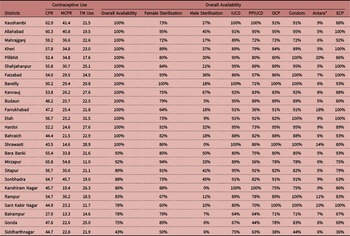
Availability of family planning services at the district level based on UP TSU Facility Mapping survey data is displayed in Table 2. The table also includes district wise contraceptive prevalence rate (CPR) and modern contraceptive prevalence rate (mCPR). According to the Table, the prevalence of TMs for most of the districts was in the twenties with a very few exceptions. However, in case of modern methods by districts wise availiability, there were significant differences between different methods. For instance, district wise availability of female steralization services, IUCD services, condom and ECP were much higher compared to male steralization and Antara services.
Family Planning services’ availability and traditional method use in twenty-five high priority districts of Uttar Pradesh, 2018

* Antara is the brand name for Injectable Contraceptive available in the Indian Public Health System
Traditional versus modern contraception: a multivariate analysis
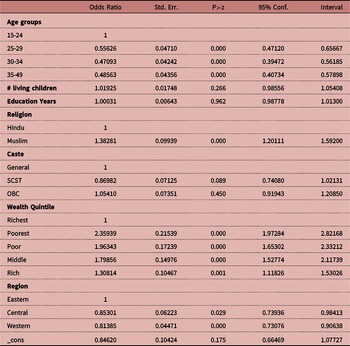
Results from logistic regression, comparing the adjusted odds ratios (AOR) of TM use to modern methods use among women using contraception in UP, are presented in Table 3. Neither education nor family size conferred higher or lower odds of the use of TM over modern methods. However, Muslim women were 38.0% (AOR:1.38; C.I.:1.20-1.59) more likely to use traditional methods over modern methods, as compared to Hindu women. In comparison to the richest wealth quintile, for each category of wealth quintile, the odds of using traditional methods over modern methods increased with a decrease in wealth. For instance, it was observed that compared to the richest category of women, the poorest women were 2.4 (AOR: 2.36; C.I.: 1.97- 2.82) times more likely to use traditional methods over modern methods (Table 3). The region of residence was also significant even after controlling for the other factors. To be specific, compared to the Eastern region, women in the Western region were 19% (AOR: 0.81; C.I.: 0.73-0.91) less likely to use traditional methods than modern methods.
Odds of using a traditional method compared to using a modern method among women in 25 high priority districts in Uttar Pradesh, UP TSU Family Planning Survey 2016

Discussion
There has been a substantial drop in fertility in India and UP in the last five decades. The comparative trends between India and UP show that the Total Fertility Rate in the state has always remained above the national average, however, the fertility trajectory is similar. Moreover, the fertility decline in UP has accelerated since 2000, and the gap in Total Fertility Rate between India and UP has reduced. The analysis of the last four National Family Health Surveys shows that the method of contraceptive use from 1992-93 to 2015-16 differed between India and UP. While sterilization remains the most popular method in India and UP, unlike in case of India, sterilization has reduced from 59% in 1992-93 to 38% in 2015-16 in UP (Figure 2). The notable increase in UP for method mix contribution is rhythm method, from 5% in 1992-93 to 25% in 2015-16 and the corresponding increase in India is from 6% to 7%. The increase in TMs in case of UP compared to India is also reflected in Contraceptive Prevalence Rate, 20% in 1992-93 to 46% in 2015-16 and the corresponding increase in India was 41% to 54% (Figure 2). While TMs are being opted by couples, their efficacy remains a concern. Failure rates are also higher among TMs users (23% as per FP Survey 2016) compared to modern method users (less than 5%). According to NFHS-4, only one in five women is knowledgeable about the timing of ovulation. It may be because family planning communication in India and UP tend to focus on limiting and spacing methods. Usually, women are not told clearly which methods are more effective. It is possible that women may consider TMs are also as effective as other modern methods and hence, may use them to control fertility. Therefore, information around failure and efficacy needs to be clearly articulated to the users of TMs. The program implementers need to incorporate these aspects without compromising the focus of modern methods. Focus on the scientifically proven efficacious modern methods within the government programs needs to continue with emphasis on improving availability, accessibility and utilization.
Our results indicate that there is an inverse association between TMs use with wealth quantile, meaning poorer people are more likely to use TMs. This is also seen when we examined differences by geography. In the Western region which is socio-economically more developed compared to the Eastern region, couples are 19% less likely to use TMs. This seems to point towards supply side issues of providing modern family planning contraceptive methods. A survey conducted by UP Technical Support Unit in 75 districts at facility level in 2018 suggests that supply issues play an important role (UP TSU, 2018). For instance, the availability of family planning services in all District Hospitals, Community Health Centers and block Primary Health Centers in all 75 districts of UP indicated that only 25% of the facilities provide female sterilization services, 11% male sterilization and 83% provide condoms (UP TSU, 2018). According to a 2016 survey conducted in 25 districts of UP on family planning practice among those currently married women aged 15-49 who were not using any contraceptive method at the time of survey were asked about their intention to use family planning in the future and the method they prefer, most popular method was female sterilization (UP TSU, 2016). It was estimated that only 36% of the potential additional users of female sterilization can be provided services with the current system (UP TSU, 2018).
Reliance on traditional methods of contraception in UP is likely to be associated with higher contraceptive failure rates, contributing to higher fertility and possibly increase in induced abortions. For instance, 16% of women were traditional method users who have completed their desired family size and they all had the unmet need for modern contraceptives (UP TSU, 2018). UP has markedly lower family planning coverage with modern methods among currently married women compared to India (50% and 72% in UP and India respectively), indicating that there is a need for major improvements in access to modern family planning methods (NFHS-4) (Halli et al., Reference Halli, Ashwini, Dehury, Isac, Joseph, Anand, Gothalwal, Prakash, Ramesh, Blanchard and Boerma2019). If there are still couples who make a choice in favour of TMs, they should be well informed about the risks associated with the use of traditional methods.
There are some limitations of the study. For instance, the study used different data sources from surveys conducted during different periods. The data limitations are (1) the birth history files of different surveys with different level of completeness; (2) different surveys have different levels of omission and deletions of births. However, the pattern and trends emerging from analyses of different data sources could be adequate to explore the research questions. A large difference was observed in the reported use of TM methods between the two sources used in the study: UP TSU FP Survey and NFHS. Both the surveys use identical questions for collecting information on contraceptive methods use and hence are comparable. Differences in the results observed between the two surveys possibly due to differences introduced by different interviewers recruited in the two surveys. However, the trends observed from the two surveys are comparable. It should also be noted that data on service availability were collected only for block level facilities. There is supposed to be a facility covering every 5000 population, Sub Centre, but Sub Centres are not covered in the Survey. These Sub Centres are expected to provide Condoms, Oral Pills and IUCD services. Moreover, even if the services are available at the block level facilities, utilization can be an issue because of lack of accessibility due to financial constraints especially among the families from socio-economically backward regions (Table 3). Besides, the National Family Health Surveys 2 and 4 have also shown that women are not using some of the family planning services such as IUCD due to fear of side effects.
Conclusions
Uttar Pradesh is passing through a remarkable fertility transition. While some decline in fertility was seen before 1980, the last three decades have shown a steady fall in fertility in UP. The TFR gap between India and UP has reduced, however, TFR in the state has always remained above the national average. In UP the use of family planning methods has gone up but unlike in India where high levels of reliance on sterilization for decades in declining fertility, this has not been the case in UP in spite of sterilization being the number one choice of family planning methods among the non-users. The notable increase in UP for method mix contribution is rhythm method but only one in five women is knowledgeable about the timing of ovulation. Hence, it is not surprising that failure rates are higher among TMs users (23%) compared to modern method users (less than 5%). Therefore, the family planning program implementers in UP need to clearly articulate to the TMs users as part of their counselling about the risk of failure. UP has markedly lower family planning coverage with modern methods among currently married women compared to India (50% and 72% in UP and India) indicating that there is a need for major improvements in access to modern family planning methods. For instance, it was estimated that only 36% of the potential additional users of female sterilization can be provided services with the current system (UP TSU, 2018). Therefore, family planning programmers in UP need to continue with emphasis on improving modern methods availability, accessibility, utilization, quality of care, counselling and better management of side effects.
Acknowledgements
We would like to thank Professor Ties Boerma of the Institute for Global Public Health, the University of Manitoba, for his comments on the earlier version of the paper.
Declarations
Ethics approval
Publicly available secondary data sources such as Sample Registration System (SRS) Bulletins (1971-2016) and different rounds of National Family Health Surveys were used. Regarding the data from two surveys conducted by the Uttar Pradesh Technical Support Unit, such as Family Planning Survey 2016 and the Facility Mapping Survey, 2018, ethical approval was obtained from the Institutional Review Board of Sigma, India and the University of Manitoba’s Institutional Ethics Board.
Conflict of interests
The authors have no conflicts of interest to declare.
Funding
This research received no specific grant from any funding agency, commercial entity or not-for-profit organisation.