Introduction
Corneal electroretinography (ERG) is an objective and noninvasive method to assess the function of the retina. It comprises of compound electrical signals elicited by light stimuli with components that have different retinal origins. Various studies in the past have provided descriptions of different electrical potentials from various origins that summate to give rise to the ERG waveform in response to a brief pulse of light (Robson & Frishman, Reference Robson and Frishman1995; Hood & Birch, Reference Hood and Birch1996; Viswanathan et al., Reference Viswanathan, Frishman, Robson and Walters2001) and in response to flickering light stimuli (e.g., Porciatti et al., Reference Porciatti, Moretti, Ciavarella and Falsini1993; Bush & Sieving, Reference Bush and Sieving1996; Hood & Birch, Reference Hood and Birch1996; Kondo & Sieving, Reference Kondo and Sieving2001; Viswanathan et al., Reference Viswanathan, Frishman and Robson2002).
The temporal, spatial, and spectral content of the stimulus can strongly influence each component and thereby the complete ERG signal. Sine wave stimuli are useful for studying if a system is linear or not. A linear system’s response to an addition of stimuli equals the addition of the responses to each separate stimulus. Furthermore, the response of a linear system to a sine wave stimulus should also be a sine wave with the same temporal frequency. However, the amplitude and phase may be changed. The presence of higher harmonics in the responses to sine wave stimuli indicates that the system is not linear. The ERG responses to sine wave stimuli measured in humans and nonhuman primates contain considerable higher harmonics, indicating the presence of nonlinearities (Baker & Hess, Reference Baker and Hess1984; Burns et al., Reference Burns, Elsner and Kreitz1992; Odom et al., Reference Odom, Reits, Burgers and Riemslag1992; Porciatti et al., Reference Porciatti, Moretti, Ciavarella and Falsini1993; Falsini et al., Reference Falsini, Iarossi, Fadda, Porrello, Valentini, Piccardi and Scullica1999; Kondo & Sieving, Reference Kondo and Sieving2001).
It is still unclear how the different retinal elements contribute to the response waveform of the flicker ERG. There is evidence that the fundamental component represents activity of photoreceptors (Abraham et al., Reference Abraham, Alpern and Kirk1985; Burns et al., Reference Burns, Elsner and Kreitz1992) and has predominant current sources in the outer retina (Baker et al., Reference Baker, Hess, Olsen and Zrenner1988). Others suggested that the cellular origins of the fundamental component depend on temporal frequency. Photoreceptors are found to contribute to the flicker ERG at high temporal frequencies (Burns et al., Reference Burns, Elsner and Kreitz1992), although pharmacological studies seem to suggest that responses reflecting activity of the photoreceptors are predominantly present at low temporal frequencies (Viswanathan et al., Reference Viswanathan, Frishman and Robson2002). This does not mean that photoreceptors do not respond to high temporal frequencies but that high temporal frequency responses do not elicit an ERG response. Nonneural elements may act as low-pass filters. Indeed, glial cells (Miller & Dowling, Reference Miller and Dowling1970; Burns et al., Reference Burns, Elsner and Kreitz1992) are also believed to contribute to low temporal frequency responses. The second harmonic component was found to have distinct contributions from both inner and outer retinal elements (Baker et al., Reference Baker, Hess, Olsen and Zrenner1988). Pharmacological agents that selectively block the signal transmission from photoreceptors to bipolar cells strongly altered the first and second harmonic components of responses to sine-wave stimuli, suggesting a substantial contribution of the inner retina to both fundamental and second harmonic flicker ERG response (Bush & Sieving, Reference Bush and Sieving1996; Kondo & Sieving, Reference Kondo and Sieving2001; Viswanathan et al., Reference Viswanathan, Frishman and Robson2002).
It was found that the first harmonic component of the ERG responses to high-contrast luminance sine wave stimuli shows a conspicuous dip at stimulus frequencies between 10 and 20 Hz (Burns et al., Reference Burns, Elsner and Kreitz1992; Odom et al., Reference Odom, Reits, Burgers and Riemslag1992; Kondo & Sieving, Reference Kondo and Sieving2001; Viswanathan et al., Reference Viswanathan, Frishman and Robson2002). At very similar temporal frequencies, the second harmonic component displays a maximum. The dip in the fundamental component has been explained by an interaction of signals originating in ON- and OFF-bipolar cells (Kondo & Sieving, Reference Kondo and Sieving2001), which cancel each other at these particular temporal frequencies. However, as acknowledged by Kondo and Sieving (Reference Kondo and Sieving2001), the vector addition model can only explain the dip in the fundamental component but inherently fails to explain the behavior of the second harmonic component.
In the present paper, we describe the results of ERG measurements to luminance sine wave stimuli in which not only the temporal frequency but also contrast were varied. The inclusion of measurements at different contrasts enabled us to identify two different ERG components. The addition of the two response components can describe the ERG waveforms at all conditions and therefore provides an explanation for the characteristics of the fundamental as well as the second harmonic component.
We provide an algorithm with which the two components can be extracted from the ERG responses at each stimulus condition, so that the characteristics of each component can be described. We here present the dependency of each component’s amplitude on temporal frequency and contrast.
Materials and methods
Subjects
ERGs were recorded from five normal subjects ranging in age from 26 to 49 years (mean ± s.d.: 34.4 ± 8.8). All subjects underwent a complete ophthalmologic examination. They had clear ocular media, normal fundus, and normal color vision. Informed written consent was obtained from each subject. The experiments adhered to the tenets of the declaration of Helsinki, and the protocol was approved by the institutional ethical committee.
ERGs were recorded from the right eye of each subject. The left eye was covered with a patch. The pupil was dilated with 0.5% tropicamide (Pharma Stulln, Stulln, Germany). Conjuncain EDO (Oxybuprocain hydrochloride 0.04%, Dr. Mann Pharma, Berlin, Germany) was used as a topical anesthetic if requested by the subject.
The active (DTL) electrode was placed over the lower conjunctiva and attached close to the inner and outer canthus. The forehead and ipsilateral temple were cleaned with alcohol for skin electrode placement and scrubbed with Nuprep abrasive skin preparing gel (Weaver and Company, The Hague, The Netherlands). Gold cup electrodes, filled with electrode paste (Weaver and Company, The Hague, The Netherlands), were used as ground (forehead) and reference (ipsilateral temple) electrodes.
Visual stimuli
A full-field stimulus was produced using a ganzfeld bowl (Q450SC; Roland Consult, Brandenburg, Germany) with six arrays of differently colored light-emitting diodes (LEDs) as light sources in a Retiport system (Roland Consult). The mean luminance, waveform, contrast, relative phase, and frequency of the output modulation of each array can be independently set with the Retiport software. Sine wave stimuli were obtained by using the white LEDs (CIE coordinates: x: 0.37, y: 0.42) only. The mean luminance of the stimulus was 250 cd/m2 (resulting in a mean retinal illuminance of approximately 12,500 td assuming a pupil diameter of 8 mm), modulated at 100, 75, 50, 25, and 0%. Michelson contrast  . Measurements were repeated at different temporal frequency (2, 4, 8, 12, 16, 24, 36, 48, and 60 Hz). In a few subjects, additional measurements at 72, 84, 100, and 120 Hz were performed. We checked that the waveform of the stimulus was indeed sinusoidal by measuring the luminance output with a light sensitive diode.
Data acquisition and signal processing
The amplifier of the Retiport system (Roland Consult) was used and the signal was amplified 100,000 times. The signals were band-pass filtered between 1 and 300 Hz. Fifty-Hertz (mains) intrusion was minimal making the use of a notch filter not necessary. The responses were recorded in 40–140 cycles of 1 s each and averaged. The number of averages depended on the signal quality. To avoid onset artifacts, the recordings to the first two stimulus cycles were discarded. The noise level was estimated by Fourier analysis from responses to 0% contrast stimuli. Signal analysis was performed using self-written programs in MATLAB and spreadsheets in Excel 2003.
Results
Human sinusoidal ERG
Fig. 1A displays original responses to different temporal frequencies and different contrasts. The response waveforms show distinct characteristics at different temporal frequencies. Fig. 1B displays high-frequency responses at 100% contrast. At temporal frequencies up to about 12 Hz and at low contrasts, the response closely follows the sinusoidal stimulus without many distortions. As contrast and/or temporal frequency increases, a transient component intrudes the response (arrows in Fig. 1A). This component was not the result of an artifact because the stimuli closely resembled a sine wave (as was checked with a light sensitive diode; see Materials and methods section). Furthermore, artifacts caused by intrusion of electrical signals from the stimulator, possibly picked up by the electrodes, could be excluded because recordings using maximal stimulus contrast but with the eyes covered did not yield any significant response. Finally, the responses closely resembled those recorded by others (Kondo et al., Reference Kondo, Khan, Bush and Sieving2000; Viswanathan et al., Reference Viswanathan, Frishman and Robson2002). We are therefore confident that two components with physiologic origins can be identified. The two components differ in their frequency and contrast characteristics. Before we expand on the idea of two response components, the responses will be compared with those described in the literature.
Examples of ERG recordings to photopic sine wave luminance stimuli at different frequencies and contrasts. (A) Waveforms elicited to sine wave stimuli modulated at four different contrasts (100, 75, 50, and 25%) and at seven different temporal frequencies (2, 4, 8, 12, 16, 24, and 36 Hz). Each trace represents a segment equivalent to 500-ms recording duration. The arrows point at the transient response components. (B) Waveforms elicited to sine wave stimuli modulated at 100% contrast at temporal frequencies ranging from 48 to 120 Hz.

Fourier analysis
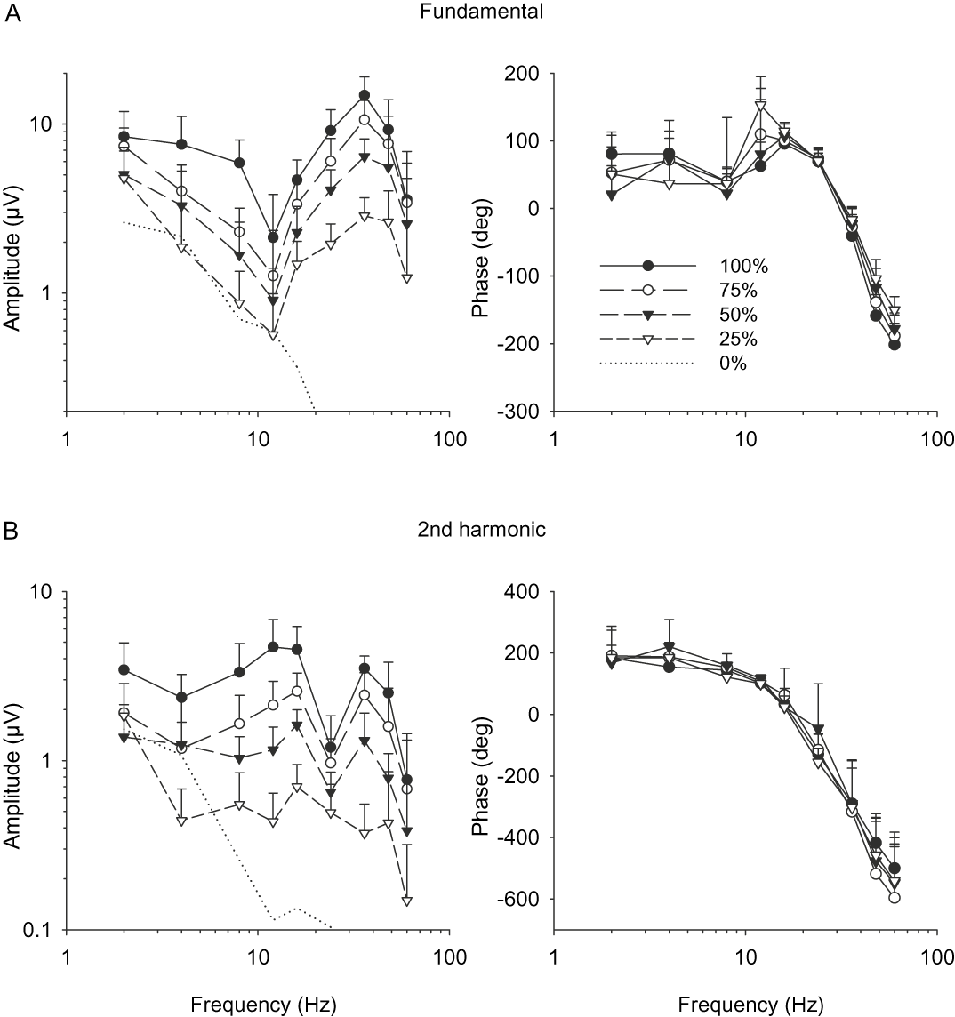
To compare the results of our measurements with those of others (Burns et al., Reference Burns, Elsner and Kreitz1992; Odom et al., Reference Odom, Reits, Burgers and Riemslag1992; Kondo & Sieving, Reference Kondo and Sieving2001; Viswanathan et al., Reference Viswanathan, Frishman and Robson2002), the responses were Fourier analyzed. The results of this analysis are displayed in Fig. 2. They are in agreement with the literature data: The amplitude of the fundamental component (Fig. 2A) displays a dip at about 12 Hz and shows a maximum at 36 Hz. The dip can be observed at all contrasts. The second harmonic component (Fig. 2B) displays a maximum between 12 and 16 Hz, coinciding with the minimum in the fundamental component, indicating a frequency-doubled response. The second harmonic shows a minimum at 24 Hz and a second maximum at about 36 Hz. This can be observed at all but the lowest (25%) contrasts. The maximum in the second harmonic component at high temporal frequencies coincides with the maximum in the fundamental component, indicating that it is not caused by a frequency-doubled response.
Fundamental (A) and second harmonic (B) components of response waveforms obtained after Fourier analysis given as a function of temporal frequency plotted separately for different contrasts. Filled circles represent the plot for 100% contrast, open circles for 75% contrast, filled triangle for 50% contrast, and the open triangles for 25% contrast. Error bars represent the s.d. The amplitude plot is double logarithmic; the phases are plotted in a linear-log way. The dotted lines represent the amplitude of noise measured at 0% contrast.

The dotted lines in the left plots of Fig. 2A and 2B show the noise level, which was recorded to 0% contrast stimuli. Noise is particularly prominent at the lower frequency region. This is indicative for the presence of pink (1/f) noise to which eye movements probably contribute. ERG amplitudes at 25% contrast and low temporal frequencies are barely larger than noise. However, the signal to noise ratio (SNR) is large at high contrasts and at high temporal frequencies. The phase data were only considered when the SNR was equal or more than a factor of 2.
The phases of the fundamental and second harmonic components are given in the right plots of Fig. 2A and 2B, respectively. The phase of the fundamental component (Fig. 2A, right plot) was relatively constant up to about 8 Hz. A discontinuity in the phase plot was apparent between 8 and 12 Hz where the response phases increased (i.e. the response delay decreased), indicating a transition in the mechanism underlying the responses. Above 16 Hz, the phase lag steadily increased. The phase lag was slightly larger for the high-contrast response. The second harmonic components showed a monotonic increase in the phase lag with increasing temporal frequency. No significant effect of change in contrast level was noticed.
Component analysis
Inspection of the original responses, displayed in Fig. 1, led us to suggest that two main components with different dependencies on frequency and contrast determine the responses to luminance sine wave stimuli. One component closely follows the sinusoidal stimulus. This component we termed “sine-like.” The other component is a transient that can mainly be observed at high temporal frequencies and at high contrasts (arrows in Fig. 1A). We have called this the “transient” component.
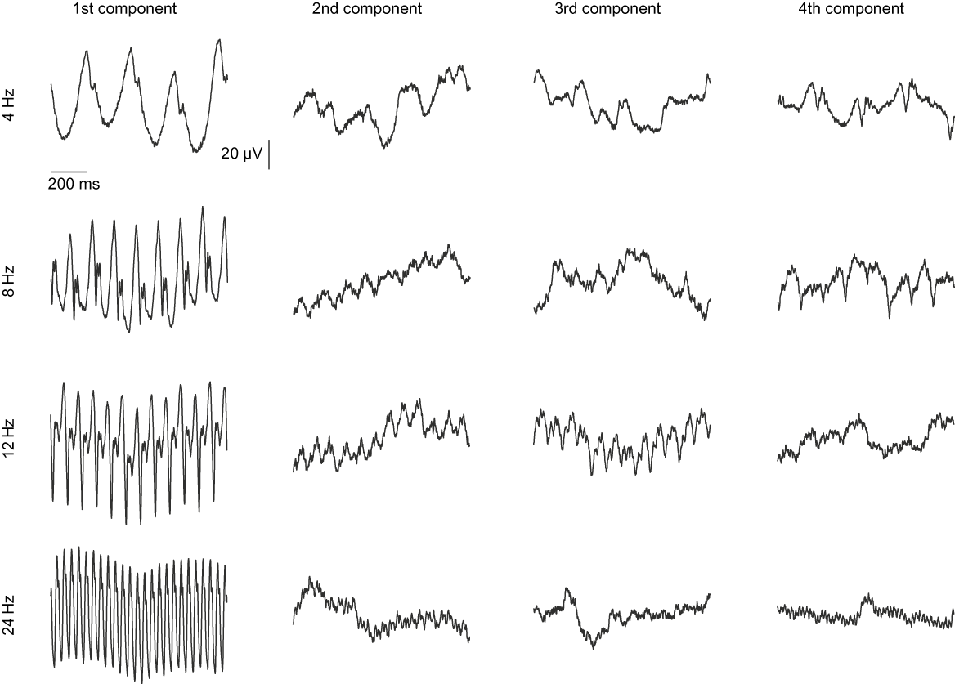
The proposal of the presence of two separate components is attractive but based on a subjective interpretation of the waveforms. We tried to determine whether more objective methods were also able to separate two components. For that, we measured responses in one subject (G.P.) at nine different contrasts (100, 85, 75, 65, 50, 35, 25, 15, and 5%). These measurements were repeated at four different temporal frequencies (4, 8, 12, and 24 Hz). The measured responses were subjected to a principle component analysis (PCA). The PCA determines on the basis of statistical methods the constituting components of the responses to the different contrasts. However, the PCA assumes that only the amplitude of the each component is changed when contrast is altered. Contrast-dependent changes in waveform and in timing of different components make the PCA less conclusive. The PCA returns as many components as there are measurements (i.e., nine in this case). We only show the first four components out of the PCA because they determine about 90% of the variability of the original responses at 4, 8, and 12 Hz. These components explained more than 97% of the variability of the 24-Hz data. The remaining 3–10% of the variability is explained by the last five components, which makes them less interesting. The responses at the different contrasts were normalized to the same s.d.s at all contrasts. This has the advantage that components can be separated more easily because every measurement is weighted equally (without the normalization, the response at 100% would obtain the largest weight and dominate the PCA). The disadvantage of the normalization is that also drift (leading to the mentioned 1/f noise) measured with low-contrast stimuli gets a larger weight. The drift reveals itself in the PCA. Fig. 3 shows the first four components from the PCA for the different temporal frequencies. At 4 Hz, two clear response components (the first and the fourth PCA components) can be distinguished. The other two we interpret as drift components. The first component is equivalent to the sine-like component. The fourth component would be the putative transient component. At 8 Hz, the components cannot be completely separated. The first component is still a compound signal but dominated by the sine-like component, which may also be visible in the second PCA component. The fourth PCA component is again equivalent to our transient component. The first PCA component at 12 Hz is again a mixture but this time dominated by the transient component, which probably is also revealed in the third PCA component. The sine-like component is present in the second PCA component. However, at this temporal frequency, separation of components is less obvious because they resemble each other more closely. Finally, the PCA at 24 Hz reveals basically only one component. In conclusion, the PCA reveals components that are consistent with a more sine wave-like response and a transient response. However, abovementioned contrast-dependent changes in waveform and delays in addition to the drift make the PCA difficult to interpret.
Results of a PCA on responses at different contrasts. In the PCA, it is assumed that the same constituting components determine the responses at all contrasts and that the waveform and timing of the components are not changed. The overall amplitude of each component is varied to describe the original responses. The original responses at different contrasts were normalized so that they all have the same s.d.s. The PCA was repeated for responses at four different temporal frequencies. Each PCA returned nine components. The four main components are displayed. Although sine-like and transient components can be detected at 4 Hz (components #1 and #4 respectively), 8 Hz (#2 and #4), and 12 Hz (#2 and #3), the PCA does not completely separate components (8 and 12 Hz components #1) and is influenced by drift (4 Hz #2 and #3; 8 Hz #3; and 12 Hz #4). The 24-Hz response is mainly determined by one component.

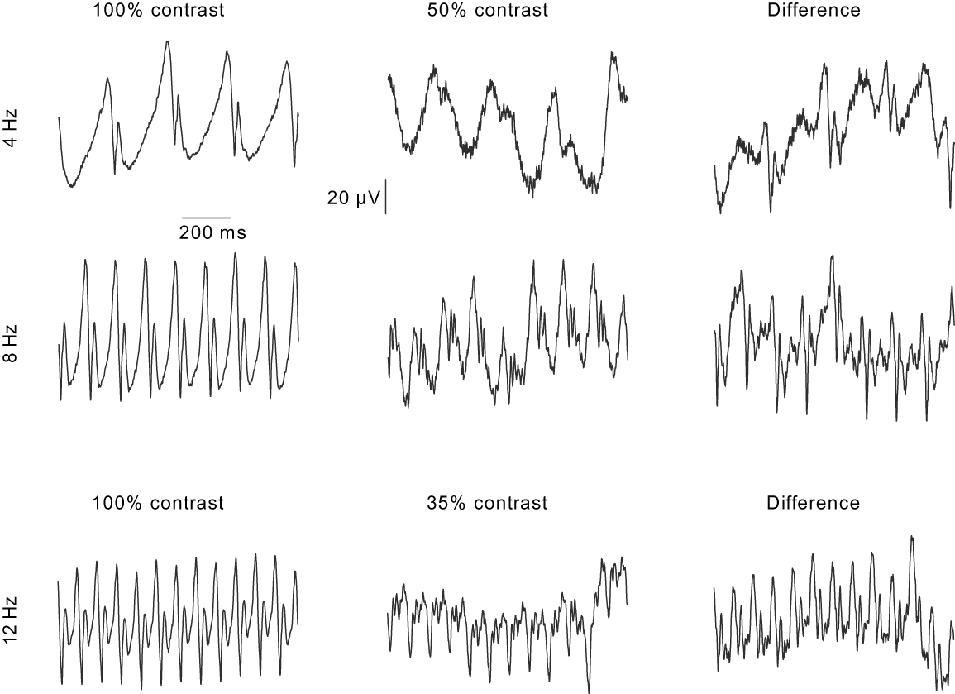
In addition to the PCA, we analyzed the 4-, 8-, and 12-Hz responses as follows: The 4- and 8-Hz responses (first and second row) at 50% contrast (middle column) were amplified to obtain the same peak-to-peak value as the responses at 100% contrast (left column). The amplified 50% contrast responses were then subtracted from the 100% contrast responses. The resultant is shown in the right column of Fig. 4. It can be seen that the 50% contrast responses were more sine wave like. A similar procedure was used for the 12-Hz responses (Fig. 4, third row) with the difference that now the responses at 35% contrast were amplified and subtracted from the 100% contrast responses. The responses at 35% were more transient.
Original responses at 100% contrast (left column) and at a lower contrast (middle column; 50% contrast for 4- and 8-Hz stimuli; 35% at 12 Hz). The responses at the lower contrasts were amplified to the same peak-to-peak values as in the 100% contrast responses at the same frequency. The right column displays the subtraction of the low-contrast responses from the 100% contrast responses. Note that the waveforms of the subtractions at 4 and 8 Hz resemble the 100% contrast response at 12 Hz and are more dominated by the transient response. The 50% contrast responses are strongly dominated by the sine-like component. The subtraction at 12 Hz resembles the 100% contrast responses at 4 and 8 Hz and contains substantial sine-like components. The 12 Hz, 35% contrast response is strongly dominated by the transient component.

The difference responses (right column) at 4 and 8 Hz resemble the 100% contrast response at 12 Hz. Vice versa, the difference signal at 12 Hz is similar to the 100% contrast responses at 4 and 8 Hz. We interpret these results that the 100% contrast responses are mixtures of two components. At 4 and 8 Hz, the responses are dominated by the sine-like component at 12 Hz by the transient component. The response differences are also mixtures but now dominated by the other signal (i.e., transient response at 4 and 8 Hz and the sine-like component at 12 Hz). The low-contrast responses contain nearly exclusively one component (the sine-like component at 4 and 8 Hz and the transient component at 12 Hz).
In conclusion, we propose the presence of at least two independent main components in the responses to luminance sine wave stimuli. To be able to separate these components at any temporal frequency and any contrast, we further assume that the form of the transient component is largely independent of temporal frequency. This assumption is based on the following analysis on the 100% contrast responses at the different temporal frequencies.
Frequency effects
The 100% contrast response curves were shifted along the time and amplitude axis so that the minima of the transient components (indicated by the arrows in Fig. 1A) coincide. In Fig. 5A, for each temporal frequency, a part of a cycle containing the transient response is shown. The transient response does not show substantial response broadening with increasing temporal frequency. In addition, the local maxima after the minimum of the transient response occur at very similar times (as indicated by the vertical dashed line). We further amplified the response at the lower temporal frequencies to equal amplitude values for the distance between the minimum and this local maximum. The results are shown in Fig. 5B. The transient responses have similar waveforms for all temporal frequencies. The maxima preceding the transient response have different amplitudes and times of occurrences because these maxima are mainly determined by the putative sine-like component.
(A) One period of a 100% contrast responses at different temporal frequencies. The positions of the minima of the putative transient components were shifted to coincide. The transient components do not become broader as temporal frequency increases. (B) The same plot as in (A). But now the waveforms were normalized to have the same amplitude to the second maximum at the end of the transient response.

Separation of components
As mentioned above, the responses to sinusoidal stimuli were considered to be the addition of two independent (sine-like and transient) components. We used the following algorithm to separate the components in the responses to stimuli between 1 and 24 Hz. An example of the analysis on a 4-Hz response is shown in Fig. 6. Based on the analysis given above, it was assumed that the transient component had the same form at all contrasts and all temporal frequencies up to 24 Hz. One transient component was isolated from the response to an 8 Hz stimulus in subject J.K. This component was used to describe all transient components in all subjects and for all stimuli between 1 and 24 Hz. Multiples of these transient components were evenly distributed over the 1000-ms recording episodes according to the stimulus frequency (i.e., two components at 2 Hz, four at 4 Hz, etc.). At each temporal frequency, the components were shifted by hand along the time axis to coincide optimally with transient components in response to the 100% contrast stimulus. This shift was then also used at the lower contrasts (although occasionally very small adjustments were necessary).
An illustration of the method to extract sine-like and transient components from the measured responses. Here, a 4-Hz response is displayed. (A) The original response waveform obtained from one of the subjects. (B) Four transient components are evenly distributed (i.e., with 250-ms intervals in this case) over the 1-s recording episode. (C) The transient components are aligned along the time axis. This was performed by eye. (D) The amplitude of transient components is changed and each individual component is shifted vertically to fit optimally with the measured response. The fitting procedure was performed by the solver routine of the Excel 2003 program. (E) An overlay of the original response and the fitted transient components (dashed line). (F) The subtraction of the transient component from the original recording gives the isolated sine-like component.

Subsequently, the transient components were fitted to the actual responses. The fitting procedure was performed by the Solver routine of the Excel 2003 program. In the fitting procedure, a single amplitude factor was used to fit the actual response of all components. In addition, each individual transient component in the 1-s recording period was shifted along the amplitude axis to take into account drift effects. In the further analysis, only the amplitude factors were considered. Observe that this amplitude factor is only in arbitrary unity and cannot directly be compared with the amplitude of the sine-like component (see below).
The sine-like components were extracted by subtracting the transient components (without the shifts along the amplitude axis) from the original responses. The sine-like component closely follows the sinusoidal stimulus, although at high contrast, there are some distortions (examples can be seen in the bottom plot of Fig. 6 and in Fig. 7). The amplitude of the sine-like component was defined as the amplitude of the fundamental component out of the Fourier analysis on this response.
Original responses measured in subject G.P. Temporal frequencies: 4, 8, 12, and 16 Hz. 100 and 75% contrast responses are shown at each temporal frequency. The lower plots display the original responses after subtraction of the transient components. These are the putative sine-like components.

Fig. 7 displays examples of original responses and the remaining sine-like component after subtraction of the transient components measured in subject G.P. Responses for 100 and 75% contrast responses at 4, 8, 12, and 16 Hz are shown. For the 4-Hz stimulus, a substantial transient component was only present at 100% contrast. In addition, the sine-like component decreased in amplitude with increasing temporal frequency and was very small at 16 Hz. In contrast, the transient component was large at 16 Hz.
It was not possible to use the above-described procedure at temporal frequencies above 24 Hz because the transient components merged when evenly distributed. Because the sine-like component was negligibly small at these temporal frequencies (see Figs. 7 and 8), we used the amplitude of the fundamental components out of the Fourier analysis as an amplitude measure for the transient component. The PCA indeed showed that one component dominated the 24-Hz response at all contrasts. For the 24-Hz response, both analyses (i.e., signal separation and Fourier analysis) were performed. It was found that the transient component amplitudes obtained from these two types of analyses differed by a constant ratio at all contrasts. To combine the results of both types of analysis, the amplitude factors obtained for the 1- to 24-Hz stimuli were multiplied by this ratio. Through this procedure, it was not only possible to compare the amplitudes of the transient components at low and high temporal frequencies but also with the amplitudes of the sine-like components.
Logarithm of the amplitude of the sine-like (A) and transient (B) components plotted as a function of the logarithm of the temporal frequency. The amplitudes are plotted separately for the different stimulus contrasts. Observe the large differences (by a factor of up to about 20) between the 75 and 100% contrast transient response amplitudes at low temporal frequencies. At high temporal frequencies, the effects of contrast increase from 75 to 100% are much smaller.

The estimated amplitudes of the sine-like and transient components are plotted as a function of temporal frequency in Fig. 8A and 8B, respectively. Separate plots are given for the different stimulus contrasts. The sine-like response amplitude (Fig. 8A) displays a low-pass characteristic. With increasing temporal frequency, the amplitude decreases. For frequencies above 10 Hz, the responses were generally decreased by a factor of 10 in comparison with the low-frequency responses.
The amplitude of the transient component is band-pass and rises with increasing temporal frequency until 40 Hz and decreases steeply at higher frequencies. The 100% contrast response amplitudes display a shoulder below 10 Hz. For these temporal frequencies, the response amplitudes are very small at low contrasts but the amplitudes of 100% contrast responses were much larger. An increase of the stimulus contrast from 75 to 100% resulted in an about 20-fold amplitude increase.
To show the effect of contrast on the amplitudes of the two flicker ERG components more clearly, they are plotted against each other in Fig. 9 for different temporal frequencies. In the left plots, the amplitudes are given, whereas in the right plots, the response amplitudes were normalized to the 100% contrast response. The amplitude of the sine-like component displays an accelerating nonlinearity for all frequencies at which the amplitudes could be obtained. The amplitude of the transient component displayed a strong accelerating nonlinearity at the lower temporal frequencies. At 24 Hz, the responses depended in an approximately linear manner on contrast, whereas there are signs of a compressive nonlinearity at 48 Hz.
Amplitudes of the sine-like (upper plots) and transient (lower plots) components plotted as a function of contrast. The amplitudes of sine-like component for 4-, 8-, and 12-Hz stimuli are plotted. The transient component measured at 4, 8, 12, 24, and 48 Hz is plotted. The error bars represent the s.d. In the right plots, the response amplitudes were normalized to the response amplitude at 100% contrast.

Discussion
We were able to describe all responses measured in human subjects to luminance sine wave stimuli at different temporal frequencies and contrasts on the basis of two independent components. The amplitudes of the two components depended differently on temporal frequency and contrast. The sine-like component was more prominent in the lower frequency region, whereas the transient component was larger in the high-frequency region. The waveform of the transient response does not depend on contrast and temporal frequency and seems to be more nonlinear. In most previous studies (Levett, Reference Levett1971; Burns et al., Reference Burns, Elsner and Kreitz1992; Odom et al., Reference Odom, Reits, Burgers and Riemslag1992; Kondo & Sieving, Reference Kondo and Sieving2001; Viswanathan et al., Reference Viswanathan, Frishman and Robson2002), high-contrast stimuli were used. The recorded responses and their characteristics closely resembled our high-contrast responses. But because of the absence of a comparison with the responses measured at low contrasts, it is much more difficult to recognize the two components. From the data of Levett (Reference Levett1971), it can be inferred that the transient component cannot be measured at temporal frequencies below 1 Hz even when the contrast is 100%. The waveform of the responses measured by Troelstra and Garcia (Reference Troelstra and Garcia1975) differed from ours and the others. In addition, the responses had other frequency characteristics. However, in these measurements, the subjects were probably dark adapted and the responses mainly rod driven.
The human flicker ERG response to sinusoidal stimuli was frequency doubled at frequencies between 10 and 20 Hz. This was also described previously (Odom et al., Reference Odom, Reits, Burgers and Riemslag1992; Kondo & Sieving, Reference Kondo and Sieving2001; Viswanathan et al., Reference Viswanathan, Frishman and Robson2002). Furthermore, the fundamental and second harmonic amplitude displayed a contrast dependency in agreement with previous studies (Odom et al., Reference Odom, Reits, Burgers and Riemslag1992). At its minimum, the fundamental component displays a phase shift, indicating that there is a transition of the underlying mechanism. The presence of the dip in the fundamental component near 12 Hz has previously been explained as the result of a response cancellation of depolarizing and hyperpolarizing bipolar cells (Kondo & Sieving, Reference Kondo and Sieving2001). It was assumed that the responses of these two cell types can be described by a linear vector analysis and that the responses cancel because they are 180 deg out of phase. However, as Kondo and Sieving (Reference Kondo and Sieving2001) mention, the vector addition model cannot explain the maximum in the second harmonic component between 10 and 20 Hz. Our proposal of two components provides an explanation for these findings. Below about 12 Hz, the responses are mainly dominated by the sine-like component, whereas they are mainly determined by the transient component above 12 Hz. At the 12-Hz temporal frequency, the two components have similar amplitudes and their addition results in the frequency-doubled response.
In previous studies, the photoreceptoral component in the flicker ERGs of nonhuman primates was isolated by application of cis-2,3-piperidine dicarboxylic acid (PDA) and l-2-amino-4-phosphonobutyric acid (APB), thereby blocking all signal transmission from the photoreceptors to postreceptoral cells (Kondo & Sieving, Reference Kondo and Sieving2001; Viswanathan et al., Reference Viswanathan, Frishman and Robson2002). Similar to our high-contrast sine-like response, the photoreceptoral responses have a waveform that closely resembles the sinusoidal input with some distortions. Baron and Boynton (Reference Baron and Boynton1975) recorded local ERGs (LERGs) to sinusoidal luminance modulation with intraretinal microelectrodes positioned close to the foveal cone outer segments. They also found that 5-Hz responses closely followed the sinusoidal input but with some distortion for high-contrast stimuli. In addition, similar to previous findings (Baron et al., Reference Baron, Boynton and Hammon1979; Viswanathan et al., Reference Viswanathan, Frishman and Robson2002), we found that the amplitudes of the sinewave-like responses continuously decreased with increasing temporal frequency. Baron and Boynton (Reference Baron and Boynton1975) showed that with 100% contrast stimuli, the amplitude of the sinewave-like LERG is fairly constant up to a corner frequency above which the response amplitudes decrease. Again, this is similar to our findings (Fig. 8A). At a similar retinal illuminance as we used, Baron and Boynton (Reference Baron and Boynton1975) found, however, a higher corner frequency (20–30 Hz) than we did (10 Hz). On the basis of the similarities, we propose that the sine-like component may originate in photoreceptor activity. Obviously, this proposal is based on similarities and analogies. More direct measurements, comparing normal ERG recordings with recordings of photoreceptors only (either in the LERG or by using pharmacological blockade) in nonhuman primates, might be a critical experiment for the proposal.
As already recognized before (Viswanathan et al., Reference Viswanathan, Frishman and Robson2002), it is puzzling why photoreceptor-driven responses would be strongly attenuated at high temporal frequencies. There are a few possibilities that might explain this discrepancy. First, Viswanathan et al. (Reference Viswanathan, Frishman and Robson2002) and we used corneal electrodes. Even when the photoreceptors are the only neurons driving the ERG, it cannot be excluded that nonneuronal processes are involved, which may act as a low-pass filter. Second, the corneal electrode records from all retinal locations. Possibly, responses originating at different retinal locations have slightly different delay times, resulting in a temporal smearing when recording from a large retinal area that again would act as a low-pass filter. This might explain why the LERG (that is a direct record from a limited number of cones) may display higher cutoff frequencies.
The response characteristics of the transient component are very similar to the APB-sensitive component of the flicker ERG measured in nonhuman primates (Kondo & Sieving, Reference Kondo and Sieving2001): Both responses increase in amplitude with increasing temporal frequency, display a shoulder in the region between 5 and 30 Hz, and are maximal at a frequency between 40 and 60 Hz. This may suggest that the transient component reflects the activity of the inner retinal (bipolar cells and ganglion cells). Alternatively, the transient component might reflect ganglion cell activity. The transient component, that can be recognized in the low temporal frequency responses displayed by Viswanathan et al. (Reference Viswanathan, Frishman and Robson2002) (cf., their Fig. 1A), is reduced after the administration of tetrodotoxin (TTX) and N-methyl-d-aspartatic acid (NMDA). This suggests that the transient component may reflect ganglion cell activity. Because of this sensitivity to TTX, the transient component is probably not related to the a-wave, which is a negative going response in the flash ERG. The M-wave is another negative response that originates in the proximal retina and can be observed at stimulus on- and off-set (Sieving & Steinberg, Reference Sieving and Steinberg1985; Sieving et al., Reference Sieving, Frishman and Steinberg1986). As a result, the M-wave shows a frequency-doubled response. In contrast, the transient component appears only once during a stimulus cycle, so that it seems improbable that it has the same origin as the M-wave. However, again, more studies are needed to establish the cellular basis and the ERG homologues of this component.
Thirty-Hertz flicker ERGs are often recorded in a clinical setting. Although the sinusoidal stimulus waveform is different from the waveform normally used in the clinic (usually trains of short flashes), the recorded ERGs will probably be not very different. Trains of flashes contain higher harmonics (60, 90 Hz, etc.) in comparison with the sinusoidal stimuli. However, the response amplitudes to these higher harmonics will be very small. Therefore, it can be expected that the clinically used flicker ERG is dominated by the transient component.
Acknowledgments
The work was supported by German Research Council (DFG) grant KR 1317/9-1. J.K. is fellow in the Excellence Program of the Hertie Foundation. The authors like to thank Prof. Kruse for general support.