Introduction
Organic farming is characterized as a low external input agro-ecosystem. More than 80% of the organic farmers in Germany are livestock producers running a mixed farming system where ruminants, particularly cattle, dominateReference Rahmann, Nieberg, Drengemann, Fenneker, March and Zurek1. Among other inputs, all feed should come from the farm itself or be produced within the region2. In conventional farming, it is common practice to purchase feed for animals in substantial amounts, whereas in organic agriculture the aim is self-sufficiency. However, because of economic pressure, mainly due to declining milk prices, conventional as well as organic dairy farmers in Germany are currently putting more and more effort into increasing the annual milk yield per cow. Since the market prices for organically produced cereals have been significantly lower for several years compared to previous organic grain prices >10 years ago, it has become attractive for organic dairy farmers to feed higher amounts of concentrates and also succulent feed (e.g. processing by-products), of which some is purchased, to improve the dairy performance of their farms (kg milk per cow). Some farms now show a performance level similar to that of well managed conventional farms.
Environmentally and ecologically sound production in line with public opinion and expectation is seen as an essential feature of organic agriculture. Because intensification of conventional agricultural production processes has led to environmental burdens (e.g. eutrophication and pollution of soil and water resources) a similar trend in organic farming, which might weaken its environmental performance, is being debated and needs to be assessed.
Farm nutrient budgets have become a central tool for assessing and reducing the environmental impact of intensive farming and serve as indicators of sustainable land managementReference van Beek, Brouwer and Oenema3–Reference Halberg, Verschuur and Goodlass6. Nutrient budgets of 30 organic farms calculated by researchers in different regions in Germany more than 10–15 years ago indicated balances for N, P and K often close to zero or even negativeReference Haas, der Landwirtschaftskammern and Düngung7.
In this paper, the nutrient budgets at farm-gate level are analyzed for 26 organic dairy farms in two different regions in Germany to assess the environmental impact of intensified feeding through the purchase of higher amounts of feed. Nutrient budgets of these farms are part of a research project in which several indicators covering milk yield and productivity, feed components and rations, economic performance and farmers’ opinions were investigatedReference Haas and Deittert8,Reference Haas, Deittert and Köpke9.
Materials and Methods
Regional characteristics
The 26 dairy farms in this study converted to organic agriculture between 1981 and 2000 and are located in two different German states (Bundeslaender). In North Rhine Westphalia (NRW), close to the Dutch border in northwest Germany, seven farms are located in the more or less flat lowland [10–70 m above sea level (a.s.l.)] and five farms in the hilly regions in the southern part of the state (180–370 m a.s.l.), where the proportion of permanent grassland is high. Mean precipitation at these 12 farms is 837 l m−2 [range (R): 600–1100 l m−2] and annual mean temperature is 8.3°C (R: 7.5–9.4°C). In the state of Baden-Wuerttemberg in southwest Germany, 14 farms in the subalpine, sometimes hilly region (550–850 m a.s.l.), called Allgaeu, were analyzed. The annual mean temperature is 7.2°C (R: 6.1–8.0°C) and mean precipitation 1029 l m−2 (R: 800–1600 l m−2), which favors the intensive use of permanent grassland.
Selection of farms
The farms were selected following suggestions made by the regional organic dairy advisers. The advisers recommended well managed (to exclude low productivity due to low management skills) full-time dairy farms, which were in close contact with the extension service and possessed a good database and accounting system. These farms were considered to have a long-term farming perspective and to represent typical examples of full-time organic dairy farming.
Farm survey and interviews
Between autumn 2002 and spring 2003, interviews took place on the farms after checking the single-farm analyses of the extension service and the farm and dairy cow records, accounts and tax sheets. The questionnaire covered all basic agricultural production data on farm structure and main dairy and forage production processes on a long-term basis. Farmers were interviewed during an intensive farm visit of about 2–3 h. Data were evaluated and cross checked, and the farmer and his extension agent were contacted if necessary.
Farm characteristics
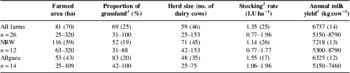
On the farms in NRW, the dairy breed black and white Holstein Friesian dominates (64%) followed by the red and white Holstein Friesian (27%). In the Allgaeu region, Brown Swiss (54%), black and white Holstein Friesian (28%) and Simmental (11%) are the main breeds. In both regions, the cubicle housing system is predominant. Therefore, the amount of straw needed for bedding is low; however, pure-grassland farms and farms that do not cultivate cereals still need to purchase additional straw. NRW farms show a higher milk yield and are bigger in terms of area and herd size, while the share of grassland and livestock density is lower (Table 1).
Characteristics of analyzed dairy farms [mean, coefficient of variation (%) in parentheses, range underneath].

1 Almost all of it permanent grassland.
2 LU, livestock unit (each 500 kg live weight) including replacement stock.
3 Standardized fat and protein corrected milk (FPCM) with 4.0% fat and 3.4% protein which is very close to average.
Modeling of forage yield and feeding pattern
The exact forage yield and share of legumes were normally not known by the farmer. Assumptions had to be made based on intensive cross checking of the feeding ration related to performance and possible maximum intake balanced with the possible supply (yield multiplied by area per crop) according to site conditions (for details see Haas et al.Reference Haas, Deittert and Köpke9). In addition, assessments by extension agents and cooperating scientists and data derived from previous on-farm investigations on some of these farms were considered.
Forage and feed production
Permanent grassland was cut for indoor green feeding, ensiling, hay or grass drying for pellets, or grazed up to five times a year [mean gross yield 8.8 t dry matter (DM) ha−1]. Grass/red clover (mean gross yield 10.8 t DM ha−1) and cereals (mean yield 3.6 t DM ha−1) were cultivated on most of the farms. Grain cereals (wheat, oat, rye, triticale, barley, spelt) were produced for feeding and sometimes also sold as cash crops for human consumption. Pulses for feeding (faba beans, peas) cropped on some farms yielded about 3.2 t DM ha−1. Potatoes were only grown in NRW (mean yield 20 t fresh matter ha−1). Maize for silage (mean gross yield 12 t DM ha−1) was grown on eight farms in NRW and four farms in the Allgaeu region. In general, the purpose of cereal and potato production varied according to the market quality, which determined whether the produce was used for feeding or sold. Depending on whether pre-crop effects of legumes and a sufficient amount of slurry or manure led to an adequate nitrogen supply ensuring a good baking quality, the produced cereals were sometimes sold to mills and bakeries while at the same time lower-quality cereals for feeding were purchased from other organic farms.
Milk yield and feeding
To calculate the proportion of milk from the different types of feed on an energy basis [MJ net energy for lactation (NEL)], the feeding for maintenance was allocated to all feed types being fed (Haas et al.Reference Haas, Deittert and Köpke9). The mean total milk yield (Table 1) was derived from roughage (74%, R: 48–89%), concentrates and dried grass pellets (23%, R: 9–48%), and succulent feeds (3%, R: 0–9%), which were predominantly commercial processing by-products (e.g. brewery grain and fruit residues). Nine of the Allgaeu farms were not allowed to feed any silage, because they delivered their milk to a dairy where the typical hard cheese of the region was produced. These farms instead fed hay and often grass pellets in winter.
Per cow and year, 0.94 t DM of concentrates (cereals, pulses, oilseed cakes) were fed (R: 0–2.72 t DM), which was 135 g kg−1 milk (R: 0–378 g kg−1). On average, about 67% of the sum of concentrates and processing by-products was purchased. There was a relationship between the amount of purchased feed and the milk performance (r=0.53, P=0.057). From concentrates and succulent feed, 1471 kg milk cow−1 yr−1 (R: 50–3724 kg) were produced. The area-related productivity was almost 7000 kg milk ha−1. For feed production, 0.96 ha per cow was needed, of which 0.85 ha was farm land for home-grown feed. The equivalent area for the production of the purchased feed was 0.11 ha (excluding commercial processing by-products).
Nutrient budgets
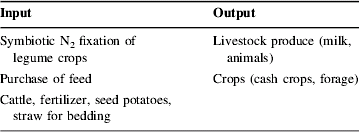
The nutrient balances for nitrogen (N), phosphorus (P) and potassium (K) at farm-gate level were compiled by considering the perennial average. Results are expressed for a single farm as one unit on an annual basis. Budgets were set up by calculating all essential inputs and outputs (Table 2).
Schema of extended (including N2 fixation) farm-gate nutrient budget.
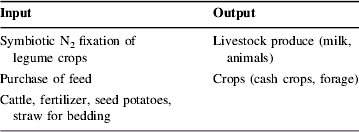
The amount of N fixed by the forage legume crops was assessed by the gross yield of the crops and, if grown in mixtures, the share of legumes. The proportion of DM yield for grass/red clover and white clover in permanent grassland was uniformly assumed to be 75 and 15%, respectively.
Based on investigations by Boller and NoesbergerReference Boller and Noesberger10, extended and updated by Boller et al.Reference Boller, Luescher and Zanetti11 and WeissbachReference Weissbach12, 30 kg N t−1 DM of clover yield was assumed in calculations to assess the symbiotic N2-fixation input rate. Based on investigations by HaasReference Haas13, a uniform 75 kg N ha−1 was assumed to be symbiotically fixed by mixtures of hairy vetch with winter rye or of crimson clover and Italian ryegrass. For pulses, an assumption based on field trials by KöpkeReference Köpke14,Reference Köpke15 was used, which considers the amount of fixed N to be similar to the grain-N yield. Though these calculations are based on several assumptions, this is a widely used method for calculating the amount of N fixed by legume cropping in Germany at the farm-gate level.
The nutrient inputs via purchased feed and straw and the nutrient outputs via sold milk, bull calves, heifers, cull cows, cash crops and feed (very rare) were calculated by the mass of each product multiplied by the nutrient content derived from regional organic on-farm research and extension-service databases (mainly for forage) and from national statistics16. Data for the amount of purchased feed and straw and the number of purchased or sold cattle were taken from the bookkeeping records. Apart from stock bulls every second or third year, no other livestock was bought. Only three of the 26 farms do not raise their own breeding cattle, rather they cooperate closely with another organic farm. In these cases, calves were considered as output and the replacement heifers were imported again before calving.
Seed for cereals, pulse and forage crops were generally negligible, because they usually sum up to less than 1 kg nutrient ha−1 of the total farm area, whereas seed potatoes were calculated based on 0.6 t DM ha−1. No relevant P- or K-containing mineral feed was bought, just pure salt licks. Except for one farm that purchased K-fertilizer, no other farm used mineral fertilizer.
Atmospheric-N deposition, nitrate leaching and denitrification were not calculated. Also accumulation and depletion of nutrients in the soil were not calculated by assuming dynamic equilibrium, but should be considered by interpreting single-farm balances. The main output ‘sold milk’ was calculated according to the monthly official milk-yield-performance control data less the amount of milk the calves needed for a minimum period of 3 months as stipulated by the organic agriculture regulations.
Results and Discussion
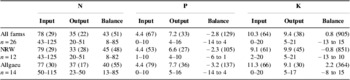
For all farms the farm-gate balance for N, P and K is 43, −2.8 and 0.8 kg ha−1, respectively (Table 3). Though in both regions, some differences in structure and performance exist, the quantities of imported and exported nutrients as well as the balances are similar. In the Allgaeu region, the range for P is wider. Assuming so-called unavoidable volatile ammonia losses during manure and slurry storage and spreading of about 30 kg N LU−1,16 the resulting average N surplus related to 1.35 LU ha−1 on average (Table 1) is very low. Mean P and K balances are close to zero, as reported in other investigationsReference Haas, der Landwirtschaftskammern and Düngung7,Reference Bengtsson17–Reference Steinshamn, Thuen, Azzaroli, Tutein, Ekerholt and Yri21, indicating that there is likely to be little adverse environmental impairment (e.g. eutrophication).
Annual area related farm-gate nutrient budget (kg ha−1 farmed area) [rounded mean, coefficient of variation (%) in parentheses, range underneath].

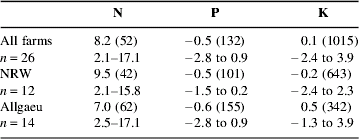
The calculated product-related N balance of 8.2 g kg−1 milk (Table 4) is low compared to dairy farms in northern Germany (ScheringerReference Scheringer22, p. 28: organic and conventional, 16 and 24 g kg−1 milk, respectively) and in Denmark (Dalgaard et al.Reference Dalgaard, Halberg and Kristensen4: organic and conventional, 22 and 29 g kg−1 milk, respectively). The variations of the K balances are extremely high and those for the N balances comparably low.
Annual product-related balance of farm-gate nutrient budget (g kg−1 milk) [mean, coefficient of variation (%) in parentheses, range underneath].
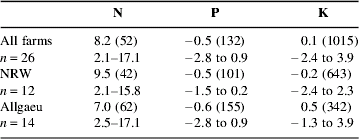
Nutrient use efficiency for all farms on average calculated as the proportion of input to output is area-related high for N (45%), P (164%) and K (91%). ScheringerReference Scheringer22 (p. 28) calculated lower N-efficiency rates of 27 and 25% for organic and conventional dairy farms, respectively. van der Werff et al.Reference van der Werff, Baars and Oomen23 report a higher N efficiency of 31% for organic compared to 12% for conventional dairy farms in The Netherlands, as do Halberg et al.Reference Halberg, Steen and Sillebak24 for Danish dairy farms (25% organic, 16% conventional).
N-flow components
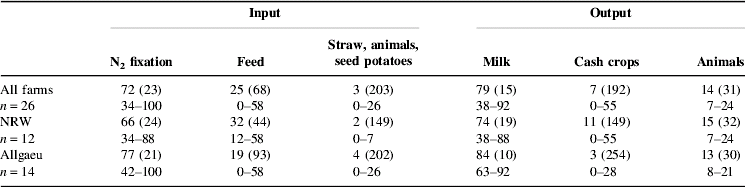
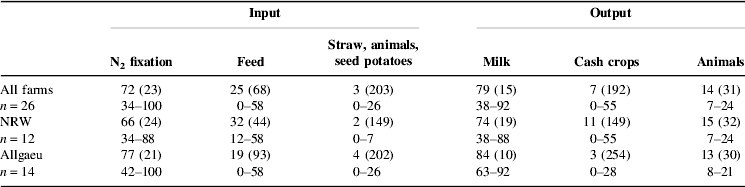
As expected, a high proportion (72%) of the N input is caused by symbiotic N2 fixation of the legumes (Table 5). The average N input via purchased feed of all farms is considerably lower (25%), but can reach 58% in both regions. In the Allgaeu region, the share of legumes of the total input is higher than for the farms in NRW, while feed-N input is lower. The quantities of purchased feed on the Allgaeu farms are lower, as is the milk yield per cow (Table 1), whereas grassland yields are higher. In general, the nutrient input via purchased straw and livestock is very small particularly for N and P. Nitrogen output is dominated by the milk sold to the dairy (Table 5), but this component can be down to 38% if higher quantities of cash crops are sold. However, on average, cash crops account for only 11% in NRW and 3% in the Allgaeu region. Compared to cash crops, the mean N output via sold animals is higher (mainly bull calves and cull cows).
Nitrogen farm-gate budget: share (%) of input and output components [rounded mean, coefficient of variation (%) in parentheses, range underneath].
P-flow components
Average P balances are slightly negative (Table 3), whereas in conventional farming very much higher surpluses are reported (up to 32 kg P ha−1), which are still slightly positive even if optimized in experiments to the highest extent possibleReference Aarts, Habekotté and van Keulen25,Reference Withers, Peel, Mansbridge, Chalmers and Lane26.
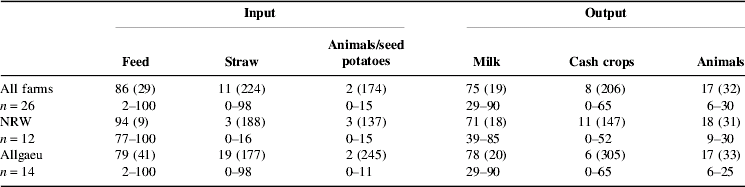
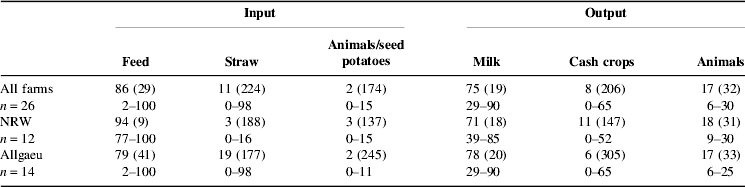
The P balances are determined by feed input and milk output (Table 6). The main P input is based on purchased feed reaching 100% of total P input in both regions. The main feed P input is lower in the Allgaeu region, because a high share of grassland often increases the need for straw, the share of which can be high, but the quantity low. P output beside milk is also through cash crops and sold animals. On some farms in both regions, the sale of cash crops and animals sums up to an output share of about 60–70%.
Phosphorus farm-gate budget: share (%) of input and output components [rounded mean, coefficient of variation (%) in parentheses, range underneath].
The highest P balance of 4 kg ha−1 (Table 3) was found for a farm that purchases roughage (hay and pellets), but does not grow cash crops. A pure permanent grassland farm in the Allgaeu region showed the lowest balance of −14 kg P ha−1, because roughage is sold and almost no feed purchased. Soluble P content in the soil of that farm is very low, requiring mineral-P fertilization. Low soluble P- and K-soil content are often detected on farms with long-term organic management historyReference Gosling and Shepherd27–Reference Nolte and Werner29. After converting to organic agriculture, no fertilization is needed for many years if previous conventional farming caused nutrient-rich soils, which is still often the case in many European countriesReference Tunney, Csatho and Ehlert30. Additionally, the soil nutrient classification levels on which extension recommendations for fertilization are based, were lowered at least twice in the 1990s, and there are still uncertainties related to analyzing methods and interpretation schemes across EuropeReference Neyroud and Lischer31. For this reason and because of a general abandonment of the use of processed fertilizers, organic farmers feel sometimes too comfortable with a no-fertilization management and do not realize that for some sites and soil substrates there is an increasing need for P and K.
K-flow components
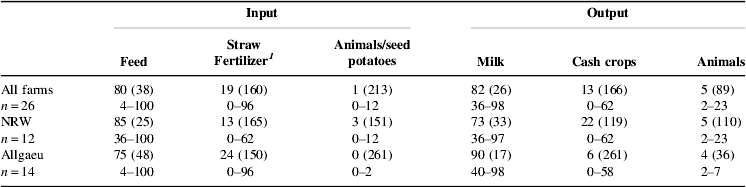
Over all farms, the K balances are close to zero (Table 3). A deficit of 13 kg K ha−1 was found at one farm in NRW, which sells potatoes and sugar beet. The highest surplus of 15 kg K ha−1 at a pure permanent grassland farm in the Allgaeu region was due to the purchase of higher quantities of straw. Purchasing straw can contribute up to 96% of the K input (Table 7). However, on average, purchased feed generates 80% of the K input. Similar to P, most K is sold via milk, though cash crops can account for up to 62%.
Potassium farm-gate budget: share (%) of input and output components [rounded mean, coefficient of variation (%) in parentheses, range underneath].
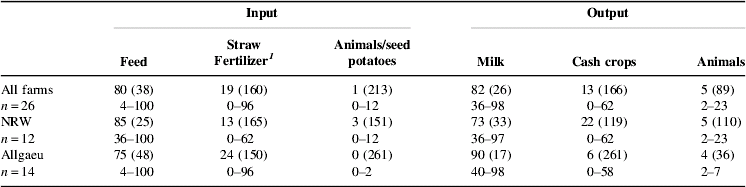
1 Only one farm (in NRW) is using 11.7 kg ha−1 mineral K fertilizer, which is 62% of its total K input.
Correlations
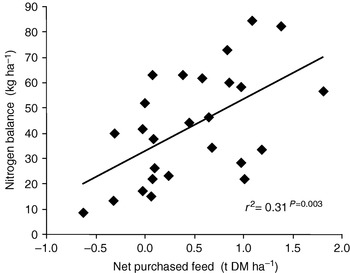
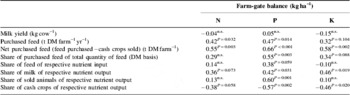
There is a close relationship between the amount of feed purchased and milk yield (r=0.53, P=0.0057) (see Haas et al.Reference Haas, Deittert and Köpke9), but no correlations between the farm-gate balances and milk yield or livestock density. However, farm-gate balances are positively related to the parameter ‘purchased feed’, in particular to the net quantity of purchased feed (Table 8), which is illustrated for N in Figure 1.
Relationship between net purchased feed and farm-gate nitrogen balance (n=26 farms).

Coefficient of correlation (r) (Pearson) between farm-gate balances and milk performance, parameters of purchased feed and output of milk and cash crops per year (n=26 farms; n.s., not significant=P>0.11).

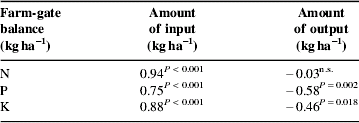
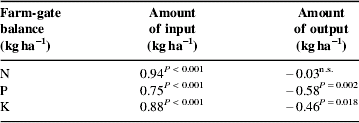
Table 9 shows that P and K balances are negatively correlated with output only. They are positive with input.
Coefficient of correlation (Pearson) between farm-gate balance and the amount of input and output for the respective nutrient (n=26 farms; n.s., not significant=P>0.11).
There are several reasons for the different N surpluses on the different farms: for example, the farms with the highest N surplus of 85, 82 and 73 kg N ha−1 beside N inputs of 115, 125 and 110 kg N ha−1 are characterized by livestock densities of 1.06, 1.3 and 1.35 LU ha−1, large amounts of symbiotic N2 fixation through a high proportion of grassland and legumes of 64–70% of the farm area and annual milk yields of 7206, 6696 and 7916 kg cow−1. Feeding strategy on these farms comprises 2.7, 0.7 and 1.0 t of concentrates per cow and year of which 46, 99 and 28%, respectively, are purchased. As hardly any cash crops are grown on these farms, the resulting sum of net purchased feed is 1.08, 1.38 and 0.83 t DM ha−1, respectively.
In contrast, the two farms with the highest annual milk yields of 8788 and 8536 kg milk cow−1 show N surpluses of only 38 and 46 kg N ha−1, respectively, which is close to the average of all farms. An intensive feeding strategy on these farms of annually 1.56 and 2.37 t DM concentrates and 0.56 and 0.43 t DM succulent feed (brewery grain, fruit residues) per cow with a considerable import of nutrients through purchased feed is complemented by cash crops, resulting in net amounts of purchased feed of 0.09 and 0.65 t DM ha−1, respectively. In addition to the fact that livestock density is lower than on the three aforementioned farms (0.78 and 0.97 LU ha−1), as is the N-import through legumes, the share of permanent grassland and red clover is only 47 and 53% of the farm area, respectively.
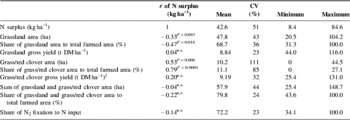
These examples illustrate the impact livestock density (over all farms r=0.10n.s.) and the share of grassland and legumes of the farm area might have on a specific farm-gate N balance. However, these and all other parameters over all farms, except the net amount of purchased feed, are not correlated to the N surplus (Table 10,Fig. 1). There is a close positive relationship between the N surplus and the area of grass/red clover and between N surplus and proportion of grass/red clover (Table 10). However, because the share of grassland, which is much higher compared to that of grass/red clover, is negatively correlated and highly variable, the sum of grassland and grass/red clover and its share of the total farmed area are not correlated to the N surplus (Table 10).
Coefficient of correlation (r) (Pearson) between N balance and parameters of legume cropping, mean, coefficient of variation (CV), minimum and maximum values (n=26 farms; n.s., not significant=P>0.11).

1 Because five farms did not grow grass/red clover, n=21 farms.
Of the presented proportions of input components (Tables 5–7), only P via purchased feed (Table 8) and K via purchased animals and seed potatoes (r=−0.41, P=0.039) are significantly related to the farm-gate balance of the respective nutrient. The proportions of output via sold milk and cash crops of the total output are more closely related to the nutrient balances (Table 8). An increasing share of cash crops of the nutrient output causes declining farm-gate balances, which can be explained by a comparable higher P content of cereals and higher K content of root crops, whereas an increasing proportion of milk to nutrient output relates to increasing nutrient balances. The impact of sold animals (comparable higher P content) on farm-gate balances is only significant and close for P (Table 8).
Comparison of systems
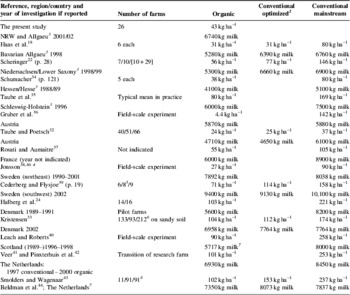
Nitrogen balances assessed by other researchers comparing organic and conventional dairy farms in Europe clearly result in low farm-gate surpluses on organic farms in Germany and Austria (Table 11). In countries with higher production intensities like Denmark, Sweden and The Netherlands, the surplus of organic dairy farms reaches 100 kg N ha−1. However, according to the values in Table 11, the organic surplus is often half or a third of the surplus of conventional farms.
Reported area-related farm-gate nitrogen balances of organic and conventional dairy farms in different parts of Germany and Europe (mean surplusFootnote 1, underneath mean annual performance per cow—which is not reported in some papers but has been added by personal email communication).

1 Method of farm-gate budget might vary, in particular because sometimes atmospheric N deposition is considered. Balances are corrected by excluding atmospheric N deposition if the values are listed.
2 ‘Optimized’ conventional farms do not use mineral N fertilizers or are best performing or optimized in terms of N balance, or see table footnotes 5, 6 and 7 below.
3 State or region of Germany.
4 Data submitted via email dated 13 April 2005 by S. Jonsson, based on the report written in Swedish, project described by BengtssonReference Bengtsson17.
5 Differentiation between conventional systems only by milk yield per ha, which is less than 7500 kg ha−1 for the farms ‘conventional medium’ and more than 7500 kg ha−1 for ‘conventional high’ listed here as ‘optimized’ and ‘mainstream’, respectively.
6 Differentiation by system and mean lifestock density: organic 1.2 LU ha−1, ‘conventional optimized’ 1.0 LU ha−1 and ‘conventional mainstream’ 1.7 LU ha−1, which cover 8, 17 and 47% of the Danish milk production, respectively. Definition of livestock unit (LU) based on N excretion, e.g. 1 dairy cow of 8500 kg milk annually is 0.85 LU.
7 It was not a truly organic system, but it was a grass–white clover-based system with minimized purchased concentrates, home-grown feed and no use of mineral N fertilizer.
8 Data for the 11 organic farms by Smolders and WagenaarReference Smolders and Wagenaar43 for the period 1998–2000. Data for the 91 conventional mainstream farms in year 1997; farms were continuously optimized predominantly by lowering the amount of mineral N fertilizer; in 2002, N surplus of these farms are reported as optimized by Beldman et al.Reference Beldman, Doornewaard, Tomson and Daatselaar44.
Thus, organic dairy farms can be considered as generally more environmentally sound regarding nutrient surplus and are more efficient in terms of nutrient surplus related to milk yield. The main reason for the difference between the systems is the use of mineral N fertilizers in conventional farming and, to a lower extent, the amount of purchased feed. If conventional farming is optimized by reducing use of mineral N fertilizers, as analyzed by Haas et al.Reference Haas, Wetterich and Köpke18 and Taube and PoetschReference Taube, Poetsch, Isselstein and Spatz32, or having similar stocking densities as shown by KristensenReference Kristensen33, a N surplus close to that of organic farms can be obtained (Table 11).
These results match well with an organic dairy experiment by Weller and BowlingReference Weller and Bowling45, which demonstrated that a self-sufficient system based solely on home-grown concentrates compared with a system based on purchased concentrates showed a superior environmental performance, as indicated, among other parameters, by lower nutrient surpluses. However, higher milk yields and the flexibility to overcome any imbalances and deficiencies (e.g. feed and feed quality) by purchasing feed were more attractive for the farmers, because an almost self-sufficient system demands higher management skills. Similar relationships and management demands are reported by Leach and RobertsReference Leach and Roberts40 comparing clover- and fertilizer-based dairy systems.
Conclusions
Though different production structures and performance levels in organic dairy farming were investigated, the differences in nutrient balances were smaller than expected. Average farm-gate nutrient budgets for P and K are more or less balanced, but single farms show higher deficits or surpluses, which need to be evaluated in single-farm weak-point analyses. Farm-gate surpluses for P and K do not indicate an environmental burden. Higher deficits for P and K can, however, be important, particularly for farms with a higher proportion of nutrient output via cash crops, in view of productivity and crop quality.
Nitrogen surplus averages only 43 kg ha−1 and does not indicate a substantial environmental impact. However, surpluses on single farms reach 85 kg ha−1. A clear relationship exists between the amount of feed purchased and the investigated farm-gate balances. Substantial purchases of concentrates can lead to higher N surpluses, but these are, in some cases, compensated by cash crops. On the other hand, higher N surpluses can also occur on farms with only moderate amounts of purchased feed, if livestock density and/or symbiotic N2 fixation due to a high proportion of legume-based forage area are high; however, over all farms no correlation is detected between these parameters and N surpluses.
Although a general marked difference in farm gate N-surplus between organic and conventional dairy farming exists, there might only be a small difference between optimized conventional and intensified organic systems. Intensification in organic dairy farming must be assessed and considered carefully to further determine its environmental performance and profile.
Acknowledgments
Financial support by the Federal Ministry of Consumer Protection, Food and Agriculture is gratefully acknowledged. The authors express their sincere appreciation for the excellent cooperation of the organic dairy extension agents Christoph Drerup, Christian Wucherpfennig, Edmund Leisen, Jürgen Schlüter and Matthias Becker and the 26 farmers involved.