


1. Introduction
Slug flow is a regime observed in gas–liquid flows in pipes, which is of central importance to steam production in geothermal power plants, emergency cooling of nuclear reactors (Mao & Dukler Reference Mao and Dukler1990; Fabre & Liné Reference Fabre and Liné1992; Taha & Cui Reference Taha and Cui2006; Capponi, James & Lane Reference Capponi, James and Lane2016) and also features in geological systems such as volcanic eruptions (Pering & McGonigle Reference Pering and McGonigle2018). In vertical pipes, slug flow exhibits a pseudoperiodic rise of large bullet-shaped Taylor bubbles separated by liquid slugs. The starting point for understanding slug flow in vertical pipes is elucidating the behaviour of a single Taylor bubble rising through a liquid, which is governed by the interaction of gravitational, interfacial, viscous and inertial forces parameterised by a number of dimensionless groups; these include the inverse viscosity ( $N_f$), Eötvös (
 $Eo$) and Froude (
 $Fr$) numbers, defined as
 \begin{equation} N_f = \frac{\rho (g D^3)^{{1}/{2}}}{\mu},\quad Eo = \frac{\rho g D^2}{\gamma},\quad Fr = \frac{u}{\sqrt{g D}}, \end{equation}
where  $\rho$,
 $\mu$,
 $\gamma$ and
 $u$ denote the density, dynamic viscosity, surface tension and a characteristic liquid speed, respectively;
 $D$ is the pipe diameter while
 $g$ is the acceleration due to gravity. The Froude number may be based either on the bubble rise speed, the mean speed or the pipe centreline velocity of the flowing liquid, which are represented by
 $U_b$,
 $\bar {U}_L$ and
 $U_m$, respectively. Other dimensionless groups used commonly to characterise Taylor bubble behaviour are the Reynolds number,
 $Re= Fr N_f$, Morton number,
 $Mo = {Eo^3}{N_f^{-4}}$, and Archimedes number,
 $Ar = {N_f^2}$. We can also distinguish the Reynolds numbers that are based on the average liquid speed,
 $Re_L= \bar {U}_L N_f$, and the bubble rise speed,
 $Re_b= U_b N_f$.
A Taylor bubble generally exhibits topological symmetry and its shape can be sectioned into three distinct regions corresponding to the bubble ‘nose’, ‘body’ and ‘bottom’, with each region having specific features used for its characterisation. The nose region is nearly hemispherical and is characterised by its frontal radius of curvature, the magnitude of the axial component of velocity at its tip, which is the bubble rise speed, and the maximum distance ahead of the bubble nose beyond which the bubble impact is no longer felt. The body region is nearly tubular and surrounded by a thin liquid film that can be divided into developing and fully developed parts. Features such as the length of the developing region, the film thickness, the velocity profile of the fully developed film and the wall shear stress in the film, are all used to characterise the body region. Lastly, in the bottom region, the characterising features are the shape, which could be concave or convex, the radius of curvature, the maximum distance beyond which the impact of the bubble is no longer felt, and the length, volume and the nature of the flow pattern in the wake region (if present).
Because of the numerous applications of slug flow, extensive experimental (Griffith & Wallis Reference Griffith and Wallis1961; Moissis & Griffith Reference Moissis and Griffith1962; Nicklin, Wilkes & Davidson Reference Nicklin, Wilkes and Davidson1962; White & Beardmore Reference White and Beardmore1962; Campos & Guedes de Carvalho Reference Campos and Guedes de Carvalho1988; Bugg & Saad Reference Bugg and Saad2002; Nogueira et al. Reference Nogueira, Riethmuller, Campos and Pinto2006b; Llewellin et al. Reference Llewellin, Del Bello, Taddeucci, Scarlato and Lane2012; Pringle et al. Reference Pringle, Ambrose, Azzopardi and Rust2015; Rana, Das & Das Reference Rana, Das and Das2015; Fershtman et al. Reference Fershtman, Babin, Barnea and Shemer2017), theoretical (Dumitrescu Reference Dumitrescu1943; Brown Reference Brown1965; Collins et al. Reference Collins, De Moraes, Davidson and Harrison1978; Funada et al. Reference Funada, Joseph, Maehara and Yamashita2005; Fabre Reference Fabre2016) and numerical (Mao & Dukler Reference Mao and Dukler1990, Reference Mao and Dukler1991; Bugg & Saad Reference Bugg and Saad2002; Taha & Cui Reference Taha and Cui2002, Reference Taha and Cui2006; Lu & Prosperetti Reference Lu and Prosperetti2009; Kang, Quan & Lou Reference Kang, Quan and Lou2010; Anjos et al. Reference Anjos, Mangiavacchi, Borhani and Thome2014; Lizarraga-Garcia et al. Reference Lizarraga-Garcia, Buongiorno, Al-Safran and Lakehal2017) studies have been carried out to determine some of the features highlighted for all the aforementioned topological regions. The rise speed is the most investigated and significant feature in Taylor bubble dynamics. For sufficiently long bubbles, typically several pipe diameters in length, the bubble rise speed is independent of the bubble length (Griffith & Wallis Reference Griffith and Wallis1961; Nicklin et al. Reference Nicklin, Wilkes and Davidson1962; Mao & Dukler Reference Mao and Dukler1989; Polonsky, Shemer & Barnea Reference Polonsky, Shemer and Barnea1999). Neglecting the effect of surface tension and assuming an inviscid flow around the bubble nose, Dumitrescu (Reference Dumitrescu1943) and Davies & Taylor (Reference Davies and Taylor1950) have shown independently that the rise speed in a stagnant liquid is given by
 \begin{equation} u_b = C_0\sqrt{g D}, \end{equation}
where  $u_b$ denotes the dimensional bubble rise speed and
 $C_0$ is a dimensionless proportionality constant. From (1.2), the Froude number based on the bubble rise speed is a constant and equals
 $C_0\approx 0.351$ (Dumitrescu Reference Dumitrescu1943).
White & Beardmore (Reference White and Beardmore1962) generated a flow map depicting regimes where the effects of surface tension, inertia, viscous or a combination of these forces on a bubble rising in a stagnant liquid can be neglected. It was established that beyond  $Eo > 70$ and
 $Mo > 3 \times 10^5$, in an ‘inertia regime’, surface tension and viscosity have no significant influence on the bubble rise speed, and the assumptions underlying the analytical solutions of Dumitrescu (Reference Dumitrescu1943) and Davies & Taylor (Reference Davies and Taylor1950) are valid. Later experimental, theoretical and numerical studies (Goldsmith & Mason Reference Goldsmith and Mason1962; Brown Reference Brown1965; Zukoski Reference Zukoski1966; Nickens & Yannitel Reference Nickens and Yannitel1987; Lu & Prosperetti Reference Lu and Prosperetti2009; Kang et al. Reference Kang, Quan and Lou2010) have provided further insights into the role of surface tension and viscosity on the rise speed in both inertia and non-inertia regimes through their influence on the radius of curvature of the bubble nose. Using a large pool of experimental data for
 $U_b$ in stagnant liquids, Viana et al. (Reference Viana, Pardo, Yánez, Trallero and Joseph2003) developed a correlation, recently modified by Lizarraga-Garcia et al. (Reference Lizarraga-Garcia, Buongiorno, Al-Safran and Lakehal2017), for the effect of
 $Eo$ and
 $N_f$ on the rise speed taking into account pipe inclination.
For a Taylor bubble rising in a flowing liquid, Nicklin et al. (Reference Nicklin, Wilkes and Davidson1962) proposed a correlation, corroborated by theoretical investigations (Collins et al. Reference Collins, De Moraes, Davidson and Harrison1978; Bendiksen Reference Bendiksen1985), for upward flowing liquid, which relates  $U_b$ to
 $\bar {U}_L$ as follows:
 \begin{equation} U_b = C_1 \bar{U}_L + C_0, \end{equation}
with  $C_0$ and
 $\bar {U}_L$ retaining their earlier definitions and
 $C_1$ represents a dimensionless constant whose value depends on the velocity profile of the flowing liquid and is equal to the ratio of the maximum to mean liquid velocity (Nicklin et al. Reference Nicklin, Wilkes and Davidson1962; Clift, Grace & Weber Reference Clift, Grace and Weber1978; Collins et al. Reference Collins, De Moraes, Davidson and Harrison1978; Bendiksen Reference Bendiksen1985). For turbulent flow,
 $C_1 \approx 1.2$ increasing with decreasing
 $Re_L$ approaching
 $C_1 \approx 1.9$ at
 $Re_L = 100$ (Nicklin et al. Reference Nicklin, Wilkes and Davidson1962). Other important features that have been studied experimentally, theoretically and numerically are the film thickness and length of developing film (Goldsmith & Mason Reference Goldsmith and Mason1962; Brown Reference Brown1965; Batchelor Reference Batchelor1967; Nogueira et al. Reference Nogueira, Riethmuller, Campos and Pinto2006a; Kang et al. Reference Kang, Quan and Lou2010; Araújo et al. Reference Araújo, Miranda, Pinto and Campos2012; Llewellin et al. Reference Llewellin, Del Bello, Taddeucci, Scarlato and Lane2012), and wake (Moissis & Griffith Reference Moissis and Griffith1962; Maxworthy Reference Maxworthy1967; Campos & Guedes de Carvalho Reference Campos and Guedes de Carvalho1988; Pinto, Coelho Pinheiro & Campos Reference Pinto, Coelho Pinheiro and Campos1998; Nogueira et al. Reference Nogueira, Riethmuller, Campos and Pinto2006b; Araújo et al. Reference Araújo, Miranda, Pinto and Campos2012) and wall stress features (Nogueira et al. Reference Nogueira, Riethmuller, Campos and Pinto2006a; Feng Reference Feng2008; Araújo et al. Reference Araújo, Miranda, Pinto and Campos2012).
Despite the volume of previous research, there is still a need for a systematic study of the influence of the fluid properties and flow conditions on the bubble behaviour. This is motivated by the experimental evidence for Taylor bubble feature transitions, such as a change in the flow pattern in the wake region and bubble shape from symmetric to asymmetric in downward liquid flow. The critical conditions at which this transition occurs, and its underlying mechanisms, can be understood by examining the stability of the axisymmetric steady states for the corresponding parameter values.
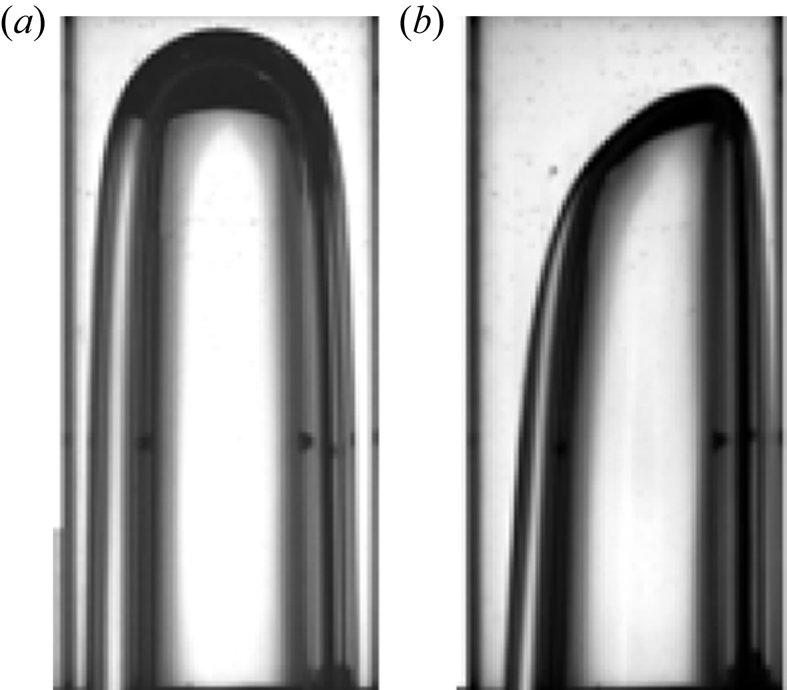
Experiments have indeed confirmed the existence of a critical liquid velocity beyond which the bubble shape loses axisymmetry (Griffith & Wallis Reference Griffith and Wallis1961; Nicklin et al. Reference Nicklin, Wilkes and Davidson1962; Martin Reference Martin1976; Polonsky et al. Reference Polonsky, Shemer and Barnea1999; Fabre & Figueroa-Espinoza Reference Fabre and Figueroa-Espinoza2014; Fershtman et al. Reference Fershtman, Babin, Barnea and Shemer2017). An example of asymmetric bubble shapes in downward flowing liquids is shown in figure 1 in which it is seen that the bubble nose becomes distorted, and in an attempt to avoid the fast-moving fluid at the centre of the tube, the bubble moves closer to the tube wall (Nicklin et al. Reference Nicklin, Wilkes and Davidson1962), rising faster than it would have done had it remained axisymmetric (Martin Reference Martin1976; Polonsky et al. Reference Polonsky, Shemer and Barnea1999). It was also noted by Martin (Reference Martin1976) that for a downward flowing liquid, a stable axisymmetric Taylor bubble can only be observed in tubes where surface tension effects are dominant, typical of small diameter tubes characterised by low  $Eo$; furthermore, the absolute value of the downward liquid velocity at which a bubble loses its axisymmetry decreases with increasing tube diameter.
Taylor bubble shapes in a stagnant (a) and downward flowing liquid (b), reproduced from Fabre & Figueroa-Espinoza (Reference Fabre and Figueroa-Espinoza2014).

Motivated by the aforementioned observations, Lu & Prosperetti (Reference Lu and Prosperetti2006) carried out a linear stability analysis of a Taylor bubble moving in a downward flowing liquid using potential flow theory and with negligible surface tension. They demonstrated that an axisymmetric Taylor bubble rising in a liquid with a laminar velocity profile subjected to irrotational perturbations becomes unstable beyond a critical negative liquid velocity. Following on from the theoretical investigation of Lu & Prosperetti (Reference Lu and Prosperetti2006) and the numerical simulation of Figueroa-Espinoza & Fabre (Reference Figueroa-Espinoza and Fabre2011) and Fabre & Figueroa-Espinoza (Reference Fabre and Figueroa-Espinoza2014), they performed experimental investigations in tubes of diameters 20, 40 and 80 mm, complemented by numerical simulations using the boundary element method of Ha Ngoc & Fabre (Reference Ha Ngoc and Fabre2006). They showed that the radius of curvature of the bubble nose plays a key role in the stability of the Taylor bubble and that the instability onset depends on  $Eo$.
In this paper, we examine the stability of an axisymmetric steadily moving Taylor bubble in stagnant and flowing liquids, with particular attention given to the transition of the bubble shape from symmetric to asymmetric. To the best of our knowledge, the study of Lu & Prosperetti (Reference Lu and Prosperetti2006) represents the first attempt in the literature to understand the mechanism governing this transition using linear theory. However, experimental studies (Fabre & Figueroa-Espinoza Reference Fabre and Figueroa-Espinoza2014) have shown that the instability onset depends on surface tension and, by neglecting it, Lu & Prosperetti (Reference Lu and Prosperetti2006) overestimate this onset. Moreover, existing studies of this transition have focused on the inertia-dominated regime, necessitating the need for investigating the parameter spaces where both viscous and surface tension effects are important. Thus, we carry out a linear stability analysis to understand how the forces acting on the bubble, characterised by  $N_f$,
 $Eo$ and
 $U_m$ affect the loss of bubble axisymmetry for conditions in which the bubble density,
 $\rho _b$, and viscosity,
 $\mu _b$, are negligible when compared with liquid density,
 $\rho$, and viscosity,
 $\mu$, (
 $\rho _b/\rho \ll 1$ and
 $\mu _b/\mu \ll 1$), respectively. We computed the steady-state solutions for an axisymmetric Taylor bubble rising steadily in stagnant and flowing liquids for different values of the aforementioned dimensionless parameters. These solutions serve as the base states for the linear stability analysis carried out herein. We also perform an energy budget analysis to determine the dominant, perturbation energy-producing terms that drive the instability.
The rest of this paper is organised as follows. In § 2, we provide details of the governing equations, and the numerical technique used to carry out the base state computations. In § 3, we detail the derivation of the generalised eigenvalue problem governing the normal mode evolution of perturbations, and the method utilised to solve the eigenvalue problem. A discussion of the base state results, and of the linear stability and energy budget analyses is presented in §§ 4–6, respectively. Finally, in § 7, concluding remarks are provided.
2. Axisymmetric base states
2.1. Governing equations
We consider the motion of an axisymmetric Taylor bubble of volume,  ${v_b}$, moving at a velocity of magnitude
 $u_b$ through an incompressible fluid of density
 $\rho$, viscosity
 $\mu$, and interfacial tension
 $\gamma$ in a vertically oriented, circular pipe of diameter
 $D$;
 $v_b$,
 $u_b$ and
 $\gamma$ are considered to be constants. In addition, we also assume that the density,
 $\rho _g$, and viscosity,
 $\mu _g$, of the gas bubble are very small as compared with those of the liquid, and that the pressure within the bubble,
 $p_b$, is also a constant; hence, the influence of the gas phase is restricted to the interface separating the liquid and gas phases (Bae & Kim Reference Bae and Kim2007; Feng Reference Feng2008; Tsamopoulos et al. Reference Tsamopoulos, Dimakopoulos, Chatzidai, Karapetsas and Pavlidis2008; Lu & Prosperetti Reference Lu and Prosperetti2009; Kang et al. Reference Kang, Quan and Lou2010; Fraggedakis et al. Reference Fraggedakis, Pavlidis, Dimakopoulos and Tsamopoulos2016; Zhou & Dusek Reference Zhou and Dusek2017). A cylindrical coordinate system,
 $(r,\theta,z )$, is adopted so that the coordinates along and perpendicular to the axis of symmetry are
 $z$ and
 $r$, respectively, with the interface located at
 $(r,z)=\varGamma _b^0$, and the
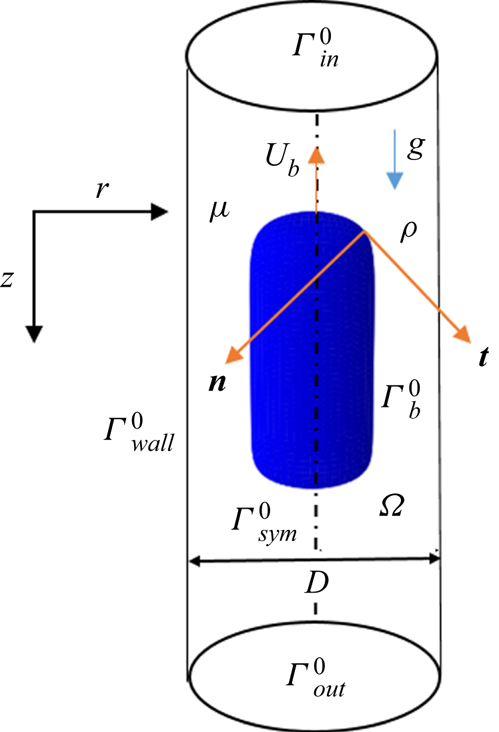
 $z$ origin chosen to coincide with the bubble nose, as shown in figure 2.
Three-dimensional axisymmetric Taylor bubble moving with a steady speed  $U_b$ through a liquid which is either stagnant or flowing (upwards or downwards) in a vertically aligned tube of diameter
 $D$.

The Navier–Stokes and continuity equations which govern the bubble motion are rendered dimensionless by scaling the length, velocity and pressure on  $D, \sqrt {gD}\ \mbox {and}\ \rho g D$, respectively. These equations, expressed in a frame of reference translating with the velocity
 $\boldsymbol {u}_b = - U_b \boldsymbol {i}_z$ of the bubble nose, where
 $U_b=u_b/\sqrt {gD}$, are written compactly in dimensionless forms as
 \begin{gather} \frac{\partial \boldsymbol{u}}{\partial t} + \left(\boldsymbol{u} \boldsymbol{\cdot}\boldsymbol{\nabla} \right)\boldsymbol{u} -\boldsymbol{\nabla}\boldsymbol{\cdot} \boldsymbol{T}= 0, \end{gather}
 \begin{gather}\boldsymbol{\nabla}\boldsymbol{\cdot} \boldsymbol{u} = 0, \end{gather}
where  $\boldsymbol {u}$ is the fluid velocity vector in the moving frame of reference,
 $t$ denotes time,
 $\boldsymbol {\nabla }$ is the gradient operator and
 ${\boldsymbol {T}}$ is the stress tensor,
 \begin{equation} \boldsymbol{T} ={-} {p} \boldsymbol{I} + {N_f}^{{-}1}(\boldsymbol{\nabla} \boldsymbol{u} + \boldsymbol{\nabla} \boldsymbol{u}^{\rm T}), \end{equation}
in which  $p$ represents the piezometric pressure,
 $\boldsymbol {I}$ unit tensor and
 $N_f$ is the viscosity parameter earlier defined in (1.1a–c). We note that gravity does not appear explicitly in (2.1) because the hydrostatic pressure has been absorbed into the piezometric pressure.
In order to impose boundary conditions on the solutions of (2.1)–(2.3), the boundary of the domain,  $\varGamma ^0$ is divided into
 $\varGamma ^0_{in},\ \varGamma ^0_{out}, \varGamma ^0_{wall}$,
 $\varGamma ^0_{sym}$ and
 $\varGamma ^0_b$, as shown in figure 2, which represent the domain inlet and outlet, the wall and the symmetry axis, respectively. At the wall, no-slip and no-penetration boundary conditions are imposed,
 \begin{equation} \boldsymbol{u} ={-}\boldsymbol{u}_b,\quad \mathrm{on}\ \varGamma^0_{wall}, \end{equation}
while at the inlet, prescribed values,  $\boldsymbol {u}_{in} = 0 \boldsymbol {i}_r + U_m ( 1 - 4 {r}^2 ) \boldsymbol {i}_z$, are specified for the velocity,
 \begin{equation} \boldsymbol{u} = \boldsymbol{u}_{in} - \boldsymbol{u}_b \quad \mathrm{on}\ \varGamma^0_{in}. \end{equation}
Along  $\varGamma ^0_{out}$, we impose an outlet condition:
 \begin{equation} \boldsymbol{n}\boldsymbol{\cdot}\boldsymbol{T} = 0. \end{equation}
Finally, at the interface, we impose the normal stress, tangential stress and kinematic boundary conditions, expressed, respectively, by
 \begin{gather} {\boldsymbol{n}\boldsymbol{\cdot}\boldsymbol{T}\boldsymbol{\cdot}{\boldsymbol{n}} + P_b- z -{Eo}^{{-}1}} \kappa = 0, \end{gather}
 \begin{gather}\boldsymbol{n}\boldsymbol{\cdot}\boldsymbol{T} \times \boldsymbol{n} = \boldsymbol{0}, \end{gather}
 \begin{gather}{\frac{{\rm d}\boldsymbol{r}_b}{{\rm d} t} \boldsymbol{\cdot} \boldsymbol{n} -\boldsymbol{u} \boldsymbol{\cdot} \boldsymbol{n} } =0, \end{gather}
where  $\kappa$ is the curvature of the interface,
 $P_b = p_b/\rho g D$ denotes the dimensionless bubble pressure,
 $\boldsymbol {r}_b(t)$ represents the position vector for the location of the interface
 $\varGamma ^0_b$,
 $Eo$ is the Eötvös number defined earlier in (1.1a–c) and
 $\boldsymbol {n}$ corresponds to the outward-pointing unit normal vector to the interface. The
 $z$ term in the normal stress condition, given by (2.7), corresponds to the hydrostatic pressure.
In order to determine the dimensionless bubble pressure,  $P_b$, a constraint of constant dimensionless bubble volume,
 $V_b=v_b/D^3$, is imposed,
 \begin{equation} V_b + \frac{1}{3} \oint_{\varGamma^0_b} \left[ \boldsymbol{r}_b\boldsymbol{\cdot}\boldsymbol{n} \right] {\rm d} \varGamma^0_b = 0. \end{equation}
In order to obtain a solution for the shape of the bubble of volume  $V_b$, speed
 $U_b$ and pressure
 $P_b$ associated with its steady motion through a liquid of dimensionless velocity
 $U_m$, for given
 $N_f$ and
 $Eo$, we implemented a technique based on the kinematic update of the interface shape with an implicit treatment of the curvature (Slikkeveer & Van Loohuizen Reference Slikkeveer and Van Loohuizen1996); the numerical procedure is described next.
2.2. Steady states: numerical method
The steady-state versions of the governing equations and boundary conditions given by (2.1)–(2.10) are solved using a consistent penalty Galerkin finite-element method implemented within FreeFem++ (Hecht Reference Hecht2012) based on the standard Taylor–Hood element and piecewise quadratic element approximations for the flow field variables and interface deformation magnitude, respectively. The system of partial differential equations (2.1) and (2.2) subject to the boundary conditions (2.4)–(2.10) are transformed into their weak forms, the dependent variables in the equations approximated using suitable basis functions. The computational domain is divided into subdomains around which the approximated variables are defined to obtain a set of nonlinear algebraic relations among the unknown parameters of the approximations. Due to the system nonlinearity, the set of equations was solved using Newton's method. In the determination of the interface shape, kinematic update (Slikkeveer & Van Loohuizen Reference Slikkeveer and Van Loohuizen1996) is used based on a pseudo-time-step technique, allowing for the gradual satisfaction of the no-penetration condition on the interface, so that (2.9) is written as
 \begin{equation} \boldsymbol{r}_b^{i} = \boldsymbol{r}_b^{i-1} + \delta \tau (\boldsymbol{u}^{i-1} \boldsymbol{\cdot} \boldsymbol{n}^{i-1}) \boldsymbol{n}^{i-1}, \end{equation}
where  $i$ denotes interface deformation iteration number and
 $\delta \tau$ is a dimensionless pseudo-time-step whose value (
 $0.01\le \delta \tau \le 0.5$), is chosen to ensure that the Newton iteration and mesh update stages, discussed in the following paragraphs, are stable.
The numerical solution begins by providing an initial guess for the bubble steady speed,  $U_b$, the flow field variables,
 $(\boldsymbol {u}, p)$ and position vector of the interface,
 $\boldsymbol {r}_b$. For the first simulation carried out,
 $N_f = 40$,
 $Eo = 60$ and
 $U_{m} = 0$, corresponding to bubble rise in a stagnant liquid,
 $U_b$ was initially taken to be
 $0.35$ and the bubble interface position was assumed to be described by a quarter-circle top, a cylindrical body and a quarter-circle bottom. The initial guess for the flow field was taken to be the solution to the Stokes equations (the equations of motion appropriate for vanishingly small Reynolds numbers) in the domain formed by the assumed bubble interface. For subsequent simulations, the previous steady-state solutions for the condition closest to the new condition was used as an initial guess.
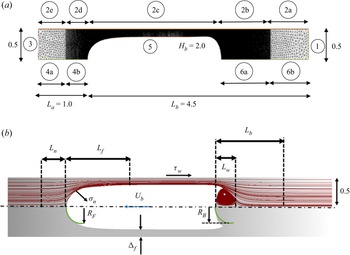
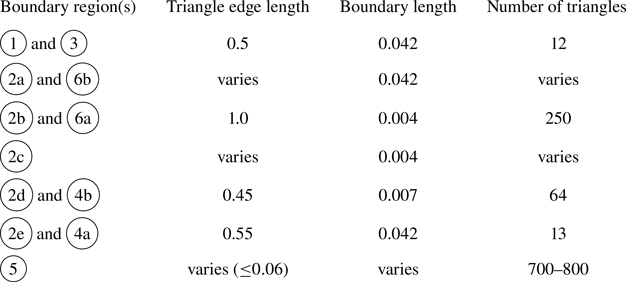
With a known initial guess, the solution proceeded in three stages: solution for the variables; steady bubble speed determination; and then domain deformation. In the variable solution stage, the resulting system of linear equations in the Newton method is solved using a multifrontal massively parallel sparse direct solver (MUMPS) to obtain updated values for the velocity, pressure and interface deformation magnitudes. The updated velocity field is then transformed from a moving to a fixed frame of reference from which the axial velocity at the bubble nose is extracted and set as the steady bubble speed. Using the interface deformation magnitude obtained in the variable solution stage, the magnitude of the deformation of the domain is then determined. For all other nodes in the domain, the size of their deformations is adapted to that of the interface in a way that ensures that the mesh quality does not degrade rapidly by assuming that the computational mesh is an elastic body whose interior deforms in response to the boundary deformation. This assumption forms the basis of the elastic mesh update method of treating interior nodes which involves solving a linear elasticity equation for the mesh deformation subject to the boundary conditions that equals the desired deformation on the boundaries (Johnson & Tezduyar Reference Johnson and Tezduyar1994; Ganesan & Tobiska Reference Ganesan and Tobiska2008). The iterative process is halted when the interface position vector and the values of the flow field variables, steady bubble speed and pressure no longer change, and the no-penetration condition is satisfied. Full implementation details are described in Abubakar (Reference Abubakar2019) and the validation carried out simulating the experiment of Bugg & Saad (Reference Bugg and Saad2002) is provided as additional information (see § 2 of the supplementary information available at https://doi.org/10.1017/jfm.2022.261). For the analysis carried out in this study, the mesh is boundary-fitted, structured such that regions around the bubble are finely resolved as shown in figure 3(a) with further details in table 1, and the steady-state features investigated are shown in figure 3(b).
Mesh structure around the Taylor bubble (a), with information provided in table 1; schematic representation of the main hydrodynamic features of the bubble considered in the present work (b). All features are dimensionless and are based on the characteristic scales stated in § 2. In (a),  $H_b$ denotes the dimensionless equivalent length of pipe that the gas would occupy if it were to completely fill the pipe cross-section, and in (b),
 $U_b$ represents the bubble rise speed,
 $R_F$ the average radius of curvature of the bubble nose,
 $L_n$ and
 $L_f$ the flow stabilisation lengths ahead of bubble nose and in the liquid film region, respectively;
 $\varDelta _f$ is the equilibrium film thickness,
 $\tau _w$ is the wall shear stress,
 $\sigma _n$ is the normal stress at the interface;
 $R_B$ denotes the average radius of curvature of the bubble bottom, and
 $L_w$ and
 $L_b$ the length of the wake and the flow stabilisation length below the bubble bottom, respectively.

Number and length of the edge of triangle elements at different sections of the domain boundaries used in mesh generation (see figure 3a).

3. Linear stability analysis
3.1. Normal mode perturbations and eigenvalue problem
We begin the description of the linear stability model development from the weak forms of the momentum, continuity and kinematic boundary condition equations (see § 1 of the supplementary information), as follows:
 \begin{align} &
\int_{V}\left\{\frac{\partial {\boldsymbol{u}}}{\partial t}
\boldsymbol{\cdot} \boldsymbol{\varPhi}
+\left[\left({\boldsymbol{u}}
\boldsymbol{\cdot}\boldsymbol{\nabla}
\right)\boldsymbol{u}\right] \boldsymbol{\cdot}
\boldsymbol{\varPhi} +2 N_f^{{-}1}
\boldsymbol{E}\left({\boldsymbol{u}} \right):
\boldsymbol{E}\left(\boldsymbol{\varPhi} \right) -{p}
\left(\boldsymbol{\nabla}
\boldsymbol{\cdot}\boldsymbol{\varPhi} \right)\right\}{\rm
d} V, \nonumber\\ &\quad
-\int_{A_b}\{[{Eo}^{{-}1}\kappa + \mathrm{z} -
\mathrm{P}_{\mathrm{b}}] \boldsymbol{n}
\boldsymbol{\cdot} \boldsymbol{\varPhi}\}{\rm d}
A_b=0, \end{align}
 \begin{gather} \int_{V}\left\{\left(\boldsymbol{\nabla}\boldsymbol{\cdot}\boldsymbol{u} \right)\varphi\right\}{\rm d} V = 0. \end{gather}
 \begin{gather}\int_{A_b} \left\{\left[{\frac{{\rm d}\boldsymbol{r}_b}{{\rm d} t} \boldsymbol{\cdot} \boldsymbol{n} -\boldsymbol{u} \boldsymbol{\cdot} \boldsymbol{n}}\right] \xi \right\} {\rm d} A_b =0, \end{gather}
where  $\boldsymbol {\varPhi }$,
 $\varphi$ and
 $\xi$ denote the test functions for the velocity vector, pressure and interface deformation magnitude, respectively. It is imagined that the two-dimensional axisymmetric steady-state solution generated in § 2 is revolved in the azimuthal direction to form a three-dimensional bubble, see figure 2. Similar to domain perturbation (Christodoulou & Scriven Reference Christodoulou and Scriven1988; Carvalho & Scriven Reference Carvalho and Scriven1999), we assume that infinitesimal perturbations are added to the three-dimensional base state solution, (3.4)–(3.6), and that (3.1)–(3.3) are valid on the perturbed base state,
 \begin{gather} \boldsymbol{r} = \boldsymbol{r}^0 + \epsilon \tilde{\boldsymbol{x}}, \end{gather}
 \begin{gather}\boldsymbol{u} = \boldsymbol{u}^0 + \epsilon \tilde{\boldsymbol{u}}, \end{gather}
 \begin{gather}p = p^0 + \epsilon \tilde{p}, \end{gather}
where  $\boldsymbol {r}^0 = (r^0,\theta ^0,z^0)$,
 $\boldsymbol {u}^0$ and
 $p^0$ represent the position vector, velocity vector and pressure of the unperturbed three-dimensional base state solution, respectively. Here
 $\tilde {\boldsymbol {x}} = (\tilde {x}_r,\tilde {x}_\theta,\tilde {x}_z)$,
 $\tilde {\boldsymbol {u}}$ and
 $\tilde {{p}}$ are the deformation field, velocity perturbation, and pressure perturbation, defined over the entire base flow domain, respectively. The notation
 $\epsilon \ll 1$ is to signify the infinitesimally small nature of the applied perturbations.
The perturbed three-dimensional domain is then linearised around the base state three-dimensional axisymmetric domain, the deformation field restricted to the interface (Carvalho & Scriven Reference Carvalho and Scriven1999), just as is expected in the classical linear stability approach; finally, the linearisation of the perturbed flow field variables about the base state solution is carried out. Neglecting all terms of order  $\epsilon ^2$, and noting that (3.1)–(3.3) are satisfied on the base flow, yields a new set of momentum, continuity and kinematic condition equations that feature the perturbation variables. This approach to the derivation of the perturbation equations can be seen as an extension of the total linearisation method (Kruyt et al. Reference Kruyt, Cuvelier, Segal and Van Der Zanden1988; Cuvelier & Schulkes Reference Cuvelier and Schulkes1990) to a three-dimensional linear stability analysis. We now take the following normal mode forms for the perturbation variables:
 \begin{gather} \tilde{\boldsymbol{u}}\left( r,\theta,z, t \right) = \hat{\boldsymbol{u}}\left( r,z \right)\exp\left(\mathfrak{i}m \theta + \beta t\right), \end{gather}
 \begin{gather}\tilde{p}\left( r,\theta,z, t \right) = \hat{p}\left( r,z \right) \exp\left(\mathfrak{i}m \theta + \beta t\right), \end{gather}
 \begin{gather}\tilde{h}\left(s, \theta, t \right)= \hat{h} \left(s\right) \exp\left(\mathfrak{i} m \theta + \beta t\right), \end{gather}
and their corresponding test functions as
 \begin{gather} \boldsymbol{\varPhi} \left( r, \theta, z\right) = \bar{\boldsymbol{\varPhi}} \left( r, z\right)\exp\left(-\mathfrak{i} m \theta\right), \end{gather}
 \begin{gather}{\varphi} \left( r, \theta, z\right) = \bar{\varphi} \left( r, z\right)\exp\left(-\mathfrak{i} m \theta\right), \end{gather}
 \begin{gather}\xi \left( s, \theta \right) = \bar{\xi}\left( s\right)\exp\left(-\mathfrak{i}m \theta\right), \end{gather}
where (3.7)–(3.9),  $\hat {\boldsymbol {u}}$,
 $\hat {p}$ and
 $\hat {h}$ are complex functions of space representing the amplitude of the velocity, pressure and interface deformation perturbations, respectively;
 $m$ is a dimensionless (integer) wavenumber in the azimuthal direction
 $\theta$;
 $\beta =\beta _R + {\rm i}\beta _I$ is the complex growth rate which can be decomposed into its real
 $\beta _R$ and imaginary
 $\beta _I$ parts denoting the temporal growth rate and frequency, respectively: if
 $\beta _R$ is positive (negative), the disturbance grows (decays) exponentially in time and the base flow is linearly unstable (stable); if
 $\beta _R$ is zero, the disturbance is neutrally stable.
Substituting (3.7) and (3.8) into the obtained perturbation equations and then integrating out the  $\theta$-dependence yields equations governing the normal mode evolution of the perturbations as a function of
 $N_f$,
 $Eo$,
 $U_{m}$ and
 $m$, which can be recast as a generalised eigenvalue problem,
 \begin{equation} \beta \boldsymbol{B} \boldsymbol{y} = \boldsymbol{J} \boldsymbol{y}, \end{equation}
with  $\boldsymbol {B}$,
 $\boldsymbol {y}$ and
 $\boldsymbol {J}$ being the mass matrix, eigenfunctions and the Jacobian matrix, respectively. Details of the derivation of (3.9) from the weak form of the governing equations and the boundary condition imposed are given in § 4 of the supplementary information. We stress that while it is customary to impose additional conditions along the axis of symmetry
 $\varGamma _{sym}^0$, we did not apply any such conditions in this case because the model equations were written around the perturbed three-dimensional domain and then linearised before integrating out the
 $\theta$ dependence.
3.2. Linear stability: numerical method
The linear stability of the steady-state solutions as a parametric function of the system dimensionless groups is determined by solving a generalised, asymmetric matrix eigenvalue problem given by (3.9) using a shift-and-invert approach (Christodoulou & Scriven Reference Christodoulou and Scriven1988) based on the iterative Arnoldi method available in ARPACK (Lehoucq, Sorensen & Yang Reference Lehoucq, Sorensen and Yang1997), which can be called within FreeFem++, using the standard Taylor–Hood element for the flow field perturbation variables and piecewise quadratic element for interface deformation magnitude as in the steady-state simulations. The accuracy of the converged leading eigenvalue is confirmed by ensuring that a residual defined as  $| \boldsymbol {J} \boldsymbol {y} - \beta \boldsymbol {B} \boldsymbol {y} |$ is always less than
 $1 \times 10^{-10}$. The derived eigenvalue problem based on the developed perturbation equations, and the numerical solution method are validated by examining the stability of a spherical bubble of fixed volume in a stagnant liquid with negligible gravitational and boundary effects. The bubble is stable under these conditions and its motion is governed by an analytical solution (Miller & Scriven Reference Miller and Scriven1968; Prosperetti Reference Prosperetti1980). Comparisons between our numerical results for the eigenvalues with the analytical solution given in Prosperetti (Reference Prosperetti1980) for small amplitude normal mode perturbations show excellent agreement between the two results (see § 5 of supplementary information).
4. Results: base state
4.1. Stagnant liquids  $(U_m=0)$

In this section, we present a discussion of our parametric study of a Taylor bubble of dimensionless volume  $V_B = 0.3389 {\rm \pi}$, equivalent length
 $H_b = 1.3556$, in a stagnant liquid (
 $U_m = 0$). The effects of
 $N_f$ and
 $Eo$ on the hydrodynamic features of a steadily rising Taylor bubble depicted in figure 3(b) are examined.
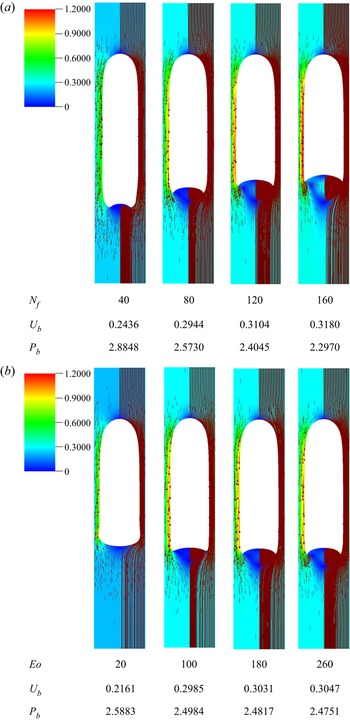
Inspired by Kang et al. (Reference Kang, Quan and Lou2010), for each Taylor bubble, the steady-state shape is presented as a sectional plane through the centre of its three-dimensional axisymmetric shape, coloured using the velocity magnitude, with streamlines and vector fields superimposed on the left-hand and right-hand sides of the axis of symmetry, respectively. The inverse viscosity number  $N_f$ is a measure of the relative importance of the magnitude of gravity to the viscous force. At constant
 $Eo$ and
 $U_m$, an increase in
 $N_f$ is associated with a decrease in liquid viscosity and its influence on the bubble shape and the surrounding flow field is shown in figure 4(a) for
 $Eo = 220$ and
 $U_m = 0.00$. It is seen that by increasing
 $N_f$, the drag force on the bubble is reduced as reflected by an increase in the rise speed,
 $U_b$, whose value saturates for large
 $N_f$; this is in agreement with experimental observations (White & Beardmore Reference White and Beardmore1962; Nogueira et al. Reference Nogueira, Riethmuller, Campos and Pinto2006a; Llewellin et al. Reference Llewellin, Del Bello, Taddeucci, Scarlato and Lane2012). It is also discernible from figure 4(a) that the thickness of the film between the bubble and the pipe wall decreases with
 $N_f$. It can be deduced (see the good correlation between the results obtained for the influence of
 $N_f$ on interface normal stress and the film thickness shown in figures 3b and 5a–c of the supplementary information) that the decrease in the film thickness is related to the decrease in normal stress in this region. The decrease in the magnitude of the normal stress component with increasing
 $N_f$ is also accompanied by a decrease in the bubble length as well as its pressure
 $P_b$.
Steady shapes, streamlines and flow fields associated with bubble rise in stagnant liquids: (a) effect of  $N_f$ for
 $Eo = 220$; (b) effect of
 $Eo$ for
 $N_f=100$. In each panel, we show the streamlines and vector fields superimposed on the velocity magnitude pseudocolour plot on the right-hand and left-hand sides of the symmetry axis, respectively. For each case, we provide numerical predictions of the bubble rise speed,
 $U_b$, and pressure,
 $P_b$.

It can also be seen from figure 4(a) that the size and intensity of the counter-rotating vortices in the wake region increase with  $N_f$. This is related to the adverse pressure drop that accompanies the jetting of the liquid in the film into the bottom of the bubble, leading to flow separation. The magnitude of the jetting velocity, highlighted by the colour map in this figure, increases with
 $N_f$, resulting in increased wake length and volume. Another effect of the increase in the intensity of the recirculation in the wake region with
 $N_f$ is the more pronounced dimpling of the bubble bottom. It is anticipated that as
 $N_f$ is increased further, the bubble bottom will eventually form a skirted tail as seen in Kang et al. (Reference Kang, Quan and Lou2010) and ultimately undergo breakup into small bubbles as observed in experiments (Campos & Guedes de Carvalho Reference Campos and Guedes de Carvalho1988; Nogueira et al. Reference Nogueira, Riethmuller, Campos and Pinto2006b). Therefore, it is expected that at very high
 $N_f$ (and
 $Eo$), a topological transition is approached, and reaching a converged steady-state solution becomes increasingly difficult.
For a fixed value of  $N_f$ and
 $U_m$, changes in
 $Eo$ are related to variations in the relative influence of buoyancy to surface tension forces. To assess the effect of
 $Eo$ on the steady-state shape and flow field around a Taylor bubble, four simulation cases with
 $N_f=100$ are shown in figure 4(b). Under the influence of
 $Eo$, changes in the concavity of the bubble bottom are most noticeable. As
 $Eo$ increases, the bubble bottom becomes more deformed with the tails of the Taylor bubbles becoming elongated due to the decrease in the tendency of the interface to resist deformation. Unlike the case of varying
 $N_f$, changes in
 $Eo$ result in a marginal influence on the pressure inside the bubble, and bubble length, particularly beyond
 $Eo = 100$, as shown in figure 4(b).
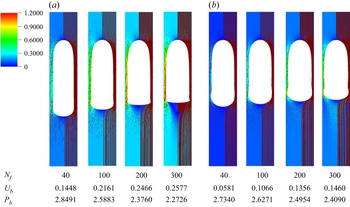
In figure 5, we focus on the region in parameter space where  $Eo<20$, which has been highlighted by White & Beardmore (Reference White and Beardmore1962) as being the one in which surface tension effects are expected to be significant; here, we show the effect of
 $N_f$ on the bubble steady-state shapes and flow fields at
 $Eo = 10$ and
 $20$. In contrast to what was observed at higher values of
 $Eo$ in figure 4(a), an increase in the value of
 $N_f$ has little influence (and this influence decreases with decreasing
 $Eo$) on the bubble length and deformation of the bubble bottom. What is seen instead is the emergence of a bulge in the film region close to the bubble bottom, which becomes more pronounced and appears to propagate towards the nose in the form of a capillary wave as
 $N_f$ and
 $Eo$ are increased and decreased, respectively. We now turn our attention to examining the nose region of the bubble which is discussed next (see § 6 of supplementary information for details of the other principal regions).
Effect of variation of  $N_f$ on the steady Taylor bubble shapes at low
 $Eo$: (a)
 $Eo = 20$ and (b)
 $Eo = 10$.

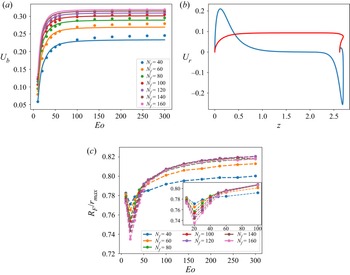
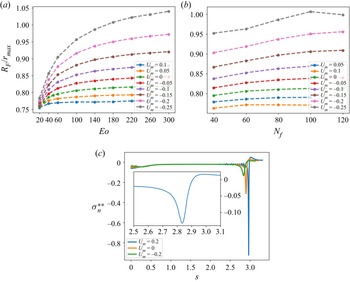
The key hydrodynamic features around the nose region (a precise definition of the spatial extent of this region is provided below) are the rise speed  $U_b$ and the nose curvature. In figure 6(a), the numerical results for
 $U_b$ are compared with the predictions from the empirical correlation of Viana et al. (Reference Viana, Pardo, Yánez, Trallero and Joseph2003) given by
 \begin{equation} U_b = \frac{{0.34}
[1 + \left( 14.793/Eo \right)^{3.06}]^{{-}0.58}}{[1 + ( N_f [ 31.08
( 1 + ( 29.868/Eo )^{1.96} )^{0.49}]^{{-}1} )^{\varTheta}]^{{-}1.0295\varTheta^{{-}1}}},
\end{equation}
where the parameter  $\varTheta$ is expressed by
 \begin{equation} \varTheta ={-}1.45
[1 + (24.867 Eo)^{9.93}]^{0.094}.
\end{equation}
Flow characteristics associated with the nose region for bubbles rising in stagnant liquids: (a) effect of  $N_f$ and
 $Eo$ on steady-state bubble rise speed showing a comparison between numerical results (coloured marker symbols) and analytical prediction of (4.1) (coloured continuous line); (b) typical radial velocity profile (blue) along the interface (red) for
 $N_f = 80$ and
 $Eo = 140$; (c) frontal radius
 $R_F$ normalised by the maximum Taylor bubble radius for the respective
 $(N_f,Eo)$ pairing
 $r_{max}$ showing convergence towards a constant value of
 $0.815$ for
 $N_f \geq 80$ with the inset displaying an enlarged view of the
 $10 \leq Eo \leq 60$ range.

The overall agreement between the numerical predictions and those obtained from (4.1) is satisfactory and improves with increasing  $N_f$. This is because a large proportion of the data used in generating the correlation are based on experiments conducted in the inertia regime (Viana et al. Reference Viana, Pardo, Yánez, Trallero and Joseph2003). It is also seen clearly from figure 6(a) that for all
 $N_f$ values investigated, the magnitude of
 $U_b$ increases steeply with
 $Eo$ at low
 $Eo$ then gradually with rising
 $Eo$ before reaching a plateau at large
 $Eo$. Saturation of
 $U_b$ with
 $N_f$ is also observed at high
 $N_f$. For conditions in which
 $U_b$ is essentially independent of
 $Eo$, which can be deduced from figure 6(a) to be around
 $Eo = 100$, the limiting value of
 $N_f$ and the corresponding
 $U_b$, as established by numerous previous studies (Dumitrescu Reference Dumitrescu1943; Griffith & Wallis Reference Griffith and Wallis1961; White & Beardmore Reference White and Beardmore1962; Brown Reference Brown1965; Zukoski Reference Zukoski1966; Viana et al. Reference Viana, Pardo, Yánez, Trallero and Joseph2003; Lu & Prosperetti Reference Lu and Prosperetti2009; Kang et al. Reference Kang, Quan and Lou2010), are
 $300$ and
 $0.35$, respectively, also in agreement with the numerical results shown in figure 6(a).
Figure 6(b) shows a typical profile of the radial component of the velocity along the interface of a Taylor bubble generated with  $N_f=80$ and
 $Eo=140$. Starting from the nose of the bubble, which is a stagnation point in a frame of reference that moves with the bubble rise speed, the general observation is that the radial velocity component increases until it peaks before gradually diminishing, approaching zero in the fully developed film. The region starting from the nose and ending at the point at which the radial velocity on the interface attains its maximum value is referred to as the ‘nose region’. For all points in this region, the mean radius of curvature
 $R_m$ is related to the total curvature
 $\kappa$ by
 \begin{equation} \frac{2}{R_m} = 2 \kappa_m = \kappa_a + \kappa_b = \kappa, \end{equation}
where  $\kappa _m$ denotes the mean curvature while
 $\kappa _a$ and
 $\kappa _b$ are the principal components of
 $\kappa$ in the
 $r$–
 $z$ and
 $r$–
 $\theta$ planes, respectively. The average of the mean radius of curvature is computed and reported as the frontal radius,
 $R_F$. The effects of
 $N_f$ and
 $Eo$ on
 $R_F$ normalised by the maximum bubble radius
 $r_{max}$ are shown in figure 6(c) from which it is seen that for
 $Eo < 100$,
 $R_F/r_{max}$ is a non-monotonic function of
 $Eo$: it decreases with
 $Eo$ before increasing again beyond a certain
 $Eo$ value. This value of
 $Eo$, at the turning point of
 $R_F$, decreases with increasing
 $N_f$, approaching a constant that lies between
 $Eo = 20$ and
 $Eo = 30$, probably related to the emergence of the bulge around the lower part of the film region. For
 $Eo > 100$, the frontal radius is weakly dependent on
 $Eo$, increases with
 $N_f$ becoming essentially independent of
 $N_f$ at high
 $N_f$. These trends are consistent with those associated with the effects of
 $N_f$ and
 $Eo$ on
 $U_b$ confirming the fact that the rise speed is related to the curvature of the bubble nose.
We also find that for  $Eo > 100$ and
 $N_f=(40, 60, 80, 100, 120, 140,160)$, the frontal radius is
 $R_F= (0.2818, 0.2951, 0.3043, 0.3108, 0.3155, 0.3188, 0.3216)$, respectively, in agreement with previous studies (Fabre & Liné Reference Fabre and Liné1992; Bugg, Mack & Rezkallah Reference Bugg, Mack and Rezkallah1998; Funada et al. Reference Funada, Joseph, Maehara and Yamashita2005; Feng Reference Feng2008); these results suggest that the bubble nose is prolate-like rather than spherical in shape in which
 $R_F \approx 0.4$. Under inertial conditions, Brown (Reference Brown1965) demonstrated that the frontal radius of the Taylor bubbles normalised by its respective maximum bubble radius
 $r_{\rm max}$ is the same for all liquids and takes a value of 0.75. The results shown in figure 6(c) indicate that the normalised
 $R_F$ approaches a value of 0.815 for
 $N_f > 80$ which demarcates the limit in
 $N_f$ at which viscosity has a strong influence on the curvature of the bubble nose.
4.2. Flowing liquids ($U_m \neq 0$)

In this section, we focus on situations where the bubble rises in flowing liquids in a fixed frame of reference. The flow in the liquid is characterised using a Froude number based on pipe centre liquid velocity. The focus in the literature has been on the dynamics of Taylor bubbles rising in upwardly flowing liquids characterised by a steady rise speed. In contrast, there is a relative dearth of studies concerning Taylor bubble motion in downward liquid flow, which is known to be accompanied by a transition to asymmetric bubble shapes (Nicklin et al. Reference Nicklin, Wilkes and Davidson1962; Martin Reference Martin1976; Lu & Prosperetti Reference Lu and Prosperetti2006; Figueroa-Espinoza & Fabre Reference Figueroa-Espinoza and Fabre2011; Fabre & Figueroa-Espinoza Reference Fabre and Figueroa-Espinoza2014; Fershtman et al. Reference Fershtman, Babin, Barnea and Shemer2017).
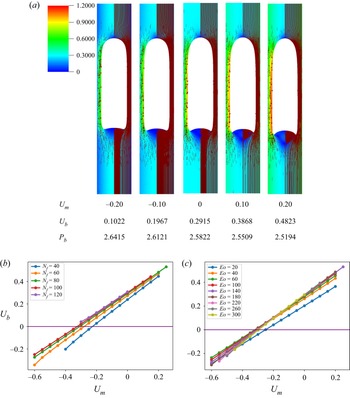
For a constant  $N_f = 80$ and
 $Eo = 140$, the effect of imposed upward and downward liquid flow is shown in figure 7(a). It is seen clearly that a decrease (increase) in the intensity of the wake flow, accompanied by a decrease (increase) of the concavity of the bubble bottom, is observed with an increase in the magnitude of the downward (upward) liquid flow. This, as noted earlier when discussing the stagnant liquid case, can be linked to the decrease (increase) in the magnitude of the liquid emerging from the film into the liquid slug, which is a manifestation of the decrease (increase) in the bubble rise speed, as the downward (upward) liquid velocity is increased. Quantitatively, the effect of
 $U_m$ on
 $U_b$ is shown in figures 7(b) and 7(c) whence we deduce the existence of a critical
 $U_m$ value for downward flow that leads to bubble arrest characterised by
 $U_b=0$, which increases with
 $N_f$ and decreases (increases) with
 $Eo$ for
 $Eo \ge 100$ (
 $Eo < 100$), respectively. It is also noticeable from figure 7(a) that there is an increase (decrease) in the radius of curvature of the bubble nose with increasing magnitude of the downward (upward) liquid flow (see also figures 8a and 8b). This flattening (sharpening) of the bubble nose can be attributed to the increase (decrease) in the normal stress exerted on the bubble nose relative to that in stagnant liquid as a result of the increased opposing (reinforcing) force of the flowing liquid far ahead of the bubble in the downward (upward) direction.
Effect of  $U_m$ on the steady-state bubble shape and the surrounding flow field with
 $N_f = 80$ and
 $Eo = 140$ (a); here, the streamlines and vector fields are superimposed on velocity magnitude pseudocolour plot on the right-hand and left-hand sides of the symmetry axis, respectively; variation of the steady bubble rise speed
 $U_b$ with
 $U_m$ (b); for different
 $N_f$ and with
 $Eo=140$ (c); for different
 $Eo$ and with
 $N_f=80$.

Effect of  $U_m$ on the steady-state bubble interface features (a); variation of frontal radius,
 $R_F$ with
 $U_m$ and
 $Eo$ for
 $N_f = 80$ (b); variation of frontal radius,
 $R_F$ with
 $U_m$ and
 $N_f$ for
 $Eo = 140$ (c); spatial variation of the steady, modified interface normal stress
 $\sigma ^{**}_n$ for different
 $U_m$ and with
 $N_f = 80$ and
 $Eo = 140$; the inset shows an enlarged view of
 $\sigma ^{**}_n$ for
 $2.5 \leq s \leq 3.1$ for
 $U_m=0.2$ which demonstrates that this quantity is well-resolved in this boundary-like region of rapid variation.

It is clear from figure 8(c) that the interface normal stress is an increasing (decreasing) function of the increased liquid velocity in the downward (upward) liquid flow. As explained in the previous section for stagnant liquids, within the equilibrium film, the normal stress, total pressure and the bubble pressure are approximately equal, which is responsible for the observed increase (decrease) in bubble pressure with increasing downward (upward) liquid flow (see figure 7a). Also, outside the equilibrium film region, we had stated that it is the interplay between the viscous stress and curvature that determines the shape of the regions. To buttress this claim, the normal stress is again modified by choosing the reference pressure to be the bubble pressure such that
 \begin{equation} \sigma_n^{**} ={-} \left[{-}p_T* + 2N_f^{{-}1} \boldsymbol{n} \boldsymbol{\cdot} \frac{{\rm d} \boldsymbol{u}}{{\rm d} n} \right] ={-} {Eo}^{{-}1} \kappa, \end{equation}
where  $p_T* = p_T - P_b$, thereby making the normal stress in the equilibrium film region approximately zero as the stress due to interfacial curvature
 $\kappa _b$ is negligibly small. As the nose region is approached, the net effect of the viscous stress on the normal stress in downward (upward) liquid flow is to increase (decrease) the normal stress relative to that in a stagnant liquid, which in order to satisfy the normal stress balance at the interface, the curvature stress has to decrease (increase), leading to the observed increase (decrease) in the radius of curvature of the nose.
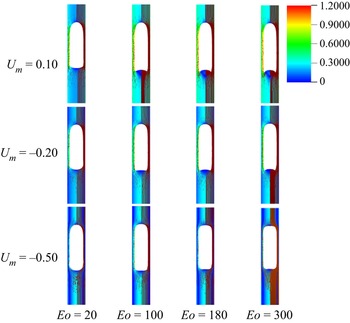
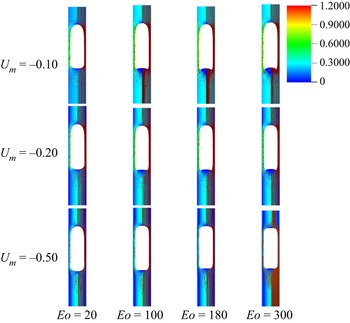
We have also carried out a full parametric study of the effect of  $U_m$ on the steady bubble shape and associated flow field for a wide range of
 $N_f$ and
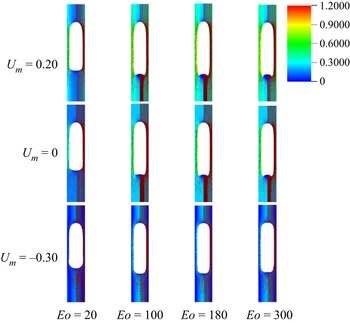
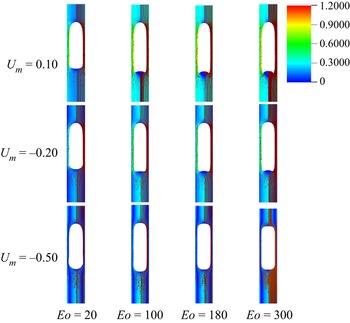
 $Eo$. As shown in figures 9–13, a transition from downward to upward flow, characterised by a change in the sign of
 $U_m$ has a similar effect on the bubble bottom to an increase in
 $Eo$ for constant
 $N_f$ or a rise in
 $N_f$ with
 $Eo$ held fixed; this transition results in concave tails accompanied by intense wake formation for sufficiently large
 $Eo$ and/or
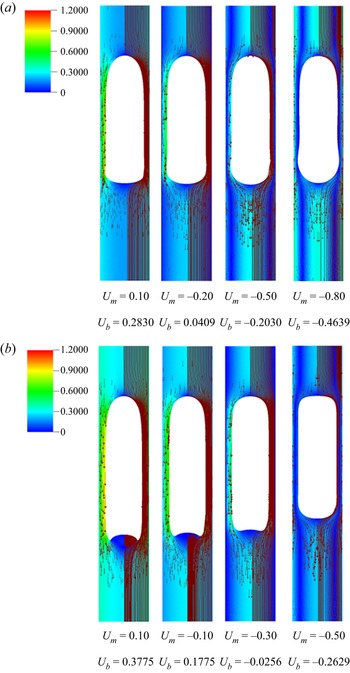
 $N_f$. For the lowest values of
 $Eo$ investigated, the bubbles develop bulges in the zone connecting the thin film and the bottom regions of the bubble which become more pronounced with increasingly negative
 $U_m$ values (see figure 10a). Furthermore, an increase in the negative value of
 $U_m$ results in shorter bubbles with more flattened noses. For sufficiently large and negative
 $U_m$, we see the emergence of bubbles with dimpled tops and/or bottoms, an indication of a steadily falling bubble, which is confirmed by the negative value of their rise velocity, see figure 10(b).
The effect of  $U_m$ and
 $Eo$ on the steady bubble shapes and flow fields with
 $N_f = 40$. In each panel, the streamlines and vector fields are superimposed on velocity magnitude pseudocolour plot on the right-hand and left-hand sides of the symmetry axis, respectively.

Steady-state bubble shapes in flowing liquids: (a) effect of  $U_m$ for
 $N_f = 80$ and
 $Eo = 20$; (b) effect of
 $U_m$ for
 $N_f=60$ and
 $Eo = 220$. In each panel, we show the streamlines and vector fields superimposed on the velocity magnitude pseudocolour plot on the right-hand and left-hand sides of the symmetry axis, respectively. For each case, we provide numerical predictions of the bubble rise speed,
 $U_b$.

The effect of  $U_m$ and
 $Eo$ on the steady bubble shapes and flow fields with
 $N_f = 60$. In each panel, the streamlines and vector fields are superimposed on velocity magnitude pseudocolour plot on the right-hand and left-hand sides of the symmetry axis, respectively.

The effect of  $U_m$ and
 $Eo$ on the steady bubble shapes and flow fields with
 $N_f = 80$. In each panel, the streamlines and vector fields are superimposed on velocity magnitude pseudocolour plot on the right-hand and left-hand sides of the symmetry axis, respectively.

The effect of  $U_m$ and
 $Eo$ on the steady bubble shapes and flow fields with
 $N_f = 100$. In each panel, the streamlines and vector fields are superimposed on velocity magnitude pseudocolour plot on the right-hand and left-hand sides of the symmetry axis, respectively.

5. Results: linear stability
In this section, we provide a discussion of the linear stability results starting with the dependence of the growth rate  $\beta _R$ obtained from the leading eigenvalues associated primarily with the first two modes,
 $m=1$ and
 $m=2$, as a parametric function of
 $N_f$,
 $Eo$ and
 $U_m$. The asymmetric bubble shape near instability onset, associated with the most dangerous linear mode, is also discussed, and a stability map is plotted which clearly demarcates the stability boundary as a function of the system parameters.
5.1. Dominant modes of instability
The linear stability of axisymmetric steady states associated with  $40 \leq Nf \leq 100$ and
 $20 \leq Eo \leq 300$ was investigated for downward liquid flow characterised by
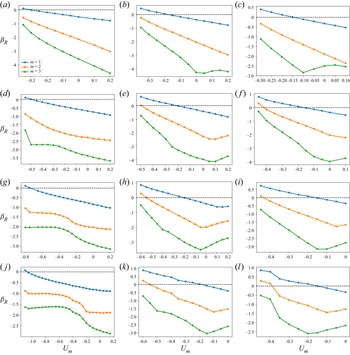
 $U_m <0$. In figure 14, we show the dependence of the growth rate
 $\beta _R$ on
 $U_m$ for modes
 $m=1$,
 $m=2$, and
 $m=3$ for
 $N_f=40,60,80,100$ and
 $Eo=20,180,300$. For all the cases shown in this figure, it is evident that
 $m=1$ is the most unstable mode, which corresponds to a deflection of the bubble away from the axis of symmetry and occurs over a well-defined range of negative
 $U_m$ values for which
 $\beta _R >0$ indicating the presence of a linear instability. For sufficiently large
 $Eo$ and
 $N_f$, the
 $m=2$ is also unstable, though it remains subdominant to the
 $m=1$ mode, as illustrated in figure 14(l), for instance, for the
 $N_f=100$ and
 $Eo=300$ case. Modes associated with
 $m=0$ and
 $m \geq 3$ have
 $\beta _R \leq 0$ for all values of
 $N_f$,
 $Eo$ and
 $U_m$ studied, and play no role in the transition to linear instability. Furthermore, for all the cases examined, the eigenvalues associated with the
 $m=1$ and
 $m=2$ modes are real.
Growth rate,  $\beta _R$, as a function of
 $U_m$ for
 $N_f = 40$, 60, 80 and 100, shown in (a–c), (d–f), (g–i) and (j–l), respectively, with
 $Eo = 20$ in (a,d,g,j),
 $Eo=180$ in (b,e,h,k) and
 $Eo=300$ in (c,f,i,l). The results are shown for the modes
 $m = 1, 2$ and
 $3$.

From figure 14, it is seen that for  $N_f=40,60,80,100$, increasing
 $Eo$ is accompanied by a decrease in the magnitude of
 $U_m$ required for instability, though this trend appears to saturate at large
 $Eo$. Moreover, in figure 15, which depicts the variation of
 $\beta _R$ with
 $Eo$ and with
 $N_f=80$ held constant, the critical
 $Eo$ for which the
 $m=1$ mode is destabilised is reduced threefold as
 $U_m$ is varied from
 $-$0.2 to
 $-$0.55. Thus, the results presented in figures 14 and 15 demonstrate that increasing the velocity of the downward flowing liquid and/or decreasing the relative significance of surface tension forces is destabilising.
Growth rate,  $\beta _R$, as a function of
 $Eo$, with
 $N_f =80$ and
 $U_m = -0.20$ (a),
 $U_m = -0.35$ (b) and
 $U_m = -0.55$ (c). The results are shown for
 $m = 1, 2$ and
 $3$.

Inspection of figure 14 also reveals that decreasing  $N_f$ for
 $Eo=180$ and
 $Eo=300$, that is, for weak surface tension, appears to have little effect on the critical
 $U_m$ and the magnitude of
 $\beta _R$ for the most dangerous mode,
 $m=1$. In contrast, for
 $Eo=20$, decreasing
 $N_f$ leads to a substantial decrease in the critical
 $U_m$ value and is therefore strongly destabilising indicating that viscous effects gain in significance as the relative importance of surface tension increases with decreasing
 $Eo$ for sufficiently low
 $Eo$. Furthermore, from figures 14(a,d), 14(b,e) and 14(c,f), it is also seen that decreasing
 $N_f$ from
 $N_f=60$ to
 $N_f=40$ also leads to a large reduction in the critical
 $U_m$ even at high
 $Eo$ values for sufficiently small
 $N_f$.
We offer an explanation of the trends highlighted above by focusing on the bubble nose and appealing to the fact that the frontal radius of curvature of the nose,  $R_F$, in stagnant and downward flowing liquids increases with
 $Eo$ then saturates for
 $Eo \gtrsim 100$ and is weakly dependent on
 $N_f$ for
 $N_f \gtrsim 60$. For
 $N_f < 60$,
 $R_F$ is reduced with decreasing
 $N_f$. For
 $Eo < 100$,
 $R_F$ exhibits a turning point in
 $Eo$ for all
 $N_f$ values studied with a well-defined crossover
 $Eo$ value below which the magnitude of the
 $R_F$ minima increase with decreasing
 $N_f$. These results demonstrate that bubble noses become flatter with decreasing and increasing
 $N_f$ for sufficiently small and large
 $Eo$, respectively. We have also shown in § 4 that increasingly negative
 $U_m$ has a similar effect leading to flatter bubble noses regardless of the value of
 $N_f$ and
 $Eo$; this is attributed to the increase in the normal stress exerted on the bubble nose relative to that in a stagnant liquid due to the commensurate increase in the opposing force of the downward flowing liquid. The results in § 4 for the nose curvature and its dependence on
 $N_f$,
 $Eo$ and
 $U_m$ thus appear to mirror the linear stability trends presented in figures 14–15. In particular, the significant destabilisation of the bubble with
 $Eo$ increasing from 20 to 180 and its subsequent saturation, the destabilising effect of
 $N_f$ with decreasing
 $N_f$ at
 $Eo=20$ (see figure 4a,j), the weak dependence on the stability characteristics for
 $N_f=40,60,80,100$ for
 $Eo=180,300$ (see figures 4b,k and 4c,l) can be correlated to the parametric dependence of the nose curvature
 $R_F$ on
 $N_f$,
 $Eo$ and
 $U_m$.
5.2. Asymmetric bubble shapes
We now study the influence of the parameters  $N_f$,
 $Eo$ and
 $U_m$ on the shapes of the eigenfunctions focusing on those associated with the interfacial deformation in order to highlight the base state bubble regions targeted by the instability. For every point on the three-dimensional axisymmetric base state interface with position vector
 $(r^0, \theta ^0, z^0 )$ in cylindrical coordinates, from (3.4) and (3.7c), and recalling that
 $\tilde {\boldsymbol {x}} = \tilde {h} \boldsymbol {n}^0$, the corresponding deformed interface points in Cartesian coordinates can be constructed,
 \begin{gather}\left. \begin{array}{l@{}}
x = r^0 \cos (\theta^0 ) + \epsilon [ h_R n_r \cos ( m
\theta^0) - h_I n_r \sin ( m \theta^0)] \cos (\theta^0) \quad
\forall\ \theta^0 \in [0,2{\rm \pi}], \\
y = r^0 \sin ( \theta^0) + \epsilon [ h_R n_r \cos ( m
\theta^0 ) - h_I n_r \sin ( m \theta^0 )] \sin ( \theta^0 ) \quad \forall\
\theta^0 \in [0,2{\rm \pi}], \\
z = z^0 + \epsilon [ h_R n_z \cos ( m \theta^0 ) - h_I n_z \sin
( m \theta^0)] \quad \forall\ \theta^0 \in [0,2{\rm \pi} ], \end{array}\right\}
\end{gather}
where  $h_R$ and
 $h_I$ denote the real and imaginary parts of the interface deformation in the normal direction;
 $n_r$ and
 $n_z$ remain the radial and axial components of the unit normal to the base state interface, respectively. In our discussion below of the three-dimensional bubble shape immediately following the transition to instability, we assign a value to the parameter
 $\epsilon$, which signifies the formally infinitesimal size of the perturbation, to enhance the visualisation of the results.
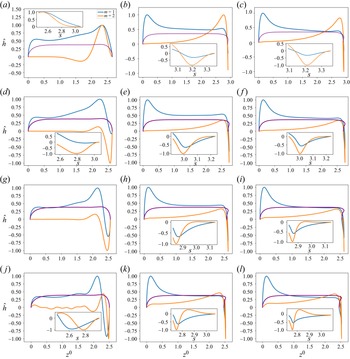
Figures 16–18 show the influence of the parameters  $N_f$,
 $Eo$ and
 $U_m$ on the eigenfunctions for the interface deformation
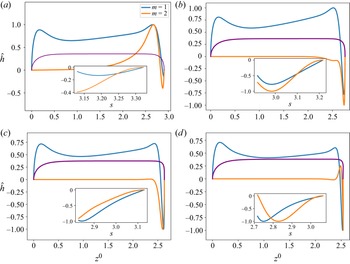
 $\hat {h}$. It is seen that the nose, film and bottom regions of the bubble are targeted to varying degrees; the precise definitions of these regions are in § 4. For the dominant eigenmode
 $m = 1$, the peaks in
 $\hat {h}$ coincide with the nose and bottom regions for high and low
 $Eo$, respectively. Around the bottom region, the observed peaks in
 $\hat {h}$ are either due to the tail structure at high
 $Eo$ (see figures 16b,e,h,k and 16c,f,i,l), or the undulation in the film region close to the bubble bottom at low
 $Eo$ (see figure 16a,d,g,j) though in the latter case we note that the
 $m=1$ mode is linearly stable for the parameters used to generate these results (
 $U_m=-0.2$,
 $Eo=20$ and
 $N_f=40,60,80,100$). For eigenmode
 $m = 2$, the peak in
 $\hat {h}$ coincides with the bottom region except at higher magnitude of downward liquid flow velocity,
 $U_m$, where similar peaks are seen in the nose region, as shown in figure 18(c). In figures 16–18, we also show enlarged views of the variation of
 $\hat {h}$ with the arc length
 $s$ for the bottom region to demonstrate that these boundary layer-like regions in
 $\hat {h}$ have been resolved adequately.
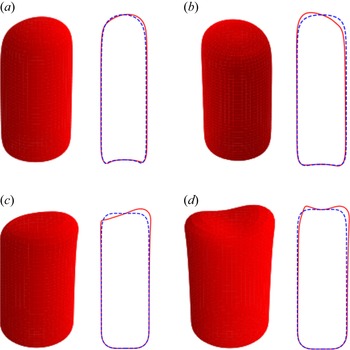
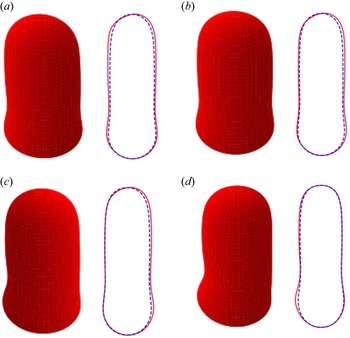
In figures 19 and 20, we show the effects of  $U_m$,
 $Eo$ and
 $N_f$ on the three-dimensional bubble shapes obtained by adding the interface deformation associated with mode
 $m = 1$ to the base state taking the value of
 $\epsilon = 0.05$ for clarity of presentation; these correspond to the shapes one might expect to observe experimentally at the onset of instability. Also shown in figures 19 and 20 are two-dimensional projections of the shapes in the
 $(r,z)$ plane which highlight the deviations from the base state within the framework of linear theory. The results shown in figure 19 are for the same parameter values used to generate figure 18, which correspond to the large
 $Eo$, weak surface tension limit; figure 19(d) also depicts the analogous results for the deformed bubble shape when
 $m = 2$. These results illustrate the asymmetry of the nose for Taylor bubble motion in downward flowing liquids for negligible surface tension and are reminiscent of the asymmetric shape observed in experiments (see figure 8 in Fabre & Figueroa-Espinoza (Reference Fabre and Figueroa-Espinoza2014), figure 10 in Martin (Reference Martin1976) and figure 3 in Fershtman et al. (Reference Fershtman, Babin, Barnea and Shemer2017)). In figure 20, on the other hand, the results are associated with
 $Eo=20$ at which surface tension effects are significant. Here, it is clearly seen that in addition to asymmetries in the nose region, the instability also targets the undulation in the bottom region as observed by Yu et al. (Reference Yu, Magnini, Zhu, Shim and Stone2021). Figure 20(d) provides a clear demonstration that the asymmetry is most pronounced in this region for the fastest downward flowing liquid case; in contrast, the bubble nose remains essentially axisymmetric in this case.
Interface deformation eigenfunctions  $\hat {h}$ for eigenmodes
 $m=1$ and
 $m=2$ as a function of base state axial position of the interface,
 $z^0$, with
 $U_m = -0.20$ and
 $N_f = 40$, 60, 80 and 100, shown in (a–c), (d–f), (g–i) and (j–l), respectively, with
 $Eo = 20$ in (a,d,g,j),
 $Eo=180$ in (b,e,h,k) and
 $Eo=300$ in (c,f,i,l). The axisymmetric base state bubble shape is also shown (coloured purple) as a reference in order to highlight the regions targeted by the instability. The insets depict enlarged views of
 $\hat {h}$ varying with the arclength
 $s$ for
 $m=1$ and
 $m=2$ in the bubble bottom region.

Interface deformation eigenfunctions  $\hat {h}$ for eigenmodes
 $m=1$ and
 $m=2$ as a function of base state axial position of the interface,
 $z^0$, with
 $U_m = -0.20$ and
 $Eo = 60$, with
 $Nf = 40$ in (a),
 $Nf=60$ in (b),
 $Nf=80$ in (c) and
 $Nf = 100$ in (d). The axisymmetric base state bubble shape is also shown (coloured purple) as a reference in order to highlight the regions targeted by the instability. The insets depict enlarged views of
 $\hat {h}$ varying with the arclength
 $s$ for
 $m=1$ and
 $m=2$ in the bubble bottom region.

Interface deformation eigenfunctions  $\hat {h}$ for eigenmodes
 $m=1$ and
 $m=2$ as a function of base state axial position of the interface,
 $z^0$, for
 $N_f = 100$,
 $Eo=220$, and with
 $U_m = -0.25$ (a),
 $U_m = -0.40$ (b), and
 $U_m = -0.55$ (c). The axisymmetric base state bubble shape is also shown (coloured purple) in order to highlight the regions targeted by the instability. The insets depict enlarged views of
 $\hat {h}$ varying with the arclength
 $s$ for
 $m=1$ and
 $m=2$ in the bubble bottom region.

Three-dimensional bubble shapes and their two-dimensional projections (solid lines) in the  $(r,z)$ plane obtained by adding the interface deformation for
 $m=1$ to the base state (dashed lines) with
 $\epsilon =0.05$ for
 $U_m = -0.25, -0.40, -0.55$, shown in (a–c), respectively, with
 $N_f = 100$ and
 $Eo = 220$. In (d), we show the analogous shape for
 $m=2$ with
 $U_m=-0.55$,
 $N_f=100$ and
 $Eo=220$.

Three-dimensional bubble shapes and their two-dimensional projections (solid lines) in the  $(r,z)$ plane obtained by adding the interface deformation for
 $m=1$ to the base state (dashed lines) with
 $\epsilon =0.05$ for
 $U_m = -0.35, -0.55, -0.80, -1.10$, and
 $N_f = 40, 60, 80, 100$, shown in (a–d), respectively, with
 $Eo = 20$.

5.3. Stability maps
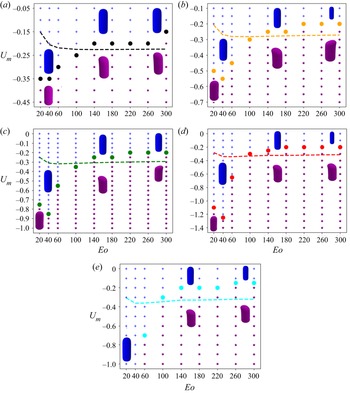
We show in figure 21 stability maps in  $(U_m,Eo)$ with
 $N_f$ varying parametrically that depict the boundaries demarcating regions of linear instability for Taylor bubbles moving in downward flowing liquids characterised by
 $U_m < 0$. In each case, examples of the three-dimensional, asymmetric bubble shape at the onset of instability is also shown. The general trend observed is that for
 $Eo>60$, the magnitude of the critical
 $U_m$ decreases with increasing
 $Eo$ for a fixed
 $N_f$, saturating for large
 $Eo$ and
 $N_f$, beyond
 $Eo \gtrsim 100$ and
 $N_f \gtrsim 60$. For
 $Eo<60$, there is a turning point in the stability map that highlights the fact that an increase in the magnitude of the downward flow velocity is needed to overcome the strong surface tension forces at sufficiently low
 $Eo$; furthermore, the critical
 $U_m$ magnitude increases with
 $N_f$ reflecting the destabilising effect of viscous stresses over this range of
 $Eo$. The results presented in figure 21 are consistent with the trends discussed in the previous sections, and, in particular, those associated with the normalised frontal radius of curvature of the nose,
 $R_F$, presented in § 4; this provides a further indication that the dependence of
 $R_F$ on
 $U_m$,
 $Eo$ and
 $N_f$ controls the linear stability characteristics of the bubble motion.
Stability maps depicting the boundaries demarcating (shown by the full circles) the regions of linear instability in  $(U_m,Eo)$ space (shown by the purple coloured asterisks) characterised by a transition from axisymmetric to asymmetric bubble shapes in downward liquid flow with
 $U_m <0$ for (a)
 $N_f = 40$, (b)
 $N_f = 60$, (c)
 $N_f = 80$, (d)
 $N_f = 100$, (e)
 $N_f = 120$. The dashed lines represent the curves of critical
 $U_m$ for which the axisymmetric base state corresponds to an arrested bubble in downward liquid flow with
 $U_b = 0$.

We also show in figure 21 the curve for the critical  $U_m$ for which the axisymmetric base state has
 $U_b = 0$. It is noticeable that for
 $Eo \gtrsim 100$ for all
 $N_f$ studied, this curve is in the linearly unstable region indicating that bubbles whose motion has been arrested due to a downward flowing liquid over this range of
 $Eo$ and
 $N_f$ cannot have an axisymmetric shape. In contrast, in the complementary range of
 $Eo$, the critical
 $U_m$ curve for such bubbles is outside the unstable region implying that they can sustain an axisymmetric shape despite the downward liquid flow. Examples of these cases have been observed experimentally; see, for instance, the axisymmetric Taylor bubble shown to have been held stationary in downward liquid flow by Nigmatulin (Reference Nigmatulin2001), for
 $N_f = 6087.38$ and
 $Eo = 33.06$. We note that the
 $Eo$ value is within the range of the linearly stable region shown in figure 10(e). Though the experimental
 $N_f$ value is outside of the range we studied, the fact that the linear stability boundaries appear to saturate at large
 $N_f$ suggests that our results can still provide a reasonable indication of the behaviour observed experimentally.
6. Energy budget analysis
In this section, we analyse how energy is transferred from the base flow to the perturbations by studying the growth of the perturbation kinetic energy (Hooper & Boyd Reference Hooper and Boyd1983; Hu & Joseph Reference Hu and Joseph1989). By investigating the contribution of the mechanisms of different physical origin that account for energy production, one can identify the dominant ones that drive instability (Boomkamp & Miesen Reference Boomkamp and Miesen1996). This analysis has been used to study destabilising mechanisms in parallel two-phase flows (Sahu et al. Reference Sahu, Valluri, Spelt and Matar2007; Selvam et al. Reference Selvam, Merk, Govindarajan and Meiburg2007; Sahu et al. Reference Sahu, Ding, Valluri and Matar2009; Ó Náraigh et al. Reference Ó Náraigh, Spelt, Matar and Zaki2011) and their classification (Boomkamp & Miesen Reference Boomkamp and Miesen1996).
6.1. Energy balance formulation
To derive the equation for the growth of the disturbance kinetic energy, one multiplies the continuous forms of the momentum perturbation equations for the velocity components with their corresponding complex conjugates, integrates over the domain, adds the resulting equations and simplifies as appropriate. Our perturbation equations for the velocity components, however, were derived from the weak form of the continuous momentum equations written around the perturbed domain; the development of the weak form of the energy equation must therefore follow the same strategy. Thus, we obtain the energy equation from the derived perturbation equations for the velocity components by setting the test functions for the latter to equal the complex conjugate of the velocity perturbations. Following Boomkamp & Miesen (Reference Boomkamp and Miesen1996), we express the energy balance equation as
 \begin{equation} \dot{E} = REY + DIS + INT, \end{equation}
where  $\dot {E}$ corresponds to the time range of change of the perturbation kinetic energy given by the following relation:
 \begin{equation} \dot{E} = \beta_R\int_{\varOmega^0} \left\{\left| \hat{u}_r \right|^2 + \left| \hat{u}_\theta \right|^2 + \left| \hat{u}_z \right|^2\right\} {\rm d} \varOmega^0\equiv \beta_R KIN, \end{equation}
where  $KIN$ represents the total kinetic energy associated with the perturbation velocity field, which equals
 $\dot {E}$ when multiplied by the growth rate
 $\beta _R$ (which is positive for an unstable flow). In (6.1),
 $REY$ denotes the rate of energy transfer by the ‘Reynolds stress’ (product of two perturbations,analogues to the turbulent Reynolds stress) from the base flow to the disturbed flow, and
 $DIS$ represents the rate of viscous dissipation of energy of the disturbed flow. We also provide a breakdown for
 $INT$, the rate of work done by the velocity and stress disturbances in deforming the interface, (Boomkamp & Miesen Reference Boomkamp and Miesen1996)
 \begin{gather} INT = NOR + TAN, \end{gather}
 \begin{gather}NOR = TEN + HYD + BUB, \end{gather}
which we have decomposed into its normal,  $NOR$, and tangential,
 $TAN$, components with
 $NOR$ further subdivided into
 $TEN$,
 $HYD$ and
 $BUB$, representing work done at the interface against surface tension, gravity and bubble pressure, respectively. Expressions for the energy terms are provided in § 8 of the supplementary information. We normalised the energy terms using
 $KIN$, so the energy balance equation becomes
 \begin{equation} \beta_R = REY^* + DIS^* + TEN^* + HYD^* + BUB^* + TAN^*, \end{equation}
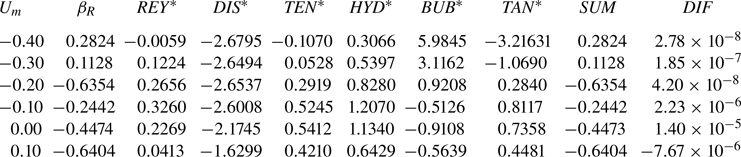
where the asterisk designates the normalisation by  $KIN$. In table 2, we demonstrate for eigenmode
 $m=1$,
 $N_f = 80$ and
 $Eo = 140$, and various
 $U_m$ values, that the difference between the growth rate
 $\beta _R$ on the left-hand side of (6.4) computed from the linear stability analysis and the sum of the energy terms on the right-hand side of (6.4),
 $SUM$, denoted as
 $DIF$ in table 2 is negligibly small. These results inspire confidence in our procedure for computing the terms in (6.4).
Balance of energy distribution among the various energy terms in (6.4) for  $N_f = 80$,
 $Eo = 140$ and mode
 $m = 1$.

6.2. Energy analysis results
From the linear stability analysis results for downward liquid flow presented in § 5, the  $m=1$ mode was identified as being the most unstable one. Here, we examine the contribution of each term in (6.4) in order to elucidate their roles in driving instability and to identify the most dominant destabilising mechanism. In figure 22, the energy analysis results for
 $N_f = 80$ with
 $Eo = 20, 180$ and
 $300$ are shown. These parameter values are chosen to correspond to those used to generate a representative subset of the results presented in § 5. In the discussion below, the asterisk decoration which appears in (6.4) is suppressed for the sake of brevity.
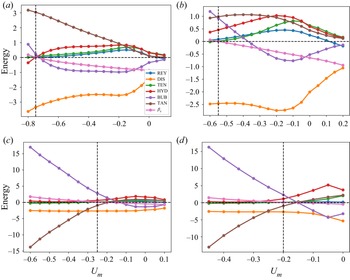
Breakdown of the energy budget for the eigenmode  $m=1$ as a function of
 $U_m$ for
 $Eo=20$, 60, 180 and 300, shown in (a–d), respectively, with
 $N_f = 80$. In each panel, the vertical dashed line marks the
 $U_m$ value for which
 $\beta _R=0$.

It is seen clearly in figure 22(a) that for  $Eo=20$,
 $TAN$ is overwhelmingly the dominant mechanism, followed by
 $BUB$, over the range of
 $U_m$ for which
 $\beta _R > 0$. Over the remainder of the
 $U_m$ range studied in which
 $\beta _R <0$,
 $TAN$ decreases monotonically but remains destabilising while
 $BUB$ becomes stabilising. Here
 $HYD$,
 $REY$ and
 $TEN$ are destabilising over this range while, as expected,
 $DIS$ is stabilising. Upon increasing
 $Eo$ to
 $180$ and
 $300$, as shown in figures 22(c) and 22(d), respectively, the dominant mechanism over the unstable range of
 $U_m$ switches to
 $BUB$ followed in relative dominance by
 $HYD$, which is marginally destabilising, while
 $TAN$ is strongly stabilising. These results suggest that the dominant mechanism depends on the relative significance of surface tension forces. In the case of negligible surface tension, characterised by high
 $Eo$ values, the destabilising mechanism is related to the bubble pressure which indicates that the origin of the instability is in the gas phase. At low
 $Eo$, the instability originates in the liquid phase with the energy provided by the tangential stress component.
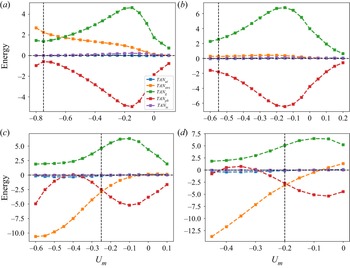
It is instructive to split  $TAN$ energy term into its constituent components based on the base state groups that supply energy to the perturbations,
 \begin{equation} TAN = TAN_{ut} + TAN_{strs} + TAN_{ts} + TAN_g + TAN_{pb}. \end{equation}
The terms  $TAN_{ut}$,
 $TAN_{strs}$,
 $TAN_{ts}$,
 $TAN_{g}$ and
 $TAN_{pb}$ denote the contributions to
 $TAN$ due to streaming tangential velocity, ‘tangential stress’, surface tension, gravity and bubble pressure on the interface as captured by the base state terms
 $\boldsymbol {u} \boldsymbol {\cdot } \boldsymbol {t}$,
 $[-p^0 + 2 N_f^{-1}(\boldsymbol {t} \boldsymbol {\cdot } {{\rm d} \boldsymbol {u}^0}/{{\rm d} s})] + [-p^0 + 2 N_f^{-1} ({u_r^0}/{r})]$,
 $Eo$,
 $z$ and
 $P_b$, respectively. The base state contribution to
 $TAN_{strs}$ is referred to as ‘tangential stress’ since it is due to the double dot product of the stress tensor and the tangential projection operator,
 $( \boldsymbol {I} - \boldsymbol {n} \otimes \boldsymbol {n} )$.
In figure 23, we plot the dependence of the constituents of  $TAN$ on
 $U_m$ for
 $m=1$,
 $Eo=20$, 180 and 300, and
 $N_f=80$. Inspection of figure 23(a) reveals that in the
 $Eo=20$ case, for which surface tension effects are important, the major contributor to
 $TAN$ corresponds to
 $TAN_{strs}$ and exerts a destabilising influence on the bubble motion. As can also be seen in figure 23(a), although
 $TAN_{strs}$ remains destabilising, it gives way to
 $TAN_g$ as the dominant contributor to
 $TAN$ with decreasing magnitude of
 $U_m$, while
 $TAN_{pb}$ is sufficiently stabilising so as to render
 $\beta _R <0$; the contributions of
 $TAN_{ut}$ and
 $TAN_{ts}$ are relatively negligible and they play an insignificant role in the bubble stability.
Breakdown of  $TAN$ for the eigenmode
 $m=1$ into its constituent components given by (6.5) as a function of
 $U_m$ for
 $Eo=20$, 60, 180 and 300, shown in (a–d), respectively, with
 $N_f = 80$. In each panel, the vertical dashed line marks the
 $U_m$ value for which
 $\beta _R=0$.

In figure 23(b,c) generated for  $Eo=180$ and 300 for which surface tension effects are weak, the dominant destabilising contribution to
 $TAN$ is due to
 $TAN_g$ with the subdominant
 $TAN_{strs}$ and
 $TAN_{pb}$ exerting a stabilising influence over the majority of the
 $U_m$ range investigated. The reversal in the role of
 $TAN_{strs}$ as we crossover from relatively low to high
 $Eo$ values shown in figure 23(b,c) is consistent with the results discussed in the previous sections which indicated that viscous effects are destabilising (stabilising) for low (high)
 $Eo$. This is further illustrated in figure 24 in which we plot the breakdown of the energy budget (see figure 24a) and the constituents of
 $TAN$ (see figure 24b) as a function of
 $Eo$ for
 $m=1$ with
 $U_m=-0.2$ and
 $N_f=80$. It is clear that
 $TAN_{strs}$ switches roles in the
 $Eo$ interval
 $( 60,100 ]$ and
 $TAN$ exhibits a similar behaviour over a somewhat larger
 $Eo$ range.


Lastly, we show in figure 25(a) breakdown of the energy budget and of the  $TAN$ constituents as a function of
 $N_f$ for
 $m=1$ with
 $Eo=300$ and
 $U_m=-0.25$. It is seen clearly in figure 14(a) that for this large
 $Eo$ case,
 $BUB$ provides the dominant destabilising contribution with
 $TAN$ and
 $DIS$ inducing stability. Inspection of figure 25(b) reveals that although
 $TAN_g$ is destabilising over the range of
 $N_f$ studied,
 $TAN_{pb}$ is also destabilising for
 $N_f < 60$; this acts to reduce the stabilising effect associated with the increase in viscous effects and reduction in
 $N_f$.


We now establish a connection with the work of Lu & Prosperetti (Reference Lu and Prosperetti2006) who concluded that it is the normal component of gravity on the interface that drives the transition to asymmetric Taylor bubble shape. It is worth mentioning, however, that the analysis of Lu & Prosperetti (Reference Lu and Prosperetti2006) was carried out locally around the nose region under the assumptions that the effects of viscosity and surface tension are negligible. In contrast, our analysis shows that the dominant destabilising mechanisms depend on the relative significance of surface tension characterised by  $Eo$: for low and high
 $Eo$, the tangential stress,
 $TAN$ (with
 $TAN_{strs}$ being the main contributor) and the work done at the interface against the bubble pressure,
 $BUB$, are chiefly responsible for instability, respectively. A look at figures 24(a) and 25(a) shows that the energy term due to normal component of gravity on the interface,
 $HYD$, is an increasing function of
 $N_f$ and
 $Eo$. It is plausible that at very high
 $N_f$ and
 $Eo$
 $HYD$ may overtake
 $BUB$ as the most dominant destabilising energy term. It is therefore likely that the mechanisms governing the instability in regimes of extremely negligible surface tension and viscosity is different from that identified in this investigation.
Finally, it is possible to reclassify the interface energy terms into  $TAN$ or
 $NOR$ based on whether the base state terms that interact with the disturbances are tangential or normal to the interface. In that case,
 $TAN$ only comprises
 $TAN_{ut}$ and
 $TAN_{strs}$ with
 $TAN_{ts}$,
 $TAN_g$ and
 $TAN_{pb}$ added to
 $TEN$,
 $HYD$ and
 $BUB$, respectively, which are part of
 $NOR$. In figures 9–12 of the supplementary information (c.f. figures 22–25 above) it is seen that the dominant energy term that drives instability is
 $HYD$ for
 $Eo > 20$ and switches to
 $TAN$ for
 $Eo = 20$. This mirrors the trend in the base state curvature radius versus
 $Eo$ plot which indicates the existence of a minimum
 $Eo$ in the interval
 $[20, 30)$.
7. Conclusions
We have examined the linear stability of Taylor bubbles in stagnant and flowing liquids in vertical pipes focusing on the case of downward liquid flow. The base state, characterised by constant bubble and axisymmetric shapes, was computed in § 4 as a function of the Eötvös and inverse viscosity numbers,  $Eo$ and
 $N_f$, and the (centreline) speed of the downward flowing liquid,
 $U_m$. A finite element linear stability model was derived using the concepts of domain perturbation and total linearisation method presented in Carvalho & Scriven (Reference Carvalho and Scriven1999) and Kruyt et al. (Reference Kruyt, Cuvelier, Segal and Van Der Zanden1988), respectively.
Our validated linear stability framework was then used to examine the stability of the base states. Our results demonstrated that the leading unstable mode corresponds to  $m = 1$, where
 $m$ is the azimuthal wavenumber of the applied perturbation. We constructed stability maps showing the dependence of the critical magnitude of
 $U_m$ on
 $Eo$, with
 $N_f$ varying parametrically, which demarcate the regions in
 $(U_m,Eo)$ space where the flow is linearly unstable. At low
 $Eo$, for which surface tension effects are significant, the instability targets an undulation in the bottom region of the bubble with the three-dimensional bubble shape exhibiting an asymmetric bulge in that region. For weak surface tension effects, characterised by high
 $Eo$, the most unstable mode corresponds to a deflection of the bubble nose away from the axis of symmetry. The stability maps also show the locus of points for which the bubble are stationary in a downward flowing liquid and highlights the regions in parameter space in which they are linearly stable or unstable resulting in axisymmetric and asymmetric shapes, respectively.
To elucidate the origins of the transition to linear instability and asymmetric bubble shapes, an energy budget analysis was performed to analyse the contribution of various physical mechanisms to the production of perturbation energy. This analysis showed that the major contribution to energy production that drives the instability comes from the bubble pressure and the tangential stress for high and low  $Eo$ values, respectively. The insights gained from the energy analysis, and the trends observed in the linear stability characteristics, were used to establish clear connections to the influence of
 $Eo$,
 $N_f$ and
 $U_m$ on the curvature of the bubble nose, crucial to the flow stability.
Supplementary material
Supplementary material is available at https://doi.org/10.1017/jfm.2022.261.
Funding
This work was supported by the Engineering and Physical Sciences Research Council UK through the EPSRC MEMPHIS (grant no. EP/K003976/1) and PREMIERE (grant no. EP/T000414/1) Programme Grants and for H.A.A. a Nigerian government PTDF-PRESSID scholarship. O.K.M. also acknowledges funding from PETRONAS and the Royal Academy of Engineering for a Research Chair in Multiphase Fluid Dynamics, and the PETRONAS Centre for Engineering of Multiphase Systems.
Declaration of interests
The authors report no conflict of interest.