Legislative turnover can have a dramatic effect on a legislature’s ability to make policy and to represent the public. A low level of electoral turnover, whether at the national or subnational level, implies high rates of incumbency, which may produce legislators who are out of touch and who make policy choices that are inconsistent with the views of their constituents. On the other hand, high levels of turnover can yield too many inexperienced legislators in office, limiting the ability of legislatures to fulfill their duties (Kousser Reference Kousser2004; Matland and Studlar Reference Matland and Studlar2004). Indeed, scholars have long argued that legislative tenure and turnover affect the quality of policy-making, with both high and low levels of turnover associated with poor policy outcomes and low governmental legitimacy (Rosenthal Reference Rosenthal1998).
Although previous studies have identified electoral and institutional factors specific to legislatures that help shed light on patterns of turnover, we argue that the focus on legislatures alone leaves an important gap in the study of legislative turnover. More specifically, the existing literature gives little consideration to how the broader institutional arrangements surrounding a legislature affect turnover. Our goal is to fill this gap. We begin by theorizing that certain types of institutional arrangements within separation of powers systems—in particular, how power and authority are allocated across the legislative and executive branches, along with whether the legislature has the capacity to use this power—can create ambiguous decision contexts in which it is more difficult to assign responsibility for political outcomes. These ambiguous contexts lead voters to cast ballots for incumbents, which in turn reduces the amount of turnover. Based on this theoretical foundation, we analyze whether state-level institutional conditions affect patterns of turnover. Our results and approach demonstrate that to fully understand legislative turnover, we need to consider the broader institutional structure of government.
We evaluate our general argument about turnover using data from the US states, which exhibit a striking degree of variation in the level of legislative turnover. While in some states successful reelection rates hover near 100 percent, in other states incumbents are not so lucky. Why would we observe such high levels of variation across states within the same election year? Our goal is to consider how ambiguity produced by separation of powers arrangements affects these state-level differences in legislative turnover.
Existing literature
Many studies of legislative turnover have focused on the United States, especially on the comparative study of state legislatures. Within this context, numerous studies document how various features of state legislatures affect turnover, with three factors receiving special attention: the type and size of districts, term limits, and legislative structures that affect member behavior. In terms of district-level factors, for example, we have learned that turnover is higher for multi-member districts (Niemi and Winsky Reference Niemi and Winsky1987) and when districts recently have been redrawn (Jewell and Breaux Reference Jewell and Breaux1988). Conversely, turnover decreases as the size of the constituency increases (Crain Reference Crain1977). More generally, some scholars have concluded that electoral factors have a greater overall effect on turnover than other institutional factors (Rosenthal Reference Rosenthal1974).
Term limits also have been shown to affect levels of turnover. Francis and Kenny, for example, observe that “state legislatures with term limits will be loaded with inexperience, ranging from one-third to three-fifths new members each term under eight-year limits, and even greater inexperience under six-year limits” (Reference Francis and Kenny1997, 251). Building on that study, Moncrief, Niemi and Powell (Reference Moncrief, Niemi and Powell2004) demonstrate that although term limits can increase levels of legislative turnover, this effect depends on the length of the term limit and the political opportunity structure within the state.
Other research has focused on the ways in which legislative structures affect the incentives to run for reelection, which then affects the amount of turnover. Some of these studies have focused directly on how institutional characteristics that enhance the attractiveness of office-holding (e.g., salary, opportunities for advancement, etc.) affect turnover rates (Breaux and Jewell Reference Breaux and Jewell1992; Greene Reference Greene1993). Others have placed the role of legislator characteristics (e.g., progressive ambition, quality of challengers) more front and center in explaining turnover, suggesting that institutions affect whether elected legislators have these qualities (Maestas Reference Maestas2000).
Like these studies of the US states, a number of studies of turnover in other contexts—both cross-national and within-country—have similarly examined the combination of electoral effects and the effects of legislative institutions. One study by Matland and Studlar (Reference Matland and Studlar2004), for example, examines the effect of electoral and institutional factors on turnover across 25 countries. Their results point to the importance of electoral factors, while also finding some support for institutional effects.Footnote 1 Heinsohn’s (Reference Heinsohn2014) analysis of German state parliaments shows support for a similar mixture of causal factors. And Samuels’ (Reference Samuels2000) study of turnover in Brazil provides more evidence for the importance of electoral factors, while also showing that political ambition—which is in part a function of legislative institutions—affects levels of turnover.Footnote 2
This body of work has provided many useful insights into the ways that legislative factors—both electoral and institutional—contribute to turnover. Yet at the same time, little consideration has been given to the broader institutional structure of government. Specifically, scholars generally have not considered if and how differences in separation of powers arrangements affect patterns of turnover. The one exception—Heinsohn and Freitag (Reference Heinsohn and Freitag2012)—is noteworthy for its investigation into whether separation of powers arrangements affect patterns of legislative turnover; but their innovative study does not provide a theoretical argument about this relationship.Footnote 3 As a result, their analysis does not explain why separation of powers arrangements might affect turnover or if the relationship is simply a by-product of broader political conditions. Where the study does suggest some explanation for these patterns, it suggests that all responsibility for shifts in turnover is due to the choices that legislators make to seek reelection or exit politics.
The omission of broader institutional considerations from nearly all other studies is significant. At its core, turnover is a function of voter behavior, and the relationship between governmental branches within a state has broad implications for voters. Persson, Roland and Tabellini (Reference Persson, Roland and Tabellini1997), for example, theorize that separation of powers arrangements affect the type of information available to voters, and this information in turn affects voters’ perceptions of legislative accountability. Anderson (Reference Anderson2000) and Rudolph (Reference Rudolph2003a) make a similar point, suggesting that whether individuals hold legislators accountable for various state-level outcomes depends on the clarity with which citizens can identify the politicians responsible for these outcomes. Integrating these ideas, we argue that separation of powers arrangements play a critical role in turnover because they affect informational clarity, which in turn affects legislative turnover.
Effects of ambiguity
Our argument builds from the idea that certain institutional conditions can create ambiguity over outcomes, which then affects how people make voting choices. Ambiguity over outcomes, we argue, can arise from the way different branches of government share responsibility. In a separation of powers system, budgetary decisions—which are the governmental decisions that have the greatest overall effect on fiscal outcomes important to voters (and which, will be the focus of our empirical analyses)—are generally made through a combination of efforts between the executive and legislative branches. Notably, governments vary in the distribution of responsibility across branches. Although in some US states it is clear which branch holds the greatest responsibility over budgetary outcomes, in other states budgetary policy is “a struggle between the executive and legislature in which neither branch ever completely eclipses the other” (Clynch and Lauth Reference Clynch and Lauth1991, 1).
We can classify these differences in separation of powers arrangements as producing higher or lower levels of ambiguity over responsibility for budgetary outcomes. In situations where responsibility for fiscal outcomes can, with relative clarity, be attributed to either the legislature or the executive, there is little ambiguity. In contrast, when the assignment of responsibility is largely uncertain, such that “responsibility for fiscal policy outcomes might legitimately be attributed to either institution” (Rudolph Reference Rudolph2003a, 194), there is a high degree of ambiguity.Footnote 4 We propose that ambiguity is likely to lower legislative turnover.Footnote 5
In general, research suggests that ambiguity in the institutional structure can exacerbate some voters’ natural tendency toward status quo bias, a tendency that occurs because the “disadvantages of change loom larger than its advantages” (Kahneman, Knetsch and Thaler Reference Kahneman, Knestch and Thaler1991, 200). Holding other political factors constant, then, a preference for the status quo is likely to lead people to select incumbents, driving down turnover (Samuelson and Zeckhauser Reference Samuelson and Zeckhauser1988).Footnote 6
These two lines of reasoning both explain how ambiguity can lead to a decrease in turnover. And since some institutional arrangements can produce more ambiguity, such arrangements then can produce these lower levels of turnover. Our central prediction follows from this logic:
Higher ambiguity in separation of powers arrangements is more likely to decrease legislative turnover.
Further considerations
The relationship between ambiguity and turnover forms the main prediction of this article. Indeed, our first step in this analysis is to consider whether the presence of ambiguity can generally influence legislative turnover. Nonetheless, it is possible that the effect of ambiguity on turnover could be especially deflating under certain contexts. Research suggests that ambiguity, regardless of the particular context or conditions, leads to status quo bias. Building on this general relationship between ambiguity and status quo bias, researchers have shown that the influence of this bias during decision-making ebbs and flows (although the bias never disappears) depending on whether a decision follows positive economic outcomes or negative economic outcomes (Kahneman and Tversky Reference Kahneman and Tversky1979; Samuelson and Zeckhauser Reference Samuelson and Zeckhauser1988; Anderson Reference Anderson2003; Rabin and Thaler Reference Rabin and Thaler2001).Footnote 7 In the aggregate, although we anticipate a general effect of ambiguity, economic gains or losses may affect the extent to which an ambiguous institutional setup affects legislative turnover patterns.Footnote 8 Consequently, while our main prediction focuses on the direct relationship between ambiguity and electoral turnover, in a secondary analysis we will consider whether economic conditions also play a role in this relationship.Footnote 9
Capturing ambiguity over outcomes
Our theoretical argument leads to the prediction that separation of powers arrangements will affect turnover by influencing the level of ambiguity. In order to assess this argument, we need to measure ambiguity. Here we explain why ambiguity about responsibility for outcomes is produced by the combination of two conditions.
First, ambiguity over outcomes is likely to increase when responsibility for fiscal policy is unclear. More specifically, institutional conditions in which responsibility for fiscal policy is clear are less ambiguous, while institutional conditions in which responsibility could rest with either branch are more ambiguous. Although we acknowledge that there are many ways to consider the assignment of governmental blame and responsibility, to capture this aspect of ambiguity we rely on budgetary power, which serves as a useful way to approach the separation of powers arrangement. To begin with, the budget is one of the highest profile issues in any democratic polity, affecting voters more than other shared power issues (e.g., appointments). Moreover, the powers and actions of governments regarding the budget have direct, observable effects on the economy. In the US states, for example, legislatures and governors use the budget to influence policy on economic issues like worker training and unemployment benefits (Clynch and Lauth Reference Clynch and Lauth1991; Rudolph Reference Rudolph2003b). The distribution of budgetary power thus provides a useful context in which to assess the relationship between separation of powers arrangements and legislative turnover. Hence, we consider whether power over the budget is divided relatively evenly or unevenly across the elected branches. Cases where power is divided evenly—or balanced—across the branches we categorize as being more ambiguous.
The second component that might increase ambiguity over budgetary outcomes has to do with an institution’s capacity to exercise powers granted to it—which is especially relevant in the context of US state legislatures, given the dramatic differences in capacity across states. Even if institutional arrangements provide the legislature with some power over the budget, not every legislature is capable of fully using this power. Thus, although the formal balance of budgetary power between the executive and legislative branches is the first component in our approach to separation of powers arrangements, the legislature’s ability to counteract the executive’s power is critical. Whether the formal institutional balance between the legislature and the executive creates conditions that will eventually lead to ambiguous outcomes in practice depends on legislative capacity. In the US states, a legislature’s capacity—that is, its ability to use the power allocated to it—depends on its professionalism (McCann, Shipan and Volden Reference McCann, Shipan and Volden2015). By definition, professionalized legislatures have more resources (Fiorina Reference Fiorina1994; Moncrief Reference Moncrief1998), and these resources fundamentally affect the way the legislature relates to the governor (Mooney Reference Mooney1994; Huber, Shipan and Pfahler Reference Huber, Shipan and Pfahler2001; Huber and Shipan Reference Huber and Shipan2002). Put another way, professionalism in itself does not grant institutional power to the legislature, but it might affect the tendency of the legislature to exercise the powers it does have (Dilger, Krause and Moffett Reference Dilger, Krause and Moffett1995).
Putting these factors together, we capture ambiguity through an interaction between budgetary power and legislative professionalism. Specifically, we expect that ambiguity over outcomes is highest in cases where the formal, institutional allocation of budgetary power is balanced and the legislature is professionalized (i.e., capable and willing to use that power). In contrast, when the legislature is not professionalized, increases in the balance of budgetary power should be less likely to produce ambiguity over outcomes, since the legislature is less likely to be able to fully use its available power or to be an equal participant in the budgetary process.Footnote 10 We detail the connection between separation of powers arrangements and ambiguity in Table 1.Footnote 11
Predicted Relationships Between Separation of Powers and Ambiguity Over Outcomes

Empirical analysis
To analyze the relationship between differences in separation of powers arrangements and legislative turnover, we focus on the US states. We start with data collected by Moncrief, Niemi and Powell (Reference Moncrief, Niemi and Powell2004), which covers legislative elections from 1982 to 2000. Building on this data, we compile a data set with the two key components necessary to test our central hypothesis: measures of legislative turnover, and measures of separation of powers. In addition, we also collect measures of economic conditions for our additional analysis.
We base our measure of legislative turnover—our dependent variable—on the Moncrief, Niemi and Powell (Reference Moncrief, Niemi and Powell2004) data, with one major adjustment. Because they use the data to consider the general effect of term limits on turnover, they do not differentiate between non-electoral turnover (i.e., incumbents losing seats due to term limits, retirements, resignations, etc.) and electoral turnover (i.e., incumbents losing seats to challengers in a vote). For our purposes, however, it is important to distinguish between these two types of turnover, since only electoral turnover is a direct product of the voter decision-making that we examine. Therefore, in order to test our theory we adjust the turnover measures to capture only electoral turnover.Footnote 12 We want to note, however, that our results are robust to the original Moncrief, Niemi and Powell (Reference Moncrief, Niemi and Powell2004) measure that includes full turnover. Indeed, using this measure addresses alternative explanations about the relationship between our results and strategic exits from the legislature.Footnote 13
Turnover in the lower and upper chambers of the legislature is considered separately in our dataset, as lower and upper chambers have different careers paths and different rates of reelection. Thus, we have two observations for each state in each year.Footnote 14 For each of these observations, we measure turnover as the percentage of the members in each legislative chamber that changed due to electoral outcomes.
We measure the first of our key institutional factors—balance of budgetary power—using a recent measure that considers a number of different facets of state budgetary control (Krupnikov and Shipan Reference Krupnikov and Shipan2012). This measure has been shown to capture greater variation in budgetary power and to provide a more internally valid approach to the relationship between gubernatorial and legislative responsibility over the budget than previous measures.Footnote 15 We augment the measure to include the relative power of the legislature to override the governor’s veto, changing it from a five-point scale to a six-point scale. We do so because here we explicitly consider the balance of power between the governor and the legislature, and the ability to override a veto directly factors into this power calculus. The scale is a relative measure of power between the legislature and governor, so it captures the institutional capacity of both branches.
As we are interested in identifying cases where power is relatively equal versus cases in which power is not evenly distributed, we use this measure to create a binary variable. We code cases where the governor either has full budgetary power relative to the legislature (i.e., a score of 4 or above on the scale) or very little power (i.e., scores of 2.5 or below) as “unbalanced.” In contrast, we code as “balanced” those states in which the branches share responsibilities. These cases in the middle of the scale feature the conditions that are likely to create ambiguity, provided the legislature has the level of professionalism (i.e., capacity) necessary to respond.
Overall, then, we categorize a governor’s power over the budget as being unequal to that of the legislature (“unbalanced,” coded as 0 in our empirical analyses), or as relatively equal to that of the legislature (“balanced,” coded as 1 in our empirical analyses).Footnote 16 We acknowledge that this dichotomizing of institutional powers simplifies the obviously more complex continuum of gubernatorial-legislator relations. This type of approach, for example, deliberately focuses on the distinction between balanced and unbalanced power, rather than the relationship between the type of power and legislative turnover. It is possible, for example, that more powerful legislatures are more likely to get punished by voters, resulting in higher turnover; or that states with more powerful governors are less likely to experience turnover. Given our predictions and theoretical foundations, however, our goal is to focus on a particular configuration of separation of powers: where the power between branches is balanced and the legislature has the capacity to carry out its role, thereby producing ambiguity. As a result, the dichotomy captures the extent to which a given institutional branch can work independently of the other. Given that we are comfortable assuming that voters will have a general sense of balance rather than a detailed understanding of precisely where institutional arrangements lie on the scale between completely unbalanced and completely balanced, we are confident that this dichotomization provides a helpful proxy for the level of ambiguity in a state government.Footnote 17
We measure our second institutional factor, legislative professionalism, using standard scores drawn from the work of Squire (Reference Squire2000).Footnote 18 We expect to observe that professionalism has differential effects depending on the balance conditions of the government. If it is solely professionalism that is influencing turnover (Brace and Ward Reference Brace and Ward1999), then we should observe that increases in professionalism lead to less turnover regardless of institutional conditions. If, however, what matters is the relationship between the governor and the legislature—captured here by the relationship between balance and professionalism—we should see that the effect of professionalism differs by institutional arrangements.Footnote 19
We also need a measure of economic conditions, first to control for the effect of these conditions on turnover in the test of our main hypothesis, and later to examine whether these conditions interact with ambiguity. The measure we include is the unemployment rate in a state, which often has been used to explain economic conditions (Lewis-Beck and Stegmaier Reference Lewis-Beck and Stegmaier2000) and to capture the effect of state economic conditions on gubernatorial elections (Leyden and Borrelli Reference Leyden and Borrelli1995). Moreover, evidence suggests that individuals view unemployment as a key economic indicator. Kiewiet (Reference Kiewiet1981), for example, finds unemployment to be a strong predictor of vote choice. And Mutz (Reference Mutz1992) argues that media coverage leads many people to form economic expectations based on unemployment levels, even if they have not personally experienced unemployment.Footnote 20
Our unemployment data come from the Bureau of Labor Statistics. In order to speak to the idea of past gains or losses we use this data to create a measure of the change in economic conditions over the previous two years.Footnote 21 A negative value of this measure means that unemployment conditions have improved (i.e., there is less unemployment now than in the past), while a positive value means that economic conditions have worsened (i.e., there is more unemployment now than in the past). Connecting this to our earlier discussion, a drop in unemployment represents economic gains, while an increase in unemployment represents losses.Footnote 22
In addition to these variables, we also control for the adoption and implementation of term limits, redistricting (Moncrief, Niemi and Powell Reference Moncrief, Niemi and Powell2004), and the existence of multimember districts (Niemi and Winsky Reference Niemi and Winsky1987). We also control for other political conditions, such as the partisan climate, the fraction of legislators up for reelection (Moncrief, Niemi and Powell Reference Moncrief, Niemi and Powell2004), whether partisan control of the state government is divided,Footnote 23 and whether it is a presidential election year.Footnote 24
Estimation: balanced government and average turnover
We begin our analysis with a simple test: we pool our data and calculate average turnover by balance of power and professionalism. For this first test, we initially divide our continuous professionalism variable at the median to form categories of lower and higher professionalism. As we suggested in Table 1, the greatest ambiguity—and therefore the least turnover—occurs in cases where balanced power over the budget is paired with highly professionalized legislatures.
The results of this initial test are shown in Table 2.Footnote 25 Later we will conduct more nuanced tests, but this first look at the data, which provides a conservative test of our argument, is instructive for two reasons. First, as expected, we observe that the conditions that produce the highest amount of ambiguity—a balanced power distribution and a highly professional legislature—lead to the lowest turnover. Second, the category with the greatest ambiguity differs significantly from the remaining three categories.
Average Turnover (in %) by Category (All Cases Pooled)

Note: ***p<0.01; **p<0.05; *p<0.1, one tailed.
These differences in turnover are also substantively meaningful. Even if we hold legislative professionalism constant, shifting from a balanced distribution of power to an unbalanced one increases turnover by 3 percent. Given that the average state legislature has just under 150 members (combining both houses), a 3 percent difference means that approximately four or five legislators could lose their seats solely due to the institutional distribution of power in a state. This is substantively significant, as over the past ten years the partisan control in nearly 20 percent of upper houses of professionalized legislatures could have switched due to a loss by just three legislators.
Assessing the main prediction: institutional factors and turnover
The evidence in Table 2 provides an initial test and main prediction. This prediction analyzes the role of ambiguity more generally to consider whether ambiguity affects turnover. We want to analyze this general effect as a baseline, before turning to the possibility that the economy has a conditional effect. To test this prediction with greater precision, we estimate a series of models using ordinary least squares, including controls by year to account for the temporal structure of our data.Footnote 26 Specifically, we estimate the following model:
 $${\rm Turnover}{\equals}\alpha {\plus}\beta _{1} {\rm Balanced}{\plus}\beta _{2} {\rm Professionalism }{\plus}\beta _{3} {\rm Balanced} {\times} {\rm Professionalism}{\plus}{\rm Controls}{\rm .}$$
We expect that more ambiguity will produce less turnover, meaning that the combination of professionalism and balance should have a negative effect on the dependent variable. That is, when the legislative and executive branches are balanced and the legislature has a high level of professionalism, ambiguity should lead to lower turnover (i.e., β 3<0).
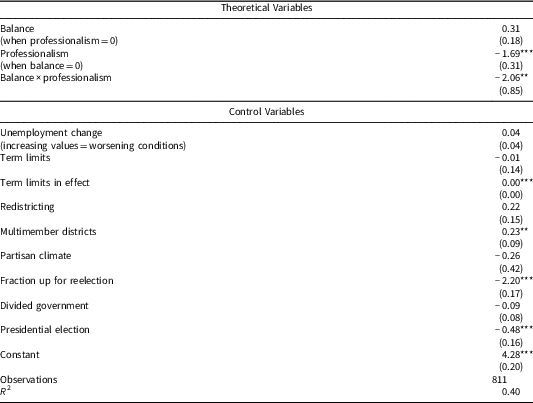
We present the results from our tests of this prediction in Table 3. First, we see that the coefficient on the interaction has the correct sign and a p-value of 0.015. As this is an interaction, the coefficient indicates that under a balanced distribution of power, as professionalism increases (thereby creating more ambiguity over outcomes), the level of electoral turnover decreases. Second, under “unbalanced” conditions (i.e., when Balance=0), increased professionalism generally decreases turnover, which is consistent with previous findings (Moncrief, Niemi and Powell Reference Moncrief, Niemi and Powell2004). We do not find a significant coefficient on balance of power over the budget, which is to be expected, as this coefficient speaks to the role of balance when professionalism is equal to 0, which would be an extremely low level of professionalism. In such cases, ambiguity would be unlikely, leaving balance of power with a minimal effect. Given that no states in our data set have a professionalism score of 0, however, this coefficient holds little direct interpretive meaning. In contrast, the coefficient on the professionalism variable, which represents the effect of increasing professionalism when balance is at 0, offers more direct information.
Effect of Balanced Government on Turnover (1982–2000)

Note: Year dummies included in model, but not shown here. All year effects are significant and positive, with the exception of 1986. The coefficients on these year controls are shown in the Supplementary Information, section 1.
***p<0.01; **p<0.05.
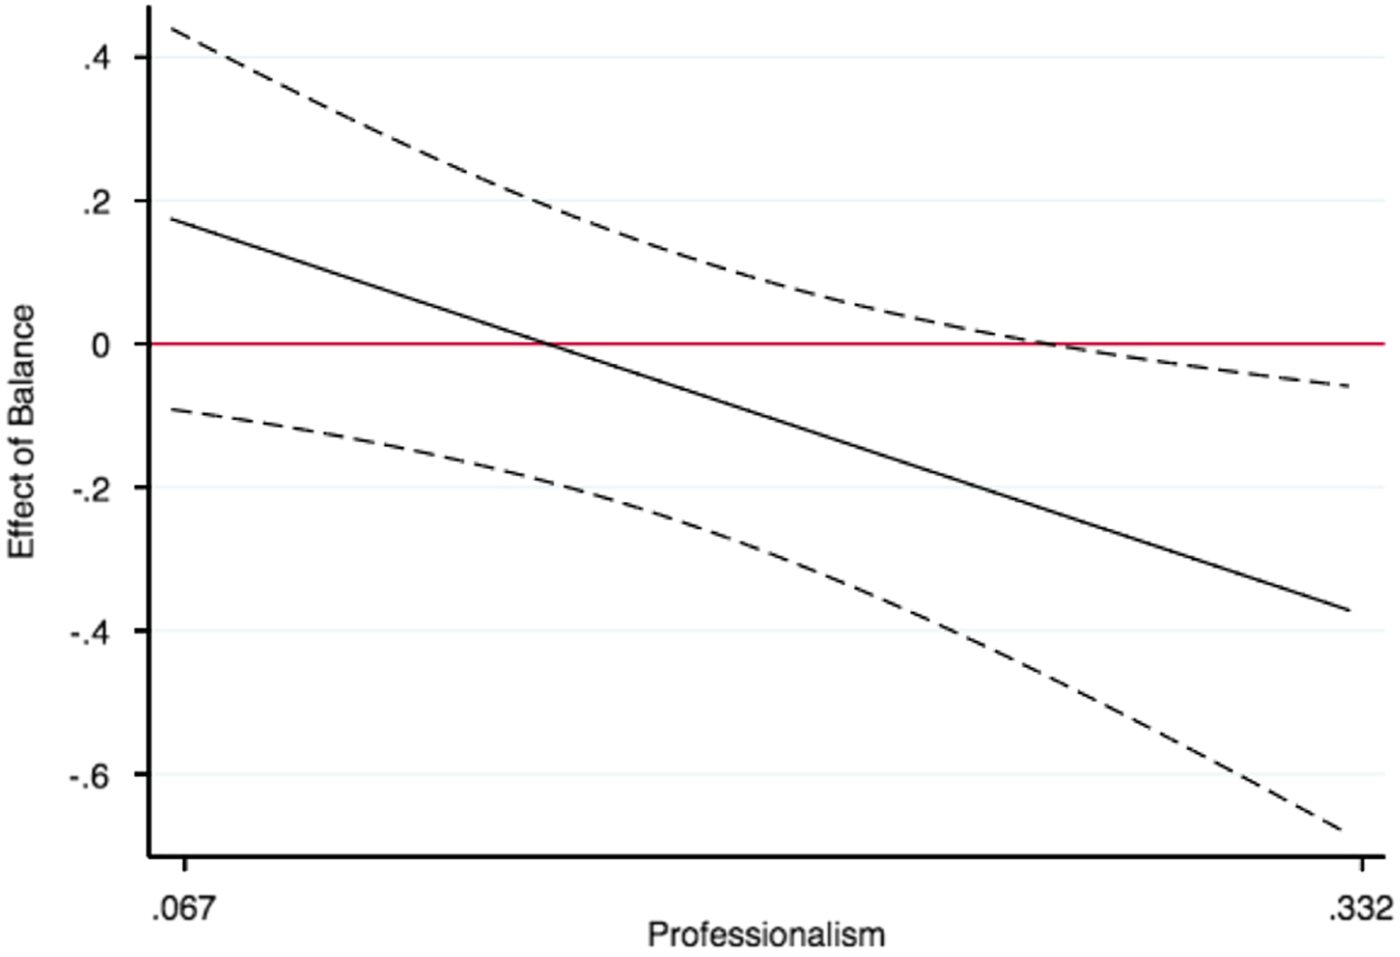
Our theoretic predictions suggest that ambiguity is produced by a joint relationship between balance and professionalism. In particular, we expect that balance should be most likely to lead to ambiguous contexts (and therefore to decrease levels of turnover) in conjunction with high levels of professionalism. Because of the difficulty in assessing the effects of variables in a regression that includes interacted variables, we use our results to create plots that show when the combination of increasing balance and professionalism is most likely to produce ambiguity. Figure 1 shows that although the effect of a balanced distribution on turnover is most often negative, it achieves significance only as professionalism increases, consistent with the argument that these are the conditions that lead to the greatest likelihood of ambiguity. This finding also reinforces the joint role of balance of power and professionalism. Although Berry, Berkman and Schneiderman (Reference Berry, Berkman and Schneiderman2000) suggest that increases in professionalism often can eclipse other institutional and contextual factors that affect turnover, we see a different effect here: the power of governmental balance grows along with professionalism, suggesting the importance of both factors in affecting levels of turnover.
The effect of increasing balance on turnover, as professionalism increases Note: Dashed line represents a 95 percent confidence interval. Effect on y-axis adjusted to percentage points. The x-axis ranges from the 10th percentile to the 90th percentile of professionalism scores; a version of this figure that tracks the effects for the full range of the professionalism variable appears in Supplementary Information Section 12.

Assessing the role of economic factors
Although Table 3 provides support for our main prediction—namely, the idea that separation of powers arrangements that increase ambiguity will lead to lower legislative turnover—we next want to consider whether broader state-level conditions can affect the role of institutional factors. Specifically, as discussed earlier, research on status quo bias suggests that economic conditions could affect the role of ambiguity. Some suggest that losses increase the bias toward the status quo, while others suggest that economic gains increase this type of bias.
This conditional relationship can be investigated by a triple interaction term between institutional balance, professionalism, and economic conditions. We include this interaction term in the following model:
 $$\eqalignno{ & {\rm Turnover}{\equals}\alpha {\plus}\beta _{1} {\rm Balanced{\plus}}\beta _{2} {\rm Professionalism }{\plus}\beta _{3} \Delta {\rm Unemployment}{\plus}\beta _{4} {\rm Balance} {\times} {\rm Professionalism} \cr & {\plus} \beta _{5} {\rm Balance}{\times}\Delta {\rm Unemployment}{\plus}\beta _{6} \Delta {\rm Unemployment}{\times}{\rm Professionalism} \cr & {\plus}\beta _{7} {\rm Balance} {\times} {\rm Professionalism} {\times}\Delta {\rm Unemployment}{\plus}{\rm Controls}{\rm .} $$
Given this model, as unemployment grows (i.e., ΔUnemployment is positive, meaning that there are economic losses), turnover should increase. Further, as ambiguity grows, turnover should generally decrease. At the same time, however, this model will also allow us to consider whether ambiguity is particularly paralyzing following economic losses or economic gains. The estimated model thus allows us to assess whether the combination of balance and higher professionalism produces a level of ambiguity that is particularly likely to reduce legislative turnover during a particular economic period. It is worth emphasizing, however, that if losses exacerbate ambiguity, it should not be taken to imply that it is possible that poor economic conditions benefit legislators. Rather, the implication of this type of result would be that legislators in states with particular separation of powers arrangements are likely to have an easier time weathering an economic downturn.
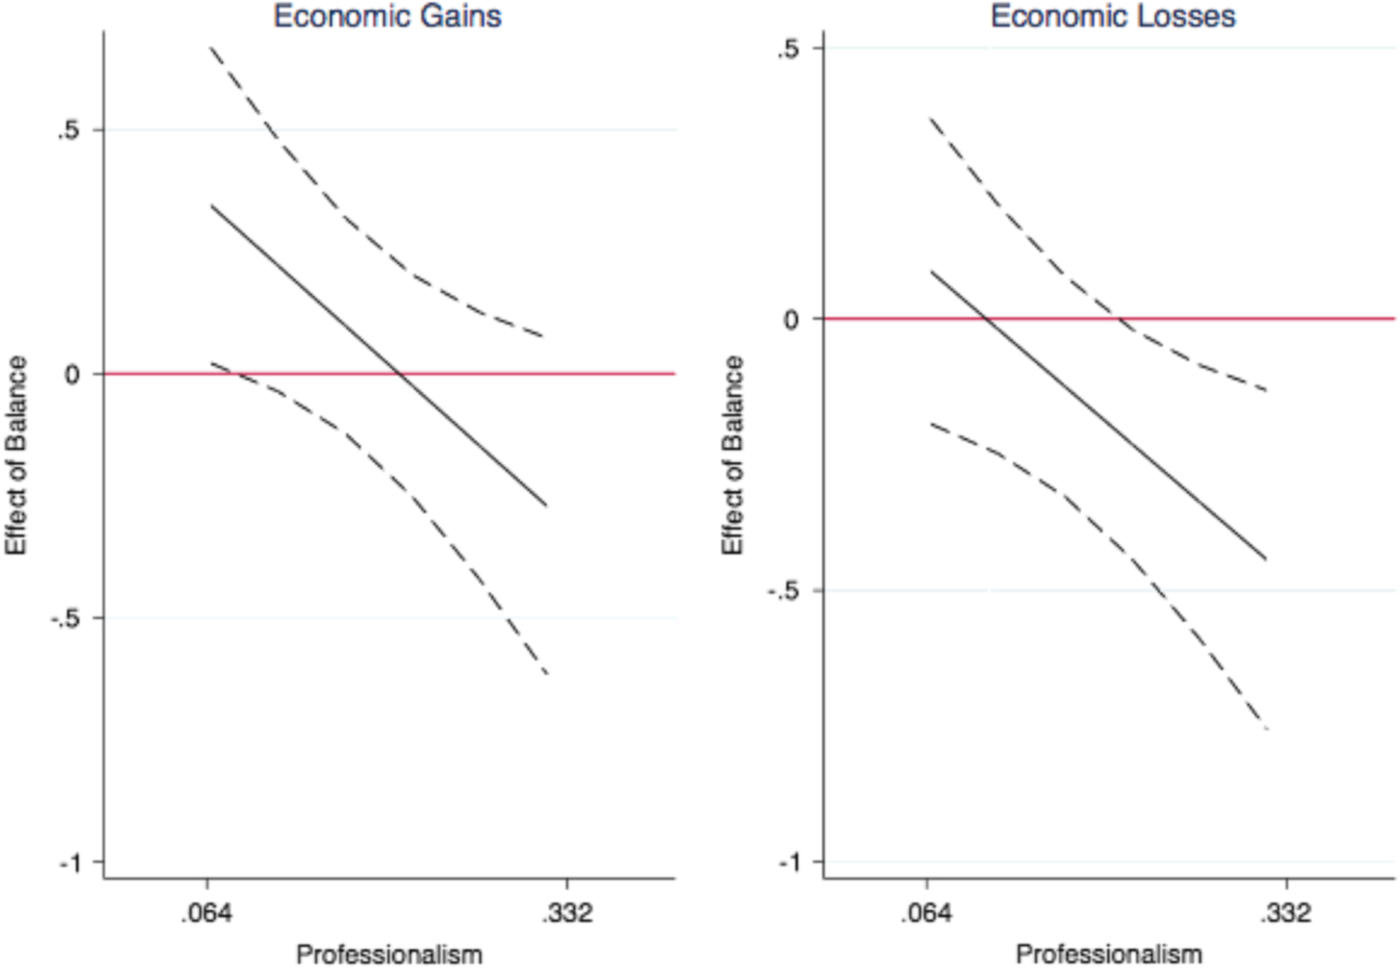
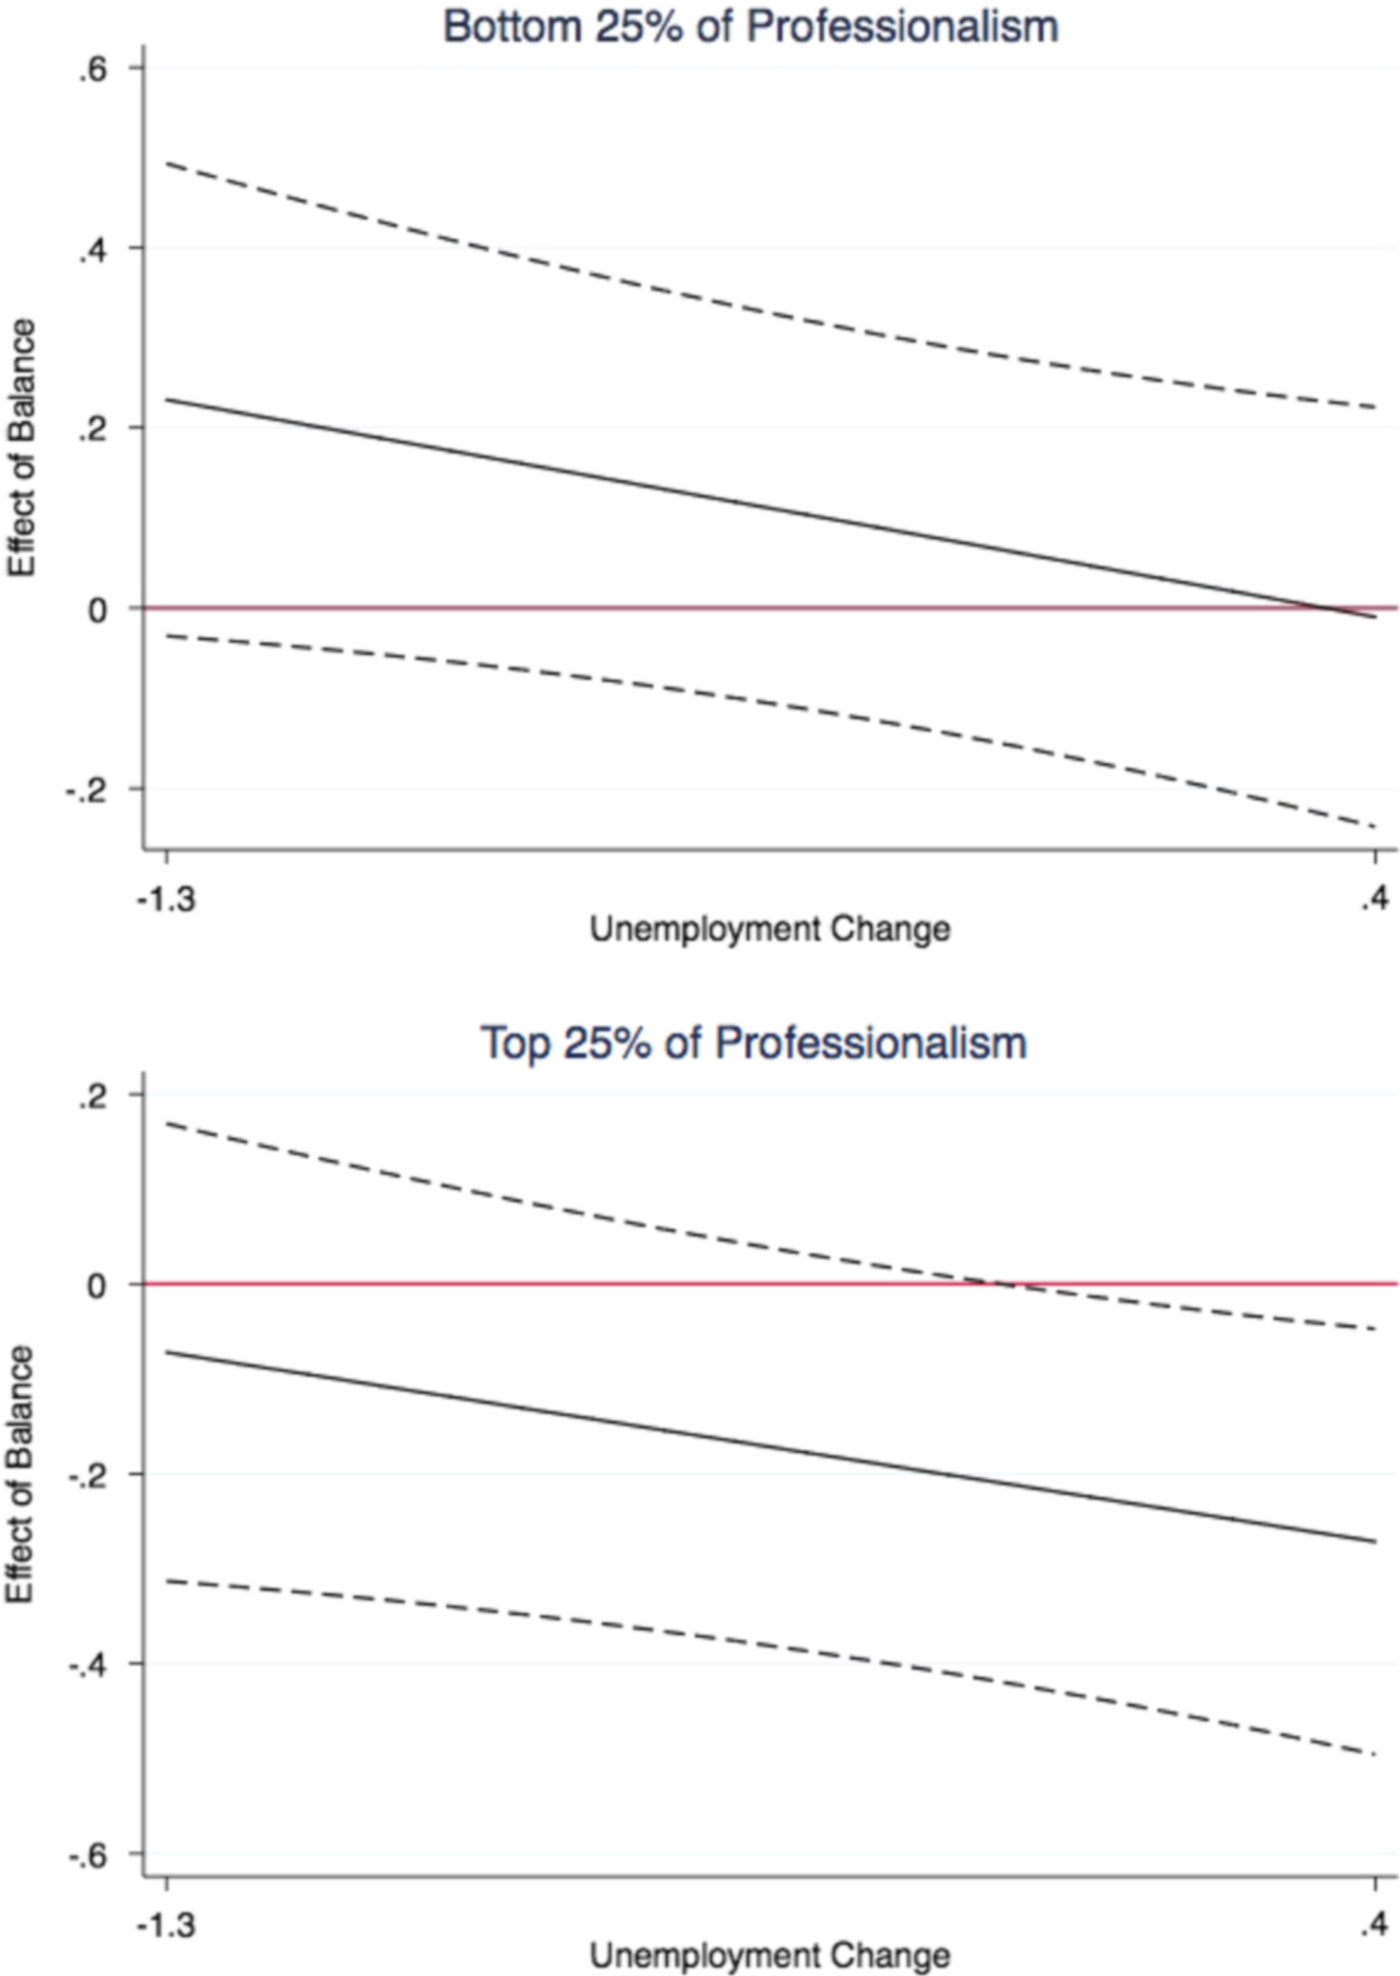
Since it is extremely difficult to draw conclusions directly from the coefficients of a regression involving a triple interaction, we turn straight to a graphical presentation of the effects of our key variables.Footnote 27 We examine these effects using two sets of figures, each of which accounts for economic conditions. More specifically, each of these sets of figures tracks the effect of moving from an unbalanced to a balanced distribution of power, though they present this effect in two different ways, with the panels representing different types of economic conditions (Figure 2) and different levels of professionalism (Figure 3).Footnote 28
Effect of balance as professionalism increases, by economic conditions Notes: Dashed lines indicate 95 percent confidence intervals. “Economic Gains” is a median decrease in unemployment, while “Economic Losses” is a median increase in unemployment. The y-axis represents percentage point changes, while the x-axis ranges from the 10th percentile to the 90th percentile of professionalism scores. A version of this figure that plots the effects across the full range of the professionalism variable is included in Supplementary Information Section 12.

Effect of balance as economic conditions change, by professionalism Notes: Dashed lines indicate 95 percent confidence intervals. The y-axis represents percentage point changes. The x-axis represents the percentage point change in unemployment. The unemployment cut-off points are based on scores at the median of either the decline or growth in unemployment. The categories of professionalism correspond to the x-axis in Figure 2.

We first turn to Figure 2, which tracks the effect of balance as professionalism increases. The economic conditions vary by panel: the left panel represents the effects during periods of economic gains, while the right panel represents the effects during periods of economic losses.Footnote 29 If losses increase the tendency toward status quo bias, we should observe that shifting to a more balanced distribution of power over the budget during times of economic decline leads to significant decreases in turnover when combined with higher levels of professionalism—that is, when ambiguity over budgetary decision-making is high. In other words, we should observe clearer evidence of a decline in turnover in the right panel of Figure 2, which represents conditions of economic losses. In contrast, if economic gains increase status quo bias, we should observe clearer evidence of a decline due to ambiguity over outcomes in the left panel of Figure 2.
We find more evidence for the effect of losses. The right panel of Figure 2 shows that during periods of economic decline, the effect of balance of power on turnover is significant—but only when it combines with legislative professionalism to create ambiguity. More specifically, we see that a shift toward a balanced distribution of power reaches significance at median and high levels of professionalism. At low levels of professionalism, where shifting to a balanced distribution of power is unlikely to lead to ambiguity, the effect of balance does not reach significance. In the left panel, we see that while the effect of balance of power on turnover during periods of economic growth is decreasing in professionalism, it does not reach significance.Footnote 30 Thus, the results show that while ambiguous institutional arrangements—namely, balance and high level of professionalism—lead to a decrease in turnover, they are more likely to do so under conditions of economic losses.Footnote 31
We next use the full range of our economic variable to consider the relationship between balance and turnover in a different way. In Figure 3 we show the effect of balance of power on turnover as economic conditions change. In order to incorporate the effect of professionalism, the two panels in Figure 3 represent different levels of professionalism. The top panel in Figure 3 represents lower levels of professionalism (i.e., the bottom 25 percent of states, in terms of the level of professionalism), which in turn implies low levels of ambiguity even when budgetary power is balanced. Conversely, the bottom panel represents higher levels of professionalism (i.e., the top 25 percent) and, consequently, cases where balanced power could produce ambiguity.Footnote 32
The results suggest a pattern consistent with Figure 2. Once again we observe that the shift in balance has a significant and negative effect on turnover when professionalism is high and during instances of economic losses. Ambiguity, these results suggest, may be more consequential during economic losses than during economic gains.Footnote 33
In sum, our tests provide support for our main prediction, and offer additional insight into the role economic conditions play in moderating the effects of ambiguity. First, our main results show that ambiguity (captured through the interaction of distribution of power and legislative capacity) has a negative effect on turnover. This finding is in line with our argument that institutional ambiguity creates conditions that benefit incumbents. Second, our next set of results suggests that we are especially likely to find such effects during periods of economic losses. Again, we do not mean to imply that such losses are beneficial for incumbents. Rather, the results suggest that incumbents in ambiguous institutional arrangements may have an easier time weathering an economic storm.
Robustness and alternative explanations
In addition to the tests discussed in the main text of this paper, we also conducted numerous robustness checks of our results, as well as tests of alternative explanations. We considered the robustness of our results first by estimating a number of models using additional estimation approaches and model specifications (see Supplementary Information sections 1 and 2). Next, we estimated models that rely on an alternative measure of institutional power compiled by Dometrius and Wright (Reference Dometrius and Wright2009)Footnote 34 (see Supplementary Information section 3) and alternative measures of legislative capacity (see Supplementary Information section 6). We also estimated models that utilize different approaches to accounting for the partisan climate within a state, including measures that capture the extent of ideological polarization (e.g., Shor and McCarty Reference Shor and McCarty2011) (see Supplementary Information section 4).Footnote 35 We estimated models that account for national economic and political factors (e.g., turnover in the national legislature) (see Supplementary Information section 11). Finally, we estimate models that account for gubernatorial capacity (Supplementary Information section 9).
We also considered the alternative explanations of strategic entry and exit into elections. We did so by estimating models that account for the probability of incumbent reelection (Carey, Niemi and Powell Reference Carey, Niemi and Powell2000), as well as models that use the full turnover variable (rather than our adjusted measure of electoral turnover only).Footnote 36 We present these results in Supplementary Information section 7. Moreover, to address this point of strategic entry and exit into campaigns, we also present the joint distributions of our key factors to demonstrate that there is no particular correlation that would suggest that there are simply certain states that are more hospitable to maintaining one’s seat (Supplementary Information section 8).
For each additional specification included in the Supplementary Information we not only show the coefficient estimates for these robustness checks, but also demonstrate the substantive results through a series of figures. Although these different specifications change the types of control variables—and even the number of cases in our models—included in our models, all results reinforce the findings presented above.
Conclusion
Prior research on the institutional determinants of turnover often neglects theoretical considerations about the ways in which separation of powers arrangements might affect legislative turnover. In this paper we directly address this omission. More specifically, we argue that legislative turnover is a function of the broader institutional context of government—namely, the way in which power is distributed within separation of powers structures. Institutional arrangements where power is distributed in a balanced manner, and in which the legislature is capable of responding to the executive, are likely to lead to a decline in turnover due to the ambiguous context they create.
Although in this manuscript we consider the relationship between institutional arrangements and economic conditions using US states, our results have broader implications. Doubtlessly, numerous contextual and individual factors influence an incumbent’s chances of reelection. Yet our results suggest that the effect of these additional factors may depend on the decision context that a separation of powers arrangement creates for voters who are making electoral choices. In sum, a combination of institutional effects and the decision-making behavior of voters leads us to a nuanced conclusion. Although some patterns in turnover may be best explained by institutional structures and some patterns may be best explained by broader political conditions, a more interesting and complete story is what happens when these two patterns of explanatory factors come together.
Supplementary Material
To view supplementary material for this article, please visit http://dx.doi.org/10.1017/psrm.2018.32
Acknowledgements
The authors thank Richard Niemi for sharing the data used in this paper. The authors thank Rob Franzese, Jonathan Katz, Ferram Martinez i Coma, Becky Morton, Marzia Oceno, Spencer Piston, David Smith, seminar participants at Washington University in St. Louis and the University of Michigan, the anonymous reviewers, and the editor for feedback. The authors thank James Strickland for research assistance.