

Introduction
Laryngeal cancer is the most common head and neck malignancy after thyroid cancer. With correct treatment, laryngeal cancer has an excellent prognosis: the five-year survival rate is 60–70 per cent overall, and more than 90 per cent in cases of early glottic cancer.Reference Mendenhall, Werning, Hinerman, Amdur and Villaret1
The most important factor in treatment planning for laryngeal cancer is the accuracy of pre-therapeutic staging, which depends on a combination of radiological imaging and clinical and endoscopic information.Reference Agada, Nix, Salvage and Stafford2 In order to formulate a surgical strategy, it is important to be able to predict the tumour site, extent and likelihood of invasion of the laryngeal spaces and the structures comprising the laryngeal framework, for any given mucosal site.Reference Buckley and MacLennan3 Endoscopic examination is excellent for showing mucosal status, but it has limitations when assessing the exact tumour extension, depth, soft tissue invasion and subglottic extension. Because radiological imaging can enable visualisation of the tumour depth and soft tissue invasion, such imaging supplements endoscopic and clinical information.Reference Phelps4 Although imaging is a useful method of identifying extension into the submucosa and laryngeal cartilage, it is difficult to detect early invasion of adjacent organs or cartilage. Moreover, the accuracy of radiological imaging varies depending on the laryngeal subsite, the radiologist's criteria and the radiological equipment.
There are few published studies comparing the results of radiological imaging with those of histopathological analysis. The purpose of this study was to evaluate the reliability of radiological imaging, compared with pathological results, in determining the need for total or conservative laryngectomy for the treatment of supraglottic cancer.
Materials and methods
Between March 1996 and February 2006, 29 patients with supraglottic cancer who were treated with total or conservative laryngectomy received pre-therapeutic staging according to the results of computed tomography (CT) and magnetic resonance imaging (MRI). There were 25 men and four women, with a mean age of 62.7 years (range, 39–78). All patients had squamous cell carcinoma. Patients who had received previous radiation therapy or laser endoscopic surgery were excluded.
For pathological analysis, specimens were fixed in formalin for three days and decalcified for 14 to 28 days. Horizontal sectioning was performed. Specimens were laid out in sequence and photographed to examine macroscopic patterns of tumour spread. Specimens were then fully sectioned on a sledge microtome and stained with haematoxylin and eosin for microscopic examination. The larynx was divided into separate subunits for the supraglottic area (i.e. base of tongue, pre-epiglottic space, paraglottic space, false vocal fold, medial pyriform sinus and aryepiglottic fold), glottic area (i.e. ipsilateral vocal fold and anterior commissure) and cartilage (i.e. thyroid cartilage, arytenoid cartilage, epiglottic cartilage and cricoid cartilage). Imaging reliability was assessed by comparing pre-operative radiological images and post-operative pathological results. Analyses were performed by a single radiologist and pathologist in order to eliminate interperson variations in interpretation.
Results
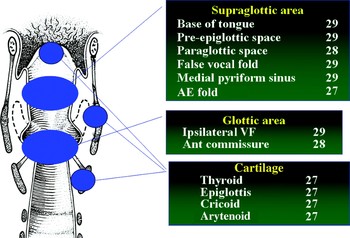
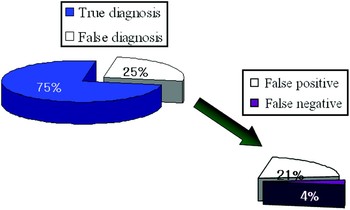
Of the 29 patients, 13 underwent total laryngectomy, seven underwent supracricoid laryngectomy and nine underwent supraglottic partial laryngectomy. For these 29 patients, we analysed pathology slides from a total of 336 subsites. Of the subsites of the supraglottis, analysis of the tongue base, pre-epiglottic space, false vocal fold and medial pyriform sinus was possible in all cases (Figure 1). In addition, analysis was possible for the paraglottic space in 28 cases and for the aryepiglottic fold in 27 cases. Of the glottic subsites, analysis was possible for the ipsilateral vocal fold in 27 cases and for the thyroid cartilage, arytenoid cartilage, epiglottic cartilage and cricoid cartilage in 27 cases. In 84 of the 336 subsites, the imaging results were not in agreement with the pathological assessment of tumour invasion, giving a false diagnosis rate of approximately 25 per cent for radiological imaging. Of these 84 cases, 21 per cent (70/336) were false positive and 4 per cent (14/336) were false negative (Figure 2).
Results of pathological analysis of supraglottic cancer cases. AE = aryepiglottic; VF = vocal fold

False diagnosis rate for radiological imaging: 25 per cent (84/336 subsites).

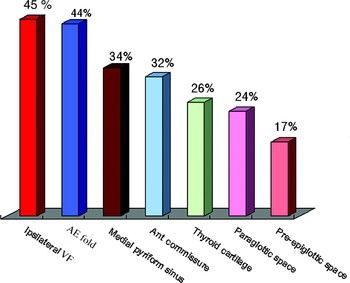
Of the 70 false positive cases, the ipsilateral vocal fold was the most common subsite, followed, in descending order, by the aryepiglottic fold, medial pyriform sinus, anterior commissure (Figure 3), thyroid cartilage, paraglottic space (Figure 4) and pre-epiglottic space. The tongue base and epiglottic cartilage showed no false positive results (Figure 5).
False positive diagnosis of anterior commissure. (a) Axial, contrast-enhanced computed tomography scan at anterior commissure level, appearing to show tumour invasion of the anterior commissure. (b) Photomicrograph of midline sagittal section, showing no tumour invasion of the anterior commissure.

False positive diagnosis of paraglottic space. (a) Axial, contrast-enhanced computed tomography scan at false vocal fold level, appearing to show tumour invasion of the paraglottic space. (b) Photomicrograph of horizontal section at same level, showing no tumour invasion of the paraglottic space.

False positive rate for each laryngeal subsite. The false positive rates for the tongue base and epiglottis were 0 per cent. VF = vocal fold; AE = aryepiglottic

The incidence of false negative results was much lower than that of false positives. Of the 14 false negative cases, the epiglottic cartilage was the most common subsite, followed, in descending order, by the pre-epiglottic space, paraglottic space (Figure 6, 7), aryepiglottic fold and thyroid cartilage. There were no false negative results for the tongue base, ipsilateral vocal fold, false vocal fold, medial pyriform sinus, cricoid cartilage or arytenoid cartilage.
False negative diagnosis of paraglottic space. (a) Axial, contrast-enhanced computed tomography scan at true vocal fold level, appearing to show no tumour invasion of the paraglottic space. (b) Photomicrograph of horizontal section at the same level, showing tumour invasion of the paraglottic space.

False negative rate for each laryngeal subsite. The false negative rates for the tongue base, ipsilateral vocal fold, false vocal fold, pyriform sinus, cricoid cartilage and arytenoid cartilage were 0 per cent. AE = aryepiglottic

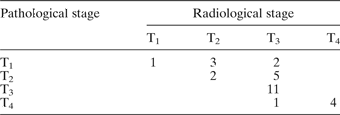
The data for patients' tumour (T) staging are shown in Table I. Three cases of radiological T2 staging were overstaged. The main cause of this overstaging was glottic extension, but two of these cases were corrected by clinical endoscopic examination. Seven cases of T3 staging were overstaged. The main causes of this overstaging were paraglottic extension and pre-epiglottic space extension, so all seven cases of radiological T3 staging could not be corrected clinically. In supraglottic cancer, the most important roles of endoscopic examination were identification of vocal fold invasion and assessment of vocal fold mobility. One case of radiological T3 staging was understaged due to a false negative diagnosis regarding thyroid cartilage invasion (Figure 8). However, this patient underwent total laryngectomy because of subglottic extention.
False negative diagnosis of thyroid cartilage. (a) Axial, contrast-enhanced computed tomography scan at false vocal fold level, appearing to show no tumour invasion of the thyroid cartilage. (b) Photomicrograph of horizontal section at the same level, showing tumour invasion of the thyroid cartilage.

Comparison of radiological vs pathological T staging

Data represent number of staging diagnoses. T = tumour
Discussion
Precise pre-operative information on the degree of tumour invasion is very important for treatment planning.Reference Kwan-Moon, Young-Ho, Jung Il, Myung Sang, Sung Soo and Sang Kyun5 The commonly used technique of CT imaging shows submucosal invasion and very obvious cartilage invasion, but does not show early invasion.Reference Mafee, Schild, Michael, Choi and Capek6, Reference Castelijns, Doornbos, Verbeeten, Vielvoye and Bloem7 In this study, the accuracy of radiological examination using CT and MRI was 75 per cent, lower than that found by Nix and Salvage.Reference Nix and Salvage8 The main causes of this difference are probably a tendency of the radiologist to overstage, and the lower accuracy of imaging mucosal lesions. In addition, our study was limited to supraglottic cancer.
When the stage is overestimated, giving a false positive result, there is an increased likelihood of adopting therapy which is more radical than needed. In supraglottic cancer patients, the true vocal fold and anterior commissure (the most frequent sites of false positive results) are important subsites when determining the need for supracricoid laryngectomy. The most accurate technique for evaluating true vocal fold and anterior commissure invasion is direct laryngoscopic evaluation. However, this is not sufficient to determine submucosal or paraglottic invasion, so radiological examination is helpful in assessing these sites. However, a CT scan needs coronal reconstruction, and MRI has artefacts caused by swallowing and respiration.Reference Becker, Zbaren, Delavelle, Kurt, Egger and Rufenacht9 Due to the high rate of false positive results from CT and MRI, it is necessary to evaluate such radiological results very carefully, and in combination with pre-operative tests such as direct laryngoscopy and endoscopy.
The radiological quality of images of the aryepiglottic fold and medial pyriform sinus is also affected by swallowing, breathing and retained secretions. In particular, as the medial pyriform sinus is normally a closed space, it is very difficult to determine tumour invasion at this site by radiological examination, and it is necessary to perform a biopsy under direct laryngoscopy or Valsalva manoeuvre under flexible laryngoscopy. More extensive surgery than supracricoid laryngectomy is needed when thyroid cartilage invasion is suspected, and total laryngectomy is needed when cricoid cartilage invasion is suspected. Thyroid cartilage invasion is the most common (37.7 per cent) form of cartilage invasion, and usually involves superior-to-inferior invasion from the middle of the cartilage. In 3.9 per cent of cases, there is also cricoid cartilage invasion.Reference Nix and Salvage8 In cases of cartilage invasion, the osteoblastic and osteoclastic reactions are activated simultaneously. As there is a wide variation in the accuracy of determination of laryngeal cartilage invasion by CT scanning, the sensitivity ranges from 46 to 91 per cent and the specificity from 68 to 94 per cent. This variation may be due to differences in diagnostic criteria between radiologists.Reference Becker, Zbaren, Laeng, Stoupis, Porcellini and Vock10 The most definite CT findings indicating cartilage invasion are sclerosis of cartilage and extralaryngeal spread, erosion and lysis.Reference Zbären, Becker and Laeng11 However, sometimes we cannot find tumour invasion in sclerotic cartilage, and we cannot find it in bone marrow invasion without destruction of bony structure and bone trabeculae.
Cartilage invasion is identifiable through signal intensity changes, because of the amount of fat in the bone marrow cavity and the degree of sclerosis and ossification. In MRI, the tumour shows high signal intensity in T2-weighted images and low or iso-signal intensity in T1-weighted images without enhancement, and shows gadolinium enhancement.Reference Loevner, Yousem, Montone, Weber, Chalian and Weinstein12 Since the thyroid cartilage showed a false positive rate of 26 per cent, accurate and careful pre-operative evaluation is needed to prevent overstaging and over-treatment.
The pre-epiglottic and paraglottic spaces are important spaces for tumour invasion, but full evaluation of these spaces is very difficult even with an endoscope. It is necessary to perform supracricoid laryngectomy in cases of tumour invasion of these spaces. Using radiological methods, these spaces are distinguishable as pre-epiglottic fat, paraglottic fat and thyro-arytenoid muscle. In particular, coronal MRI can show the extent of tumour invasion, enabling hyoid bone or tongue base invasion to be easily seen (sensitivity 100 per cent and specificity 84 per cent).Reference Korkmaz, Cerezci, Akmansu and Dursun13 Nonetheless, there is also a high incidence of false positive results due to reactive inflammation or oedema.Reference Nix and Salvage8
• Radiological imaging plays an indispensable, complementary role to endoscopy in the pre-therapeutic assessment of laryngeal cancer
• This study evaluated the reliability of radiological imaging in determining the extent of cancer and surgical resection, by comparing pre-operative computed tomography (CT) and magnetic resonance imaging with post-operative pathological findings
• The commonly used technique of CT imaging shows submucosal invasion and very obvious cartilage invasion, but does not show early invasion
• In laryngeal imaging for neoplasia, the main issues are probably a tendency for radiologists to overstage, and the lower accuracy of imaging mucosal lesions
Since there were no false positive results for the tongue base or epiglottic cartilage, we can reliably evaluate these sites using pre-operative radiological examination.
The epiglottic cartilage was the most common site for false negative results (6 per cent); this was usually because of failure to identify small areas of invasion of the infrahyoid epiglottis. However, this is not especially critical, because the epiglottic cartilage is typically removed in cases of supraglottic cancer.
The pre-epiglottic space, paraglottic space, thyroid cartilage and aryepiglottic fold also showed some false negative results, possibly due to focal invasion not apparent in the radiological examination. Such false negative results may influence the choice of surgical method or cause some tumour to remain if there is undetected invasion in that region, so it is necessary to thoroughly evaluate these regions pre-operatively.
As noted previously, there were more false positive than false negative results. This may be due to radiologists' efforts to reduce false negative results; the error persists when radiologists do not compare their results with those from the histological examination.
Fortunately, tumour invasion of most subsites at risk of false positive diagnoses, such as the true vocal fold, aryepiglottic fold, medial pyriform sinus and anterior commissure, can be easily determined by peri-operative endoscopy or pre-operative endoscopic biopsy. Therefore, clinically, the false positive rate for these subsites will be lower than that found in our study. More interesting, however, are our results for subsites that cannot be examined by pre-operative endoscopy or endoscopic biopsy, such as the thyroid cartilage, paraglottic space and pre-epiglottic space. For these subsites, our results are more useful in informing analysis.
Recently, there has been much interest in conservative laryngectomy. As mentioned earlier, a high frequency of false positive diagnoses results in over-estimation of tumour–node–metastasis staging and therefore over-treatment, including surgery which is more radical than needed. In particular, more accurate radiological examination, pre-operative endoscopic and histological examination, and frozen section analysis are needed in such subsites as the true vocal fold, aryepiglottic fold, medial pyriform sinus, anterior commissure, thyroid cartilage, paraglottic space and pre-epiglottic space.
Conclusion
Radiological examination can be a very useful technique for the evaluation of tumour invasion of cartilage or of adjacent tissue; however, we found that it gave inaccurate results in 25 per cent of cases, predominantly false positive results. More accurate radiological examination, in combination with pre-operative endoscopy, histological examination and frozen section analysis, will enable consideration of more conservative surgery in appropriate cases.
Acknowledgement
This research is supported by Inha University Research Grant.