During the 1800s the United States experienced one of the world's largest declines in fertility. Total female fertility dropped from seven children per woman in 1800 to less than four per woman at the end of the nineteenth century (Degler Reference Dellapena1980). This drop is referred to as the Nineteenth-Century Demographic Transition. Economic and demographic studies have largely focused on the demandside for fertility control during this transition.
This demand-side literature finds correlations between family size and measures such as land availability (Carter, Ransom, and Sutch Reference Craig2004; Degler Reference Dellapena1980; Easterlin Reference Easterlin1971, Reference Easterlin1976a, Reference Easterlin1976b; Easterlin, Alter, and Condran Reference Easterlin, Alter, Condran, Hareven and Vinovskis1978; Forster and Tucker Reference Forster and Tucker1972; Haines Reference Haines and Field1987; Haines and Guest Reference Haines and Guest2008; Steckel Reference Steckel, Goldin and Rockoff1992; Sundstrom and David Reference Sundstrom and David1988; and Yasuba Reference Yasuba1962), population density (Forster and Tucker Reference Forster and Tucker1972; Yasuba Reference Yasuba1962),literacy and education (Carter, Ransom, and Sutch Reference Carter, Ransom, Sutch, Guinnane, Sundstrom and Whatley2004; Degler Reference Degler1980; Easterlin Reference Easterlin1976b; McLaren Reference McLaren1990; Reed Reference Reed1978), or relative wages for women and children (Carter, Ransom, and Sutch Reference Carter, Ransom, Sutch, Guinnane, Sundstrom and Whatley2004; Craig Reference Craig1993; Easterlin Reference Easterlin1976a; Gordon Reference Gordon1976; Guinnane Reference Guinnane2011; Haines and Hacker Reference Haines, David Hacker and Gutmann2011). These correlations provide evidence to support hypotheses about the effect of land availability, the ability to provide bequests, andchanges in relative costs of childbearing on the desire for children. Susan Carter, Roger Ransom, and Richard Sutch (Reference Carter, Ransom, Sutch, Guinnane, Sundstrom and Whatley2004) provides an excellent review of this literature and a forthcoming companion paper discusses these theories in more detail (Lahey forthcoming).
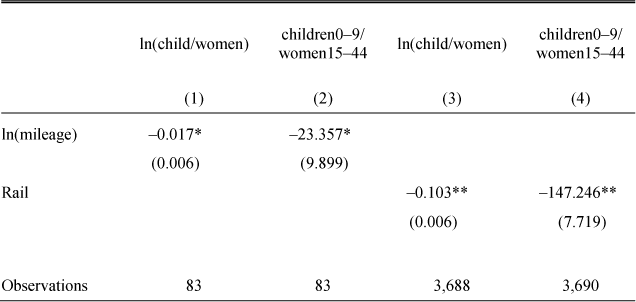
However, many of these same correlations also provide evidence to support hypotheses about the supply side, that is, how people's ability to control fertility changes over this time period. More dense populations provide more ability for word-of-mouth information to spread and support stronger product markets for fertility control, such as midwife and abortion services. Places with a large enough population center might also be included on the rapidly expanding lecture circuit (Degler Reference Degler1980). Population density also correlates with canal and railroad expansion, which facilitated the circulation of written information in the form of newspapers, advertisements, mailorder services, pamphlets, and books.Footnote 1 Higher literacy rates allow people to digest the flow of information. Increased wages for women improve their ability to make use of fertility control services.
Scholars in fields outside of economics have explored the supply side of fertility control technology more thoroughly. Historians, using letters and other print evidence, have pointed out that there has always been a demand for fertility control (Degler Reference Degler1980; Mohr Reference Mohr1978). The nineteenth century provided information and access to abortion and birth control through word of mouth, print literature, lecture tours, and the new catalogue market (Brodie Reference Brodie1994; Mohr Reference Mohr1978; Smith Reference Smith1973; Smith-Rosenberg Reference Smith-Rosenberg1985; Van de Walle and De Luca Reference van de Walle and de Luca2006). A fascinating study on fertility in British factory towns in 1914 suggests that “knowledge [on the question of restriction] is conveyed largely from mouth to mouth, to some extent by advertisement, and occasionally by lecture” (Elderton Reference Elderton1914, p.236), and finds a negative correlation between ease of information spread among women by workplace type and family size.
Some economists have argued that there were no birth control or abortion inventions in the nineteenth century (Degler Reference Degler1980). Indeed, much of the birth control and abortion technology had been invented in Roman times or earlier. The only major fertility control invention in the nineteenth century was the 1844 vulcanization of rubber, which greatly improved the quality of condoms and decreased prices. However, just because the technology had long been invented does not mean that it was available to the average American. Innovation and information transfer played an important role in nineteenth-century fertility, as they did in many spheres during the Second Industrial Revolution.
Data limitations have also hindered research productivity in this area (Haines Reference Haines, Engerman and Gallman1986). Paul A. David and Warren C. Sanderson (Reference David, Sanderson, Engerman and Gallman1986) specifically address the supply side of nineteenth-century family limitation and its “quiet percolation” throughout the nineteenth century, but are restricted to data collection from later time periods, such as the Mosher survey. Economists have also recently explored the effects of birth control and abortion access on fertility and major economic outcomes in the twentieth century (compare Angrist and Evans Reference Angrist, Evans, Polachek and Robst1999; Bailey Reference Bailey2006, Reference Bailey2010, Reference Bailey2012; Donohue and Levitt Reference Donohue and Levitt2001; Goldin and Katz Reference Goldin and Katz2002; Gruber et al. Reference Gruber, Levine and Staiger1999; Levine Reference Levine2004; Myers Reference Myers2012; Pop-Eleches Reference Pop?Eleches2006 and others) and in developing countries (see Guinnane Reference Guinnane2011 for a literature review).
This article documents the diffusion of state laws restricting access to fertility control information, products, and services, specifically those for abortion. It examines the effects of these policies on fertility and finds that fertility rates are higher in states and times when access to this technology has been cut off by state laws restricting abortion. When the costs of obtaining fertility control are higher, people will not limit their fertility as easily as when costs are lower, even holding demand for fertility control constant. Therefore, the fertility ratio will be higher in areas where access to products and information has been cut off by legislative action. This article's estimates that abortion restrictions led to a 4 to 15 percent increase in births are strikingly similar to results on the effects of limited abortion access for modern populations (compare Levine et al. Reference Levine, Staiger and Kane1999; Angrist and Evans Reference Angrist, Evans, Polachek and Robst1999).I am also able to test the effects of various characteristics of the anti-abortion legislation that may have strengthened or weakened the effects of the laws. In particular, I test hypotheses in the literature about the effect of quickening exemptions, finding little to no effect (Degler Reference Degler1980; Dellapenna Reference Dellapena2006; Gordon Reference Gordon1976, Reference Gordon2002; King Reference King1992; Olasky Reference Olasky1992).
This article also addresses the political economy of anti-abortion laws. I test the leading hypothesis offered by James C. Mohr (Reference Mohr1978), which suggests that the fledgling American Medical Association's bid for political power drove the introduction of these laws. I find little support for this hypothesis, suggesting that other forces are at play, possibly those with more similarity to contemporary actors.
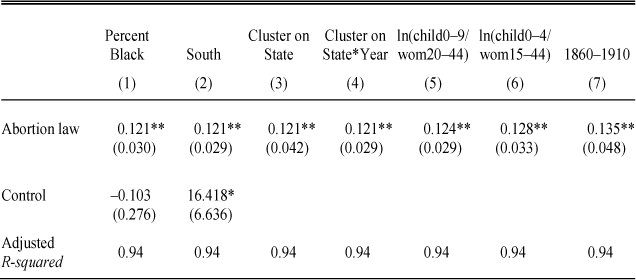
The measured effects of these anti-abortion laws on fertility pass a number of robustness checks. Controlling for anti-birth control laws does not diminish their effect. Potential confounding variables such as fraction immigrant, fraction urban, or fraction literate do not predict these laws. Other morality laws from this time period such as laws against indecency, exhibition, or obscene singing do not predict fertility. Finally, the results are robust to changes in specification and universe.
BACKGROUND
Fertility Control Technology
Nineteenth-century women seeking to abort had a number of options available to them of varying safety and efficacy. They often used herbal remedies before resorting to surgical methods. Some of these herbs, such as cotton root, black or blue cohosh, rue, or savin, were potentially effective abortifacients, and some herbs made women ill enough that their bodies aborted on their own (see, for example, Ernst Reference Ernst2002; Madari and Jacobs Reference Madari and Jacobs2004). Other herbal remedies were not actually abortifacients, but emenogogues that did help regulate menstrual cycles and so gave the appearance of being effective abortifacients. Others were purgatives, causing illness and intestinal problems, or were harmless but useless. These remedies were widely advertised andavailable through mail order until changes in the legal environment in the latter part of the nineteenth century made them more difficult to obtain (Brodie Reference Brodie1994; Gordon Reference Gordon2002; King Reference King1992; Smith-Rosenberg Reference Smith-Rosenberg1985).
As in the early to mid-twentieth century, membrane rupture through the use of metal rods (knitting needles and crochet hooks are reported to have been popular) or sharp sticks was a common surgical method of abortion used by “irregular” abortionists and women themselves. Once the membrane was ruptured, the body would expel the fetus on its own. This method was very dangerous and could easily injure the woman's internal organs if performed incorrectly (Gordon Reference Gordon2002; King Reference King1992).
Dilation and curettage, though invented in ancient Greece, was only reintroduced to the Western world in the 1840s; it became prominent among physicians in the 1860s or 1870s (King Reference King1992). This method, still common today, first dilates the cervix, then uses surgical tools to scrape fetal tissue out of the uterus. Although thought to be safer and more effective than membrane rupture when performed by a trained professional, it can still lead to infection.
We do not know whether abortion or childbirth was the more dangerous option during the nineteenth century (King Reference King1992).Footnote 2 Contemporary observers have made varying claims related to their political agendas (King Reference King1992), and scattered statistics are inconclusive (Degler Reference Degler1980; Gordon Reference Gordon1976, Reference Gordon2002; Mohr Reference Mohr1978; Tribe Reference Tribe1990). The relative danger may have varied over time, as both childbirth technology and abortion technology changed throughout the century. Increases in hospital birthing increased maternal mortality in Europe in the nineteenth century and the United States in the early twentieth century because hospitals introduced more germs than did home births (Loudon Reference Loudon1993). Hospital births did not really become “safe” until the 1940s with the invention of sulpha drugs (McLaren Reference McLaren1990; Thomasson and Treber Reference Thomasson and Treber2008). The germ theory of disease and the spread of dilation and curettage may have made surgical abortions safer, if performed by trained professionals with the appropriate tools. However changes in the legal environment that this article exploits made these safer abortions difficult to obtain in the second half of the nineteenth century.
Doctors began to notice an increase in abortions in the late 1830s and 1840s (Degler Reference Degler1980; McLaren Reference McLaren1990). The most famous abortionist, New York City's Madame Restell, began her practice in 1838. Abortions early in the century were generally sought by poor, unmarried women. The increase in professional abortions, however, drew from married middle-class women (Degler Reference Degler1980; Mohr Reference Mohr1978; Reagan Reference Reagan1991). Two-thirds of abortion cases cited in the medical journals in the second half of the nineteenth century were of married women (Mohr Reference Mohr1978). Mohr (Reference Mohr1978) estimated that there was one abortion for every 25 to 30 live births in the early nineteenth century, but one abortion for every five to six live births in the mid to late nineteenth century.Footnote 3 Some authors estimate as many as one abortion for every four live births (McFarlane and Meier Reference McFarlane and Meier2001; McLaren Reference McLaren1990; Tribe Reference Tribe1990).A study by the 1891 Michigan Board of Health cited one abortion for every three pregnancies, 70 to 80 percent of which were obtained by middle- and upper-class women. It found a 6 percent mortality rate (Gordon Reference Gordon1976, Reference Gordon2002; Smith-Rosenberg Reference Smith-Rosenberg1985). Linda Gordon (Reference Gordon1976) suggests that earlier estimates of the number ofabortions by contemporaries undercounted successful abortions thus overstating death rates. On the other hand, David and Sanderson (Reference David, Sanderson, Engerman and Gallman1986) argue that these numbers are overestimates because they underestimate the natural rate of miscarriage. Sanderson (Reference Sanderson1979) suggests that induced abortion, rather than birth control, accounted for less than one half of all births averted by ever married women.
History of Abortion Laws
Countering the (real or perceived) increase in abortion rates was a rise in laws regulating and prohibiting abortion. However, the first abortion laws did not seem to be aimed at increasing childbearing. Early abortion laws, those beginning in the 1830s and 1840s, were among the first instances of malpractice laws. They regulated who could legally give abortions and punished unlawful abortionists, especially if thewoman died, but they did not punish women seeking abortions (Brodie Reference Brodie1994). Traditionally under British common law, abortions before “quickening,” when the woman could feel movement (generally around 18 to 20 weeks), were not illegal both because the fetus was generally not thought to be alive at that point and because proving pregnancy before quickening was difficult (Degler Reference Degler1980; Gordon Reference Gordon1976, Reference Gordon2002; King Reference King1992). During this time period, many state supreme courts ruled that abortion before quickening was not a criminal offense. Moreover, many of the early state abortion laws were the result of automatic criminal code revisions and were not well-publicized (Brodie Reference Brodie1994). Many others were parts of omnibus laws protecting consumers from dangerous poisons or protecting women in general (Degler Reference Degler1980; Lader Reference Lader1966; Mohr Reference Mohr1978; Polsky Reference Polsky1970).
From the 1860s through 1880s, however, states began to pass more restrictive anti-abortion laws that prohibited information sharing and banned specific practices. For example, they outlawed advertisements, closed loopholes, and made women liable for seeking an abortion. Many of these laws also prohibited abortions before “quickening.”Unlike previous laws, these laws specifically focused on preventing abortion and were not part of omnibus law changes as the earlier laws had been (Degler Reference Degler1980). Although the courts were often sympathetic to women and abortionists, the publicity and questioning during a trial could permanently tarnish a reputation; in many cases, the official investigations and court trials amounted to harassment (Reagan Reference Reagan1991).Footnote 4
Social Movements Towards Restriction
Many theories in the non-economics literature discuss why the more restrictive abortion laws were passed after the 1860s. The American Medical Association (AMA) was the leading force behind anti-abortion legislation. The leading theory on the subject, put forth by Mohr (Reference Mohr1978) and taken up by many others (Brodie Reference Brodie1994; King Reference King1992), is that the fledgling AMA used abortion as a focal point in its fight to distinguish its “regular” doctors from quacks and other “irregulars.”Some historians argue that the AMA had originally tried to use prostitution regulation as their core issue but that effort had failed dramatically and lent strength to their opponents. Abortion better served their purpose (Reed Reference Reed1978).A related explanation is that “regular” doctors believed that the Hippocratic oath disallowed abortions and did not want others practicing abortions if they could not(Mohr Reference Mohr1978). Another, less accepted, theory of AMA involvement suggests that through advancing medical technology of the time, doctors had a better understanding of conception and gestation and viewed fetal growth as a continuous process, rather than one in which life was infused at “quickening,” and felt a moral imperative to prevent abortion (Degler Reference Degler1980). James Reed (Reference Reed1978) suggests that physicians saw each abortion as a lost potential paying customer, especially as well-off middle class women began to be the primary recipients of abortions.
Some feminist historians emphasize that the leaders in both the anti-abortion and anti-birth control movements, such as Horatio Storer and Anthony Comstock, were themselves infertile. This “big man theory” of history is not as outdated as it may sound. Recent modern evidence that legislators who are also fathers are more likely to favor abortion rights if they have daughters (Washington Reference Washington2008) lends plausibility to the argument that nineteenth-century views on abortion were affected by such personal characteristics—that the personal is political. Although untestable, this theory would be exogenous to both law adoption and fertility.
A final nativist theory argues that since white, middle-class women were practicing family limitation in greater numbers, middle-class white men were worried about immigrants and other “undesirables”populating the country (Smith-Rosenberg Reference Smith-Rosenberg1985). This last theory suggests that fraction immigrant could be an omitted variable affecting both anti-abortion law passage and fertility, so it is important to check that immigration does not predict law passage.
DATA
Abortion Laws
I have compiled a comprehensive dataset of state laws regulating abortion from secondary and primary sources. Contemporary activists from both sides of the abortion debate provided snapshots of the laws as they existed at the time (Dennett Reference Dennett1926; Storer Reference Storer1860, Reference Storer1868;Storer and Heard Reference Storer1868). Additionally, historians have compiled lists of these laws for various time periods, and legal scholars have discussed specific laws in depth (Dellapena Reference Dellapena2006; Lader Reference Lader1966; Mohr Reference Mohr1978; Quay Reference Quay1961). I obtained the original laws from the Harvard Law Library's microfiche of superceded state statutes, the University of California, Los Angeles (UCLA) law library's superseded state statutes, Google books, and state law librarians.Footnote 5
In addition to the existence of the law, I coded various characteristics of these laws. These characteristics include laws regarding: obscene supplies (“articles or instruments of immoral use,” such as devices, appliances, apparatuses, drugs); obscene information (any material containing obscene language or images, including information on how to obtain supplies); and laws specifically outlawing information or actions related to “procuring a miscarriage” (abortion). For each law, the dataset codes what share of possible activities it restricted: importing; sale; advertisement; distribution (including circulating or printing information); verbal communication; using the postal service; possession; possession with intent to sell or distribute; or singing.
Each law's severity was also recorded: whether the offense was classified as a misdemeanor or a felony (or left unclassified), as well as the punishment, if specified. Additionally, I coded whether the fetus had to die, and whether the pregnancy had to be “quick” for a crime to have occurred. Exemptions code for each law whether it contained a clause indicating that it did not apply to the following: scientific or medical works or books; medical colleges; practitioners of medicine (which could refer to physicians, nurses, druggists, midwives, etc.); artists and works of art; or activities for saving the life of the mother.
Fertility Rates
Fertility behavior is observed at the level of state by decade. To test the effect of the introduction of laws on childbearing behavior, it would be ideal to have individual birth cohort data by year, in other words the number of children born in each state in 1850, in 1851, etc. Cohort size could then be predicted using an indicator for whether there was a law in place in that state in the year before that cohort was born, when abortion policy would have been in effect. Ideally, there would also be information on individual characteristics of women linked with childbearing, in order to test for differential effects across different groups of women.
Unfortunately, census information on single years of birth is not available for the full sample—the census tables only provide population data by five-year age groups (0–4, 5–9, etc).Footnote 6 Moreover, historicalcensus tables do not provide information on childbearing linked to mothers. Instead, the standard measure of nineteenth century fertility is the child to woman ratio, calculated as 1,000 times the ratio of the number of children aged 0–9 to the number of women of childbearing age, or 15–44 (some authors use ages 20–44 or 20–49). Child to woman ratios were calculated by state-decade from 1830–1920 using tabulated Census data from Haines Census tables in the Historical Statistics of the United States (Carter et al. Reference Carter, Gartner, Haines, Olmstead, Sutch and Wright2006), which are census data cleaned by Michael R. Haines. For the 1880 Census, I replaced the Haines data with collapsed cells from the IPUMS 100 percent sample.Footnote 7 The sample contains white women aged 15–44 (using the Yasuba interpolation for 40–44 year olds from data for 30–39, 40–49, and 50–59 year oldsFootnote 8 ). Figure 1 shows the fertility rate over time using this measure of fertility. This measure captures fertility rate and spacing between children; it is also highly correlated with total fertility (Haines and Hacker Reference Haines and David Hacker2006), but is sensitive to migration and mortality. Richard A. Easterlin (Reference Easterlin1976a), Timothy W. Guinnane (Reference Guinnane2011), Haines and J. David Hacker (Reference Haines and David Hacker2006), Stewart E. Tolnay, S. N. Graham, and Avery M. Guest (Reference Tolnay, Graham and Guest1982), and Yasukichi Yasuba (Reference Yasuba1962) provide more thorough discussions of the nature and limitations of these measures.
FERTILITY RATE BY DECADE

Methodology
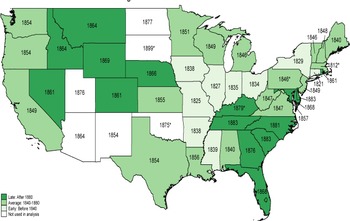
To examine the impact of abortion restrictions on the number of children born, I exploit the quasi-experiment provided by the variation across states in the timing of passage of laws prohibiting abortion (shown in Figure 2).Footnote 9 I limit analysis to the period from 1850 forward for several reasons. First, many states did not exist before 1850 and did not have state law books. Second, two phenomena occur in the nineteenth century: an increase of technology and information transfer in the first half of the century, and a legal brake on this flow in the second half. Whereas early abortion laws tended to focus on malpractice and may have actually made abortions safer for the women seeking them, later laws made abortions more dangerous and difficult to obtain. I exclude states that did not exist before 1890; most of the states gaining statehood between 1850 and 1890 collected law and population information while territories. I also exclude the Dakotas because the states do not collect population information separately in the early decades.Footnote 10
TIMING OF FIRST ABORTION CONTROL STATUTE

The relationship between a law passed in a given year and the number of children born the next year cannot be identified becauseindividual year measurements are not available in the census tables, and the standard measure used is ten-year fertility ratios. To capture the fact that a law passed between censuses affected only those pregnancies thatbegan afterward, I created a measure of the fraction a decade the law was in place. For a law to be relevant to the cohorts of children aged 0 to 9 in 1880, the law must have been passed before the 1880 Census. A law passed in 1877 was relevant to those children born in 1878 and 1879, as well as the children born at the end of 1877 and those born at the beginning of 1880—that is, it was relevant for roughly 30 percent of the children who were aged 0 to 9 in the 1880 Census. Therefore such a law is coded as 0.3 for the decade ending in 1880. I code a law passed in 1870 or earlier with an indicator value of 1.0 for the decade ending in 1880. If a state did not have a law for any of the period 1870–1879, the indicator has a value of 0 for the decade ending in 1880. Details of the laws, such as restrictions, were coded by decade in a similar fashion.Footnote 11
The empirical specification is as follows

where F ds represents alternative measures of ten-year fertility in decade d in states, and law dsis a continuous indicator variable ranging in value from 0 to 1 that reflects the share of the decade for which a state has a law restricting abortion. Controls Xds include continuous indicator variables reflecting decade share for characteristics of the anti-abortion laws as well as related birth control laws and their characteristics. State-specific (δ s ) and decade-specific (δ d ) fixed effects are included to capture longstanding differences in fertility patterns across states and aggregate patterns of changing fertility preferences over time. In some specifications, I also allow the state-specific differences to trend linearly by including an interaction between δ s and decade d. The coefficient β 1 measures the difference in ten-year fertility between states for which a law was in effect for the entire decade (law ds = 1) and states for which a law was never in effect in that decade (law ds = 0). In some specifications,F ds is measured as the level of the child to woman ratio, and in others as the log of that ratio. When using the ratio itself, β1 represents an estimate of the change in the child to woman ratio; when using the logged ratio, β1 represents the percent change in childbearing.
ABORTION PROHIBITIONS AND FERTILITY

** = Significant at the 1 percent level.
Notes:
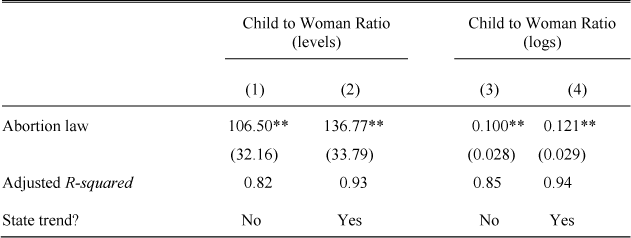
Robust standard errors are in parentheses. Regressions report the results from equation 1, the effect of a state having an abortion law on the child 0–9/women 15–44 ratio * 1,000 including state- and year-fixed effects. The base value of the child-woman ratio is ~1,100. Years included are 1850–1910 and states include all states extant before 1890 for which population information is available, excluding the Dakotas. State trend is a state-specific linear time trend. There are 291 observations.
RESULTS
Main Results
The results of OLS estimates of equation 1 are shown in Table 1. Log and level regressions give similar results. Estimates suggest that laws restricting abortion led to an increase of between 106 and 137children born over a decade per 1,000 women, or a 9 to 12 percent increase in the child to woman ratio from a base of about 1,100 on average. Similarly, the log results suggest a 10 percent to 12 percent increase. The preferred specification is that in column 4, with a full set of state- and year-fixed effects and state trends, suggesting a 12 percent increase. These results are statistically significant at conventional levels.Footnote 12
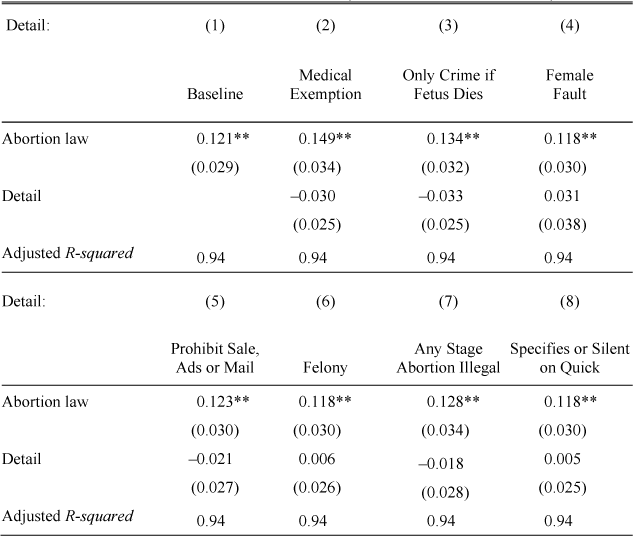
Table 2 tests different aspects of these laws that may have strengthened or weakened their effects. The effect of a medical exemption on fertility is signed as expected and is not significant, however it raises the effect of having an abortion law on fertility to an increase of 15 percent. This variable indicates either that an abortion is legal if there is a therapeutic exception to save the life of the mother or child, or that physicians and medical tests are exempt from the law. Controlling for laws that stipulate a crime is committed only if the fetus dies also strengthens the impact of having an anti-abortion law to 13 percent. With this exception, a woman can seek an abortion or a practitioner can attempt to perform one without being prosecuted. Because early abortions with abortifacients are difficult to detect as abortions, the law essentially allows early abortions prior to quickening as had been allowed by common law. Holding the female at fault increases fertility, but not significantly so, and controlling for female fault does not change the effect of having a law. However, this result should be interpreted with caution as only a few laws deem the female at fault. Prohibiting sale, ads, and mailing of abortion information does not seem to affect fertility beyond the effect of the original law.Footnote 13 Classifying abortion as a felony seems to have no impact on the law; judges and juries were generally sympathetic to abortion cases in terms of finding fault and sentencing, but the true penalty for those accused came from the publicity associated with the trial (Reagan Reference Reagan1991).Footnote 14
ABORTION PROHIBITIONS AND LN(CHILD TO WOMAN RATIO)

** = Significant at the 1 percent level.
Notes:
Robust standard errors are in parentheses. Regressions report the results from equation 1, the effect of a state having an abortion law on the log of children age 0–9 /women age 15–44 * 1,000. Years included are 1850–1910 and states included are all states extant before 1890 for which population information is available, excluding the Dakotas. All regressions include state- and year-fixed effects and a state-specific linear time trend. There are 291 observations.
One controversy in the literature is about the effects of the legality of abortion prior to quickening. Mohr (Reference Mohr1978) holds that the change in legality of abortions prior to quickening is important and makes the laws more restrictive. Later and openly pro-life scholars (for example, Dellapenna Reference Dellapena2006; Olasky Reference Olasky1992) disagree, arguing that abortion before quickening was always prohibited. Charles R. King (Reference King1992) takes a more pragmatic view and argues that physicians could not determine pregnancy prior to quickening. Columns 7 and 8 in Table 2 examine the effect of law characteristics restricting abortion prior to quickening and find no effect. This null result suggests that how laws treated quickening was not important in the nineteenth century.
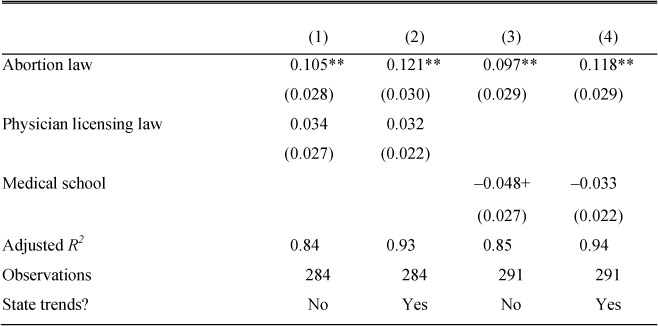
I examine another Mohr hypothesis, specifically the relationship between AMA strength and passage of anti-abortion legislation. Figure 3a provides a scatterplot with the date of a physician licensing law (Law and Marks Reference Law and Marks2009) on the x-axis and year of first anti-abortion law on the y-axis. Mohr's thought would be that an upward slope would indicate a positive relationship between physician political power and passage of anti-abortion laws. There appears to be no such effect. Figure 3b uses a different measure of physician power, the year that the first medical school was created in the state (U.S. Bureau of Education 1898).Footnote 15 This figure shows an upward trend suggesting a relationship worth exploring. Table 3 shows the standard regression including whether or not a state has a physician licensing law in columns 1 and 2 or a medical school in columns 3 and 4. The absence of an effect of physician licensing law is borne out in the first two columns. Column 3 suggests that having a medical school may impact the effect of an anti-abortion law; however, that effect goes away once state-specific time trends are controlled for as in column 4. Thus physician strength does not seem to be related to law passage or the effect of anti-abortion legislation. However, the measures of physician strength are crude and better measures may yield an effect.
ABORTION LAWS AND PHYSICIAN LICENSING

ABORTION LAWS AND MEDICAL SCHOOLS

ABORTION PROHIBITIONS, LN(CHILD TO WOMAN RATIO), AND THE MOHR HYPOTHESIS

+ = Significant at the 10 percent level.
** = Significant at the 1 percent level.
Notes:
Robust standard errors are in parentheses. Regressions report the results from equation 1, the effect of a state having an abortion law on the log of children age 0–9 /women age 15–44 * 1,000. Regressions include state- and year-fixed effects. Years included are 1850–1910 and states included are all states extant before 1890, excluding the Dakotas for which population information is available. Licensing information for Washington DC is missing in columns 1 and 2. All regressions include state dummies and year dummies.
Robustness Checks
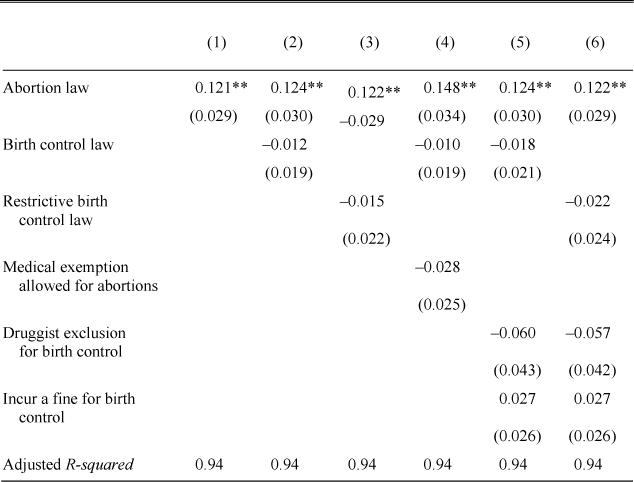
Caitlin K. Myers (Reference Myers2012) finds that it is important to control for the characteristics of abortion laws to determine the effect of birth control laws in the twentieth century, suggesting it may be important to control for the characteristics of birth control laws to determine the effect of abortion laws in the nineteenth century. In my sample, laws restricting abortion are positively correlated with those restricting birth control (correlation is 0.47).Footnote 16 Putting the two types of fertility restriction laws together as in Table 4, controlling for birth control laws does not change the effect of having an abortion law. Different methods of measuring birth controllaws also do not seem to affect the impact of an abortion law on fertility.
ABORTION AND BIRTH CONTROL PROHIBITIONS ON LN(CHILD TO WOMAN RATIO)

** = Significant at the 1 percent level.
Notes:
Robust standard errors are in parentheses. Regressions include state- and year-fixed effects and state-specific time trends. Years included are 1850–1910 and states included are all states extant before 1890 for which population information is available excluding the Dakotas. There are 291 observations.
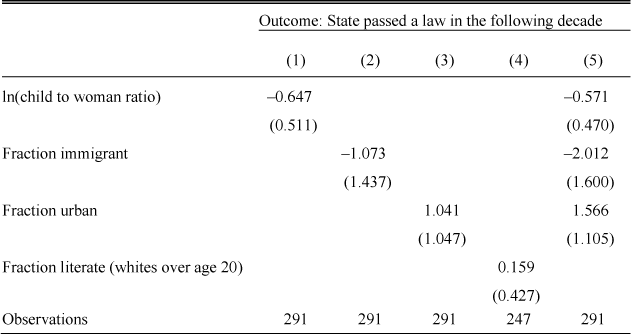
Reverse causality is an important concern. If, rather than childbearing patterns changing in reaction to laws, in fact the passage of laws reflected legislative reaction to changes in childbearing, then these estimates could not be interpreted as the effects of changes in access to fertility control. The falsification check shown in Table 5 tests for this possibility; I attempt to predict the passage of a law in the next decade using the child to woman ratio in the current decade. These tests find no consistent or statistically significant relationship between fertility and subsequent passage of a law in any specification, as shown in column 1.
PROBABILITY OF AN ABORTION LAW

Notes:
Robust standard errors are in parentheses. Regressions report the results from equation 1 for the probability that a state passed a law in the following decade. Years included are 1850–1910 and states include all states extant before 1890 for which population information is available excluding the Dakotas. Regressions include state- and year-fixed effects, and a linear state trend.
Another important concern is that an omitted variable both causes the laws to be introduced and affects fertility. Table 5 shows no evidence for an effect of the fraction of the population that is immigrant, the fraction that is urban, or fraction of white people over the age of 20 who are literate, on the probability that a law passed in the next decade, as demonstrated in columns 2–4 respectively.Footnote 17 Note also that the results on percent immigrant are counter to the hypothesis (insignificant and opposite signed) that the threat of increasing immigration primarily drove adoption of these laws, as suggested by Carroll Smith-Rosenberg (Reference Smith-Rosenberg1985).
OTHER MORALITY LAWS AND LN(CHILD TO WOMAN RATIO)

* = Significant at the 5 percent level.
Notes:
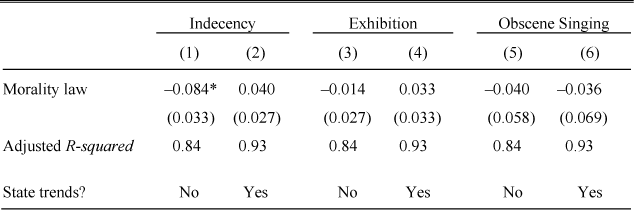
Robust standard errors are in parentheses. The dependent variable in columns is the log of children age 0–9 /women age 15–44 * 1,000. Years included are 1850–1910 and states include all states extant before 1890 for which population information is available excluding the Dakotas. Regressions include state- and year-fixed effects. There are 291 observations.
Another worry is that these laws prohibiting abortion are merely symptomatic of changes in social mores that themselves affect fertility. Therefore, I collected information on legislation that prevented obscene singing, something that should be correlated with social mores, but presumably would not affect fertility directly. I also used data from William N. Eskridge (Reference Eskridge1999) on state laws banning public indecency and public exhibition which should be similarly correlated with social mores but should not directly affect fertility.Footnote 18 Table 6 shows that each of these laws has a negative effect on ln(fertility) in specifications without a state-specific time trend. Indecency laws are significant at the 5 percent level in column 1 but this significance disappears and the sign flips once a state-specific time trend is accounted for. Exhibition laws show a similar sign flip from column 3 to 4. Obscene singing laws remain negative and insignificant in both column 5 and 6. The findings in the article do not seem to be the effects of changing social mores.Footnote 19
DISCUSSION AND CONCLUSION
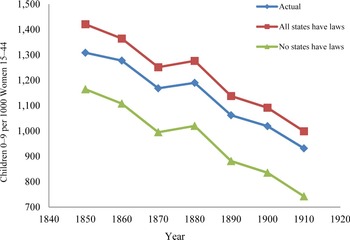
As a test for the full effects of access to fertility control during the Nineteenth-Century Demographic Transition, the measured effects of laws prohibiting abortion are imperfect. Legislation against abortion does not completely eliminate access to abortion, and lack of legislation does not guarantee access, nor does the legislation capture the technological changes in access that it is fighting against. However, the counterfactual experiments of decreasing or increasing access based on these laws can still provide information about what population would have been had the legislation not existed, or had all states had the most restrictive laws during this time period. Figure 4 plots these counterfactuals for the child to woman ratio as the dependent variable using the specification in Table 2, column 2 and adding total population weights by state. The top line shows the predicted fertility if all states had anti-abortion laws without medical exemptions. The bottom line shows the predicted fertility if no states had laws (and for mechanical purposes of prediction, that they have medical exemptions). In the absence of laws, fertility would have been 11 percent lower in 1850 and 20 percent lower in 1910. If all states had the most restrictive laws, fertility would have been 8.6 percent higher in 1850 and 7.2 percent higher in 1910.
ACTUAL AND PREDICTED FERTILITY BY DECADE

The estimates in this article are consistent with research on recent (1970s-era) changes in legal access to abortion and birth control, which find effects from 5 percent for the overall population to 15 percent for groups that are particularly likely to want to decrease childbearing (for example, poor women, teenagers) (Ananat and Hungerman Reference Ananat and Hungerman2012; Levine et al. Reference Levine, Staiger and Kane1999).Footnote 20 The consistency of the birthrate response to restrictions on fertility control is remarkable particularly because of the lower efficacy and higher risks associated with nineteenth-century methods of abortion. These results suggest that demand for increased fertility control, specifically abortion, has been persistent since the nineteenth century, rather than being a recent social development driven by shifting gender roles or increased labor market opportunities. The flow and eventual cutting off of information and product availability for fertility control did have real effects on fertility rates in the nineteenth-century United States. Using laws restricting abortion as a source of variation in availability, results show that reducing the availability of abortion increased fertility rates in the nineteenth century. These estimates of the effects of abortion access are similar to those found in more recent times. This research suggests that when studying the nineteenth-century U.S. demographic transition, explanations based on supply factors cannot be neglected relative to those based on demand.
Appendix
EFFECT OF RAILROADS ON POPULATION

SPECIFICATION CHECKS

NUMBER OF BOOKS PER YEAR, 1830–1918