Introduction
Tomato (Solanum lycopersicum, 2x= 2n= 24) is an important vegetable crop throughout the world. It is the second most consumed vegetable after potato (FAOSTAT, 2005). As an economically important crop, significant research attention and breeding efforts from both private and public sectors have led to the development of a considerable number of improved varieties. Major emphasis of these programmes has been on fruit quality characteristics including firmness and size, disease resistance and towards increasing yield on a per acre basis. However, tomato flavour has not been of major concern of breeding programmes and, consequently, many of the modern varieties lack the distinctive flavour that consumers associate with fresh garden-grown heirloom varieties.
In order to combine flavour with other desirable fruit traits in improved cultivars, it is important to determine how much variability exists in the crucial compounds that contribute most to flavour. Previous research has identified reducing sugars, organic acids and plant volatiles (Abegaz et al., Reference Abegaz, Tandon, Scott, Baldwin and Shewfelt2004; Krumbein et al., Reference Krumbein, Peters and Bruckner2004). Fructose and glucose are the major forms of sugar and citric acid is the dominant acid in ripe fruit, whereas malic acid is also available to some extent (Davies and Hobson, Reference Davies and Hobson1981). The volatile compounds are involved in tomato flavour and synthesized from a diverse set of precursors including amino acids, lipids and carotenoids (Tamura et al., Reference Tamura, Dudley, Nei and Kumar2007). It is the specific combination, ratio and interaction of these compounds that produces what we ultimately refer to as flavour.
Although the importance of these components in influencing flavour has been reported in the literature (Bezman et al., Reference Bezman, Mayer, Takeoka, Buttery, Ben-Oliel, Rabinowitch and Naim2003; Krumbein et al., Reference Krumbein, Peters and Bruckner2004; Davidovich-Rikanati et al., Reference Davidovich-Rikanati, Sitrit, Tadmor, Iijima, Bilenko, Bar, Carmona, Fallik, Dudai, Simon, Pichersky and Lewinsohn2007; Ercolano et al., Reference Ercolano, Carli, Soria, Cascone, Fogliano, Frusciante and Barone2008; Vogel et al., Reference Vogel, Tieman, Sims, Odabasi, Clark and Klee2010), their relative contributions with respect to each other have not been investigated. Ultimately, a subjective taste test score is required using a taste test panel and regressed on the estimated concentrations of the multiple components. This is because consumers are the ones to determine whether any tomato is flavourful or not. Therefore, their unbiased ratings are important to identify the accessions with a high level of flavour.
Evaluating a representative sample of the available accessions is the first step in any crop improvement strategy. Ercolano et al. (Reference Ercolano, Carli, Soria, Cascone, Fogliano, Frusciante and Barone2008) screened 12 traditional tomato varieties from Italy for flavour and flavour-contributing compounds, and found significant variation for citric acid and glucose content. They also reported the traditional varieties that are rich in flavour, which might be because home gardeners save small amounts of seed themselves, usually from the best flavoured tomatoes. In the USA, the USDA-ARS Plant Genetic Resources Unit (PGRU) at Geneva, NY maintains the germplasm of certain fruit and vegetable crop plants including tomato. However, the tomato core collection has not been evaluated for fruit quality traits including flavour. In the present study, we evaluated 173 accessions of tomato from the PGRU core collection for flavour and report the relationship of major physicochemical traits (TSS and total titratable acids (TTA)) and other flavour-contributing components (mealiness, texture, sweetness, saltiness and acid taste) with overall flavour by regression analysis in tomato.
Materials and methods
Plant materials
A total of 173 tomato accessions from the PGRU core collection (see Supplementary Table S1, available online only at http://journals.cambridge.org) maintained by the USDA at Geneva, NY were evaluated for fruit quality including TTA, total soluble solids (TSS), firmness and subjective rating for flavour-contributing components with two replications in a randomized complete block design at the Mountain Horticultural Crops Research and Extension Center, Mills River, NC. Six plants per plot were grown with 45 cm between plants and 150 cm between rows in a raised row covered with black plastic. Plants were staked and supported using the Florida weave system as needed. Cultural practices including fertilization and plant protection measures were taken as described in Kemble (Reference Kemble2009).
Evaluation of tomato germplasm for flavour and firmness
Sensory analysis for flavour and flavour-contributing components was performed as has been done by Sinesio et al. (Reference Sinesio, Cammareri, Moneta, Navez, Peparaio, Causse and Grandillo2010) with some modifications. Briefly, tomato fruits were harvested at the red ripe stage of maturity from the second cluster (USDA colour chart 1991; http://www.ba.ars.usda.gov/hb66/138tomato.pdf), and were brought to the laboratory for physicochemical, sensory and consumer preference measurements. Yellow- and orange-coloured accessions were observed for softness to determine the ripe stage since colour was not a determining factor. For these analyses, batches of fruits homogeneous for size and colour were selected for each accession. Fruits were rinsed with tap water and a random sample of 12 fruit was taken from each bag, and fruit firmness was measured (in Newtons) on opposite paired sides of each fruit with a penetrometer (Effegi, Alfonsine, Italy) fitted with an 11.1 mm tip. Physicochemical measurements were conducted on subsamples of the fruits from the same harvest used for consumers’ taste tests.
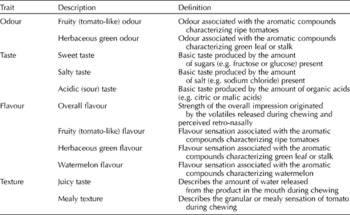
The sensory analysis was performed on tomato samples of each accession. Since there were a large number of accessions, it was not practically manageable to collect the sensory data from both replications. Hence, a representative set of fruits were selected for sensory analysis from both replications. Ten panelists, who were the frequent consumers of tomatoes, were trained for sensory analysis in the beginning of the test. Definitions of terms used for sensory analysis (Table 1) were as reported by Sinesio et al. (Reference Sinesio, Cammareri, Moneta, Navez, Peparaio, Causse and Grandillo2010), and the intensity of the descriptive terms was rated on a 0–5 scale, where 0 = extreme low and 5 = extreme high. Panelists were asked to rinse their mouths with tasteless carbonated mineral water to neutralize their palate between the samples.
Descriptors used in the sensory analysis of tomato fruit quality

Shoulder and blossom end parts were removed from the large-fruited round, plum and heirloom-type tomatoes, whereas entire fruits were used from cherry and grape tomatoes. Approximately 2.5 × 2.5 cm2 pieces were prepared for the preference test. Samples were assigned to the ten panelists at random. Test panelists received tomato samples in numbered plastic dishes. Name of the accessions was kept anonymous during the tests. Since the number of accessions in the evaluation was 173, these tests were carried out over a 6-week period, depending upon the maturity of the accessions. Only well ripe fruits were used for flavour rating and harvesting was done by the same persons in order to minimize the possible variation in picking fruits. Panelists rating the flavour were the same over the time.
Analysis of tomato fruits for physicochemical traits
Fruits harvested for sensory analysis were used for physicochemical (TTA, TSS and vitamin C) traits from both replications. Pieces of eight to ten freshly harvested, red ripe fruits per plot were homogenized in a blender and aliquots of 50 ml were stored at − 20°C until assayed. Vitamin C assays were performed at the USDA-ARS PGRU, Geneva, NY. The TSS was estimated with a Rudolph Research model J257 Automatic Refractometer (Hackettstown, NJ; Hyman et al., Reference Hyman, Gaus and Foolad2004; Baranska et al., Reference Baranska, Schutz and Schulz2006; Labate et al., Reference Labate, Sheffer, Balch and Robertson2011), and vitamin C using a Cosmo Bio Company Ltd (Tokyo, Japan) Vitamin C Assay kit (product no. SML-ROIKO2-EX) as described previously (Labate et al., Reference Labate, Sheffer, Balch and Robertson2011). For TTA assays, a five-fold dilution was made by adding 40 ml of water to 10 ml strained homogenate, which was then titrated with 0.1 N NaOH to pH 8.2. Percent citric acid (the predominant acid) was estimated using the equation
 $$\begin{eqnarray} TTA\ \left (\frac {g}{100}\ ml\right ) = \frac {( N )\times ( V 1)\times (Eq\ wt)\times 100}{ V 2\times 1000} \end{eqnarray}$$
where N equals the normality of NaOH (0.1), V1 is the volume of NaOH added to reach the titration point, Eq wt is the equivalent weight of citric acid (64 mg/mEq) and V2 is the original volume of the sample (50 ml) (Reference Sadler and NielsenSadler, 1998). Titrations were conducted with a Metrohm 751GPD Titrino (Westbury, NY) used in conjunction with a 730 Sample Changer.
Data analysis
Differences among the accessions for flavour and flavour-contributing components were determined using SAS (version 9.2) software (SAS Institute Inc., 2007). Accessions were categorized based on fruit types as large-fruited (round tomato), plum (roma tomato) or grape (cherry) tomato. This category was determined based on the genetic background of each accession in addition to fruit shape observed during the experiment. A general linear model with accession as fixed effects and replication as random effects was used. Data were transformed to log10 to normalize distribution and the ratio of TSS to TTA determined. All data were transformed to the power of 2, 3 and 4 before performing the regression analysis of overall flavour on flavour-contributing components. Data were analysed for correlation and regression using SAS software. Correlation procedure (PROC CORR) was used to determine Pearson's correlation coefficients among flavour and flavour-contributing components. Linear, polynomial and multiple regression analyses of overall flavour on original and transformed data were performed with Regression procedure (PROC REG) in SAS (SAS Institute Inc., 2007) to investigate the effect of individual components on flavour.
Least square means was determined and least significant difference value was used to separate the least square means for quality traits, including physicochemical (TTA and TSS), of the tomato accessions at the 0.05 probability level (SAS Institute Inc., 2007). Principal component (PC) analysis (PCA) on the basis of sensory data, TSS and TTA was performed using the Principal component (PRINCOMP) procedure of SAS software (SAS Institute Inc., 2007). The absolute value of 0.50 was used in the correlation and loading matrices to select the traits in a particular PC.
Results
Analysis of variance for phenotypic traits
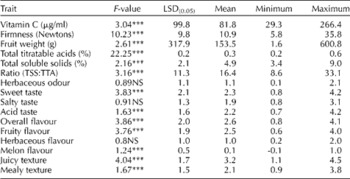
There were highly significant differences (P< 0.01) among tomato accessions for overall flavour and flavour-contributing components except for herbaceous odour, herbaceous flavour and salty taste (Table 2). Fruit firmness is claimed to be associated with fruit flavour (Magee et al., Reference Magee, Caporaso and Prakash2003; Wang et al., Reference Wang, Liu, Huang and Jin2009). For that reason, firmness was measured in this core collection and average firmness was found to be 10.9 N, ranging widely from 5.8 to 35.8 N. Extremely soft (low firmness) accessions were PI 128129, Tomate, M7281 and Tomate del Lugar, whereas those with a high level of firmness were 888, Castle Rock and Sun1643. Among the grape tomatoes, firmness ranged from 5.9 to 17.3 N with an average of 9.9 N, whereas it was 7.8–20.3 N with an average of 12.2 N for plum tomatoes. Compared with both of these groups, large-fruited tomatoes had the widest range of 5.8–35.8 with an average of 10.8 N, indicating that there may be enormous opportunity to improve firmness in this category. Detailed information on the firmness of each accession is given in Supplementary Table S1 (available online only at http://journals.cambridge.org). The average TTA was 0.3%, ranging from 0.15 to 0.64%. Among the grape, plum and large-fruited tomatoes, there was not much differences for TTA (see Supplementary Table S1, available online only at http://journals.cambridge.org). However, the average TSS was 4.9, ranging from 3.4 to 9%, which is a very good level of variation. Grape tomatoes ranged from 3.8 to 9% of TSS with an average of 5.3%, whereas plum tomatoes ranged from 3.7 to 6.2% with an average of 4.8%, and large-fruited tomatoes ranged from 3.4 to 5.9% with an average of 4.8%. Accessions with high levels of TSS were LA2102, Sponzillo, AVRDC#6, LYC3249 and Red Pear. The average ratio of TSS to TTA was 16.4, ranging from 8.6 to 33.1 – the wider the ratio, the sweeter the tomato (Auerswald et al., Reference Auerswald, Peters, Bruckner, Krumbein and Kuchenbuch1999a; Auerswald et al., Reference Auerswald, Schwarz, Kornelson, Krumbein and Bruckner1999b). In grape tomatoes, the ratio ranged from 9.4 to 27, whereas it ranged from 8.6 to 33.1 and 8.7 to 28.1 in large-fruited and plum tomatoes, respectively. Fruity odour of tomato ranged from 0.9 to 4.0 when measured on a scale from 0 to 5, 5 being excellent. Fruity odour ranged from 1.1 to 3.5 in grape tomatoes, whereas it ranged from 0.9 to 3.9 and 1.6 to 4.0 in large-fruited and plum tomatoes, respectively. Among the grape tomatoes, D'Olvia x Industria was one of the best, whereas Kiyosu No. 2 was the best variety among the plum and Marglobe was the best among the large-fruited tomatoes for fruity odour. With a similar ranking, sweet taste ranged from 0.8 to 4.2, whereas acidic flavour ranged from 0.7 to 4.2. Based on sweet taste, Sponzillo was the best grape tomato, whereas German Red Strawberry among large-fruited and Kiyosu No. 2 was the best among plum tomatoes. Fruity flavour ranged from 0.6 to 4.0, whereas melon flavour was virtually absent in this collection of tomato accessions. Juicy texture ranged from 1.1 to 4.5, whereas mealy texture ranged from 0.9 to 3.8. Overall flavour rating, which is due to the interactions of individual components of flavour as described above, ranged from 0.8 to 4.1 with an average of 2.6 (Table 2). The best accessions for overall flavour were Jubilee, Polish Oxheart, Sponzillo, Zhongza No. 4, Hong Kong and Rinon PI 118783. Detailed information on all of these traits of each accession is given in Supplementary Table S1 (available online only at http://journals.cambridge.org). Tomato accessions from the USDA core collection varied broadly for all of these traits, revealing the potential to utilize the available accessions for fruit quality improvement.
Analysis of variance (ANOVA) and descriptive statistics of 173 tomato accessions for fruit quality physicochemical traits, and flavor components measured by sensory methods

NS, non-significant; *** indicates significance at a P-value of 0.05, 0.01 and 0.001, respectively.
Correlation and regression analysis
Subjective rating of overall flavour and its correlations with individual components was the major focus of this study. Unlike in other studies (Causse et al., Reference Causse, Buret, Robini and Verschave2003), there was no correlation between firmness and overall flavour (r= − 0.10, P>0.05) in the present study. However, when correlation was determined by fruit type including large-fruited and grape or cherry, firmness was positively correlated with overall flavour in grape tomatoes (r= 0.35, P< 0.05), whereas it was negatively correlated (r= − 0.20, P< 0.05) in large-fruited tomatoes. However, acid taste was not found to be correlated with overall flavour (P>0.05). The other traits (TSS and TTA) and the other subjective components including fruity odour and sweet taste were positively correlated with overall flavour (data not shown).
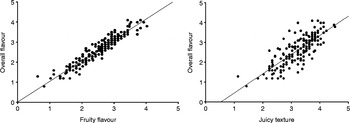
Linear regression analysis revealed that fruity flavour was positively correlated with overall flavour with a regression slope of 1.03 (R 2= 90.1%) (Fig. 1). Regression analysis of flavour on fruity odour had fit the equation with R 2-value of 33.5%. However, juicy texture produced much better linear fit with a slope of 0.97 and an R 2-value of 61.7% (Fig. 1). Mealy texture, which is believed to be a good predictor of flavour, produced not only a negative slope (b= − 0.54) but also a low R 2-value of 15.8%. However, sweet taste produced the equation with R 2-value of 76.3% (data not shown). Both TSS and TTA had poor regression equation with an R 2-value of 13.9 and 10.8%, respectively. None of the multiple as well as polynomial regression equations were better than linear equations to predict the overall flavour value using its individual components.
Scatter plots with linear regression analysis of the overall flavour of tomato for different flavour-contributing components with fruity flavour on left and juicy texture on right. None of the multiple and polynomial regression equations provided better fit than linear equations.

Principal component analysis
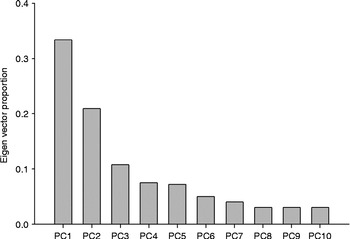
PCA identified 14 PCs to explain 100% of the variability in the core collection of tomatoes for flavour and flavour-contributing traits in the present study. However, 85% of the variation was explained by six PCs and 80.0% of the variation was explained by five PCs (Fig. 2). This is a high level of variability being explained by only five PCs. The first PC explained 33.4% of variability and was comprised of TTA, fruity odour, sweet taste, fruity flavour and juicy texture. The second PC was comprised of TSS, the ratio of TSS to TTA, acid taste and herbaceous flavour, and explained 20.9% of the total variability. Similarly, the third PC was comprised of melon flavour and herbaceous odour, and explained 10.8% of variability. The first two PCs are plotted in Fig. 3. Based on these PCs, cluster analysis was performed but the 173 tomato accessions did not show any distinct clusters (Fig. 3).
Proportion of eigenvalue plot generated on the basis of phenotypic data. Ten PCs on the basis of phenotypic data explained 88% of the total variation. The height of the bar indicates the relative proportion of variance explained by each PC.

PCA based on physicochemical, and sensory data in tomato accessions. Plot of the first two PCs with contributing phenotypic traits is plotted on the left, where ratio denotes the ratio between total soluble solids (TSS) and TTA. On the right-hand side, cluster based on the PC is displayed. There are no clear clusters found in this study, which does not rule out the possibility of overlapping of tomato accessions. Code of the accessions should be matched with the accession names given in Supplementary Table S1 (available online only at http://journals.cambridge.org).

Discussion
The primary objective of the present study was to investigate the level of variability for flavour and flavour-contributing components in the PGRU core collection of tomato accessions. To the best of our knowledge, we evaluated the largest number of tomato accessions for overall flavour and flavour-contributing components in replicated trials to date. A set of 173 tomato accessions were evaluated by subjective ratings for flavour or instrumental measurements for components contributing to the flavour. Similar to the present study, 12 traditional tomato accessions from Italy were evaluated, which demonstrated a good level of variability for sensory as well as biochemical traits including glucose, citric acid, amino acids and sensory traits (Ercolano et al., Reference Ercolano, Carli, Soria, Cascone, Fogliano, Frusciante and Barone2008). The TSS content in the present study (up to 9%) was much higher than available in those Italian accessions (5.5%). They found that overall flavour and juiciness was much better in ‘Marmande’ tomato, whereas Roma tomatoes were low in salty flavour. Generally, tomatoes high in sugar and intermediate in acidity are more acceptable (Baldwin et al., Reference Baldwin, Scott, Einstein, Malundo, Carr, Shewfelt and Tandon1998). In the present study, we had some accessions with this combination such as Sponzillo and AVRDV #6. Both of these accessions contained high TSS content but an intermediate level of TTA. LA2101 had high TSS despite high TTA. This is encouraging for tomato breeders. Positive correlations between TSS and overall flavour, and TTA and overall flavour in the present study are in agreement with a previous study (Vogel et al., Reference Vogel, Tieman, Sims, Odabasi, Clark and Klee2010) where the correlation coefficient between TSS and flavour was 0.59, and that with TTA was 0.69. Buttery et al. (Reference Buttery, Takeoka, Naim, Rabinowitch and Nam2001) evaluated seven tomato accessions for Furaneol, a flavour-contributing volatile compound, and found a wide variation ranging from 8 to 880 μg/kg. Similar to the present study, tomato lines were found to differ significantly for fruit firmness and TTA in a previous study (Causse et al., Reference Causse, Buret, Robini and Verschave2003). A wide variation in the components of flavour found in tomato accessions in the present study provides a possibility of utilizing these accessions in improving tomato fruit quality. It should be noted that the panel of core collection of tomato was comprised of fresh-market and processing tomatoes. While the information on TSS may be utilized on both types of tomatoes, flavour is more important in fresh-market tomatoes.
The second objective of the present study was to investigate the relationship between the overall flavour and flavour-contributing components including subjective rating, TSS and TTA by regression analysis. Linear regression analysis was adequate to explain the relationship between the overall flavour and flavour-contributing components. This was contradictory to what was expected. Flavour being a complex trait, there are multiple components including TSS, TTA, volatiles and other subjective components involved in determining the overall flavour. However, none of the multiple as well as polynomial regression equations were better than linear equations. While this information may have to be validated in additional studies, this finding is encouraging for tomato breeding. It implies that breeders can simply focus on selecting tomato accessions for a few traits including sweet taste, juiciness or juicy texture to improve the overall flavour.
Most of the ‘sweet’-related traits were positively correlated with the overall flavour. This is in agreement with other studies (Causse et al., Reference Causse, Buret, Robini and Verschave2003). Firmness was negatively correlated with sugar content, sweetness and juiciness, and positively correlated with fruit weight in their study, which contradicted the present findings. However, the negative correlation between TSS and fruit weight in their findings in grape tomatoes is in agreement with the present findings. Acid taste or herbaceous flavour and odour were negatively correlated, and the regression slope was also very small in the present study, which are in agreement with the previous findings.
Five PCs explaining 86% of the total variability in the present study were comparable to Ercolano et al. (Reference Ercolano, Carli, Soria, Cascone, Fogliano, Frusciante and Barone2008), where they found five PCs explaining 91% of the total variability. However, in a similar study, only three components explained 87% of the total variability (Krumbein et al., Reference Krumbein, Peters and Bruckner2004). In conclusion, a wide variation exists in the PGRU core collection of tomato germplasm, which can be exploited to improve tomato for flavour.
Acknowledgements
The study was supported by a grant from the Tomato Crop Germplasm Committee (CGC). Support of the technical staff Candice Anderson, Ragy Ibrahem, Adrienne Ratti, Tyler Nance and Susan Sheffer in implementing the experiments is highly appreciated. We are thankful to the panelists who participated in generating the subjective taste test data.