Implications
Nowadays, the use of animal-based indicators in welfare assessment schemes is usually preferred. However, their use entails several challenges such as the fulfilment of three requirements (validity, feasibility and reliability) that ensure that the indicators can be successfully used at farm level. Considering that animal-based indicators may be more prone to subjectivity than resource-based indicators, it is paramount to assess their reliability. To our knowledge, no empirical research studies have focused on assessing inter-observer reliability (IOR) of welfare indicators on goats and therefore more studies addressing this topic are strongly requested.
Introduction
Welfare assessment requires a multidimensional approach (Fraser, Reference Fraser1995). There are generally two categories of indicators that can be used to assess animal welfare at farm level: resource and animal-based (Johnsen et al., Reference Johnsen, Johannesson and Sandøe2001). Traditionally, on-farm welfare assessment focused on the evaluation of resource-based indicators, such as the type of management provided to the animals (e.g. Bartussek, Reference Bartussek1999). However, providing good management and resources may not reflect high standards of welfare. In fact, some studies question the validity of resource-based indicators, showing farms with similar production systems demonstrating a huge variation in animal welfare (Mülleder et al., Reference Mülleder, Troxler, Laaha and Waiblinger2007). Following these constraints, the interest in assessing the actual welfare state of the animals through animal-based measures has increased (Johnsen et al., Reference Johnsen, Johannesson and Sandøe2001).
However, the integration of animal-based indicators in welfare assessment schemes entails several challenges. The first challenge relates to their availability: there are few studied animal-based indicators (Johnsen et al., Reference Johnsen, Johannesson and Sandøe2001), and they are even fewer if we consider small ruminants (Battini et al., Reference Battini, Vieira, Barbieri, Ajuda, Stilwell and Mattiello2014; Caroprese et al., Reference Caroprese, Napolitano, Mattiello, Fthenakis, Ribó and Sevi2016). The second challenge refers to the fulfilment of three requirements, namely validity, feasibility and reliability that will allow the indicators to be used effectively at farm level (Waiblinger et al., Reference Waiblinger, Knierim and Winckler2001). Validity tells us the extent to which an indicator measures what it is supposed to measure, whereas feasibility refers to opportunity of successfully using the indicator during on-farm assessment. Reliability entails a particular challenge, as there is an associated level of subjectivity involved when using animal-based indicators, and so the observers’ assessment might be biased by their own concern or level of empathy with the animals (Meagher, Reference Meagher2009). If reliability is poor, then the indicator is probably inappropriate for the evaluation of animal welfare, or should be further refined, namely by improving its definition, ensuring good data recording and better training the observers. These actions have proved to be essential to increase reliability and achieve an accurate and consistent welfare assessment outcome (De Rosa et al., Reference De Rosa, Grasso, Pacelli, Napolitano and Winckler2009). Reliability weighs the amount of random and systematic error (the smaller the error, the more reliable is the measurement), and in a more intuitive way can be defined as ‘the ability of scores of a measuring device to differentiate among subjects or objects’ (Kottner et al., Reference Kottner, Audigé, Brorson, Donner, Gajewski, Hróbjartsson, Roberts, Shoukri and Streiner2011, p. 104). Reliability can be explored by means of inter or intra-observer reliability studies, observer consistency studies and test-retest reliability studies (Scott et al., Reference Scott, Nolan and Fitzpatrick2001; Streiner and Norman, Reference Streiner and Norman2008). In this paper, we will focus on IOR that measures ‘the degree to which two or more ratters are able to differentiate among subjects or objects under similar assessment conditions’ (Kottner et al., Reference Kottner, Audigé, Brorson, Donner, Gajewski, Hróbjartsson, Roberts, Shoukri and Streiner2011, p. 104). Literature frequently use the term agreement as a synonym of reliability, however, they are different concepts. Inter-observer agreement, defined as ‘the degree to which two or more ratters achieve identical results under similar assessment conditions’ (Kottner et al., Reference Kottner, Audigé, Brorson, Donner, Gajewski, Hróbjartsson, Roberts, Shoukri and Streiner2011, p. 104), can be used to assess stability of observations, being useful for data interpretation when compared with reliability measures.
After reliability, validity and feasibility are established, a scoring system has to be defined to operationalize the indicators in order to allow their integration in a welfare assessment protocol (Vieira, Reference Vieira2015). This operationalization is accomplished by choosing a scoring system which will imply different constraints in terms of level of measurement. In welfare assessment, ordinal and continuous scales are the two most common scoring systems (Scott et al., Reference Scott, Nolan and Fitzpatrick2001) with the former being the most frequently used, as a result of being generally easier to deliver as they are based on a comparability assumption. On the other hand, ordinal scales are, in most cases, artificial constructs and therefore are sometimes associated with difficulties in their interpretation, which makes paramount to assess their reliability (Vieira, Reference Vieira2015). Moreover, there are different studies pointing out the challenge of conducting reliability studies under commercial conditions (Kaufman and Rosenthal, Reference Kaufman and Rosenthal2009). Therefore, the lack of studies, and especially of studies that provide information for data interpretation, is a drawback when one is considering the integration of certain indicators and their associated scoring systems in a welfare protocol. This is particularly important when considering animal-based indicators, and substantiates the scientific relevance of this paper.
The aim of this study was to evaluate IOR of animal-based indicators (at group and individual-level) of the Animal Welfare Indicators (AWIN) welfare assessment prototype protocol applied to dairy goats in intensive dairy farms. The study was implemented by conducting two field studies where two pairs of observers, one in Portugal and another in Italy, visited 10 farms each and applied the AWIN prototype protocol.
Material and methods
Farm visits
In all, 30 intensive commercial dairy goat farms in Portugal (PT) and 30 in Northern Italy (IT) were visited to apply the AWIN welfare assessment prototype protocol. In PT, the farms were randomly selected from a national database of Direcção-Geral de Alimentação e Veterinária, whereas in IT farms were selected with the support of the S.A.T.A. (Technical Advice Service for Farmers) of the Lombardy region, where the majority of intensive dairy goat farms are located and depending on farmers’ availability, geographic location and farm size. With the objective of assessing IOR, 10 farms in IT and 10 farms in PT were visited between January and March 2014, with these farms being randomly selected among the 30 farms of each country. In PT, the number of adult dairy goats on each of the 10 selected farms ranged from 80 to 2000 animals, with a mean (±SD) of 470 (±560) goats; in IT, the number of dairy goats ranged from 32 to 912 animals, with a mean (±SD) of 227 (±279) goats. In all farms, goats were kept indoors on straw litter, although some farms also had access to an outdoor grazing or exterior pen, where the goats had the opportunity to exercise. Breeds were mainly Saanen and Alpine, milked twice a day, fed with Total Mixed Ration and with permanent access to water.
Each farm was visited by two observers. The two Italian observers had different background and level of experience with dairy goats: one was an animal scientist with more than 3 years of experience with dairy goats, whereas the other was a veterinarian with no specific experience with dairy goats. The two Portuguese observers had a common background (veterinary), but different levels of experience: one had more than 3 years of experience working with dairy goats, the other had just graduated from veterinary school. All the observers received equal training before the farm visits were initiated. Each observer received digital training material for each of the indicators in assessment that included a detailed definition of the indicator, how to assess and score it, some examples and a self-evaluation section. Following this all observers received a full week training on the use of the AWIN prototype protocol. The training included theoretical and on-farm practical sessions.
On-farm assessment of animal-based indicators
In all, 25 animal-based indicators, classified in accordance with the four principles and 12 criteria developed by Welfare Quality® (Botreau et al., Reference Botreau, Veissier, Butterworth, Bracke and Keeling2007) were assessed either at group-level (14 indicators) or at individual-level (11 indicators). Detailed descriptive criteria used to assess each animal-based indicator and the order of data collection, are presented in Battini et al. (Reference Battini, Barbieri, Vieira, Stilwell and Mattiello2016) and Can et al. (Reference Can, Vieira, Battini, Mattiello and Stilwell2016). However, in order to understand the type of analyses employed for the reliability study, the type of data collection is briefly presented herewith. The data collection began with group-level observations of the following indicators: number of goats ‘Improperly disbudded’, ‘Queuing at feeding’, ‘Queuing at drinking’, with poor ‘Hair coat condition’, ‘Oblivion’, ‘Abnormal lying’, with signs of thermal stress (either ‘Shivering’ or ‘Panting’) and ‘Kneeling at the feeding rack’. For all these indicators, the total number of goats in the pen presenting these conditions was recorded, and transformed into percentages out of the total number of goats in the assessed pen. Immediately after this assessment, ‘Qualitative Behaviour Assessment’ was conducted; subsequently, the observer entered the pen to perform both ‘Latency to the first contact’ and ‘Avoidance distance tests’, and finally ‘Severe lameness’ and ‘Kneeling in the pen’. The individual-level assessment focused on 11 indicators: ‘Body Condition Score (BCS)’, ‘Udder asymmetry’, ‘Cleanliness’ (hindquarters, lower legs and udder), ‘Lesions’ (hindquarters, lower legs, body, neck and head), ‘Knee calluses’, ‘Abscesses’ (hindquarters, udder, body, neck and head), ‘Overgrown claws’, ‘Discharges’ (ocular, nasal or vulvar), and ‘Faecal soiling’. All these indicators were recorded on the same animals (with both sides (left and right) being considered when relevant, e.g. for body, legs, claws) and were scored using a binary assessment system, except for ‘BCS’ and ‘Knee calluses’ that had three assessment scores. In order to speed up the individual assessment (Battini et al., Reference Battini, Barbieri, Vieira, Stilwell and Mattiello2016), whenever possible animals were restrained either at the feeding rack (in four Italian farms) or, depending on farmers’ availability, at the milking parlour (in one Portuguese farm). In all other cases (nine Portuguese and six Italian farms), the animals had to be manually restrained inside the pen. The individual goats were selected based on a systematic sampling and after being assessed each goat was marked with an animal marker.
Only one pen was assessed in each farm. This decision was supported by the results of preliminary observations carried out in order to determine the optimal sampling strategy on the number of pens to be assessed: these observations showed the presence of significant differences between different farms, but almost no variation between pens in the same farm (Vieira et al., Reference Vieira, Battini, Ajuda, Mattiello and Stilwell2012). However, although we did not expect to find a great variation between pens, we decided to sample the pen considered as presenting the potentially highest risk for welfare. This selection takes into consideration the following aspects: highest density, lower feeding space/animal ratio, and lower drinking place/animal ratio, presence of both horned and hornless goats in the same pen. If all pens were in similar conditions, one random pen was selected. As the selection of the pen at higher risk may increase the prevalence of some indicators, and may therefore also affect the results on reliability, we excluded from assessment infirmary, culling, quarantine or maternity pens.
The number of goats to be assessed was proportional to the pen size, with percentages ranging from the totality of the goats in the pen (⩽15 animals) to a minimum of 25% of goats in the same pen (>150 animals), assuming a 50% prevalence, and considering a 90% interval of confidence and an accuracy of 10%. All data for each farm was collected on the same day by both assessors. The assessors applied the AWIN welfare assessment prototype protocol simultaneously and individually, not interfering or interacting with each other during all application of the protocol. Observers were new to the farms and had not previously performed any similar assessment on those same animals.
Statistical analysis
To assess IOR for continuous data (group-level indicators), intra-class correlations (ICCs) coefficients were calculated with a two-way mixed effects model (Shrout and Fleiss, Reference Shrout and Fleiss1979), that is, the subjects in the study were considered to be random but the observers were not random effects. There are several ICC variants that may be selected based on the nature of the study and the type of agreement the researcher wishes to estimate (Shrout and Fleiss, Reference Shrout and Fleiss1979; Hallgren, Reference Hallgren2012). For the present study, we estimated ICC in terms of absolute agreement, as we wanted to take into account if good IOR is characterized by scores that are similar in absolute value. Estimates for ICC were interpreted using Shrout guidelines (Shrout, Reference Shrout1998): 0.0 to 0.10=virtually none; 0.11 to 0.40=slight; 0.41 to 0.60=fair; 0.61 to 0.80=moderate; 0.81 to 1.0=substantial.
To assess IOR for categorical data (individual-level indicators), κ and weighted κ (κ w ) coefficients (Cohen, Reference Cohen1968) were calculated. κ consists of a measure of ‘true’ agreement that reflects the proportion of agreement fully chance corrected. Weighted κ (κ w ) penalizes disagreements in terms of their seriousness, whereas unweighted κ handles all disagreements equally not taking order of categories into account, thus, being inappropriate for ordinal scales (Cohen, Reference Cohen1968). The quadratic weighting scheme, where disagreement weights are proportional to the square of the deviation of individual ratings (Brenner and Kliebsch, Reference Brenner and Kliebsch1996), was used. We followed Fleiss thresholds for k: 0 to 0.40=poor; 0.41 to 0.75=fair to good; and 0.76 to 1=excellent; and Landis and Koch for κ w : <0=poor; 0.00 to 0.20=slight; 0.21 to 0.40=fair; 0.41 to 0.60=moderate; 0.61 to 0.80=substantial; and 0.81 to 1=almost perfect (Streiner and Norman, Reference Streiner and Norman2008). For individual-level indicators, the proportion of overall agreement, as a measure of inter-observer agreement was also calculated by dividing the number of agreements (both positive and negative agreements) by the total number of agreements and disagreements (Uebersax, Reference Uebersax2014). A value around 75% is suggestive of good agreement (Burn and Weir, Reference Burn and Weir2011). Data were analysed using the packages of the R statistical language.
Results
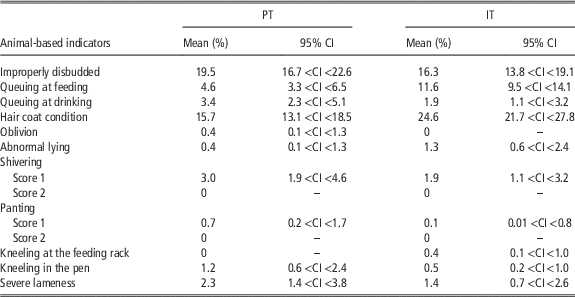
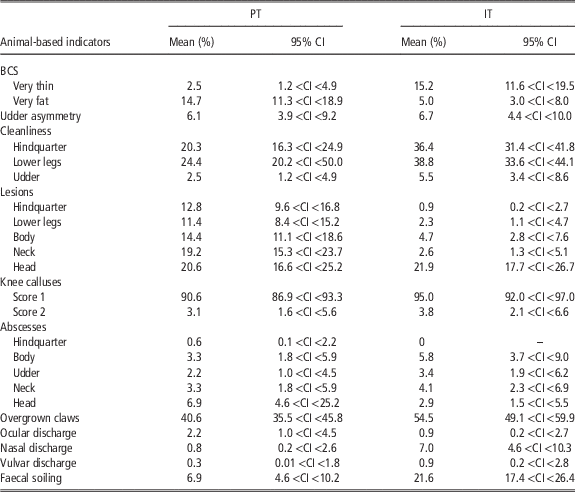
Group-level observations were performed on a total of 1518 adult dairy goats (734 in PT and 784 in IT), and individual observations were carried out on a total of 703 adult dairy goats (360 in PT and 343 in IT). Tables 1 and 2 report the number of cases observed in the 10 Portuguese and IT dairy goat farms (means values for the population of farms) for the indicators considered for the IOR study: 95% confidence intervals for the study population.
Animal-based indicator’s prevalence (group-level observations) observed in the 10 Portuguese (PT) and 10 Italian (IT) dairy goat farms

CI=confidence intervals.
Means values for the population of farms and 95% CI for the study population.
Animal-based indicator’s prevalence (individual-level observations) observed in the 10 Portuguese (PT) and 10 Italian (IT) dairy goat farms

CI=confidence intervals; BCS=body condition score.
Means values for the population of farms and 95% CI for the study population.
Group-level observations
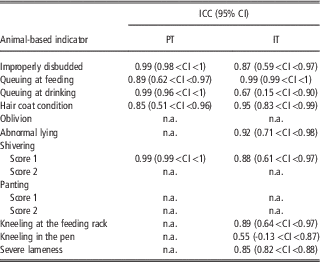
The ICC for ‘Improperly disbudded’, ‘Queuing at feeding’, ‘Hair coat condition’ and ‘Shivering score 1’ showed the highest IOR level (substantial, 0.85 to 0.99) between observers and in both field studies (Table 3). The indicators ‘Abnormal lying’, ‘Kneeling at the feeding rack’ and ‘Severe lameness’ could only be computed for the IT study but also showed the highest IOR level (substantial, 0.85 to 0.92) (Table 3). The indicator ‘Queuing at drinking’ also presented the highest IOR level (0.99) in the PT study, but a moderate (0.67) level for the IT study (Table 3). The indicators ‘Oblivion’, ‘Shivering score 2’ and ‘Panting score 1 and 2’ could not be computed due to the low number, or absence, of recorded cases (see Table 1).
Inter-observer reliability for group-level observations

ICC=intra-class correlation; CI=confidence intervals; n.a.=not possible to compute the information; PT=Portuguese; IT=Italian.
The table presents ICC computed from the assessments performed simultaneously by two observers in 10 PT and 10 IT farms, whereas applying the Animal Welfare Indicators welfare assessment prototype protocol to dairy goats.
ICC: 0.0 to 0.10=virtually none; 0.11 to 0.40=slight; 0.41 to 0.60=fair; 0.61 to 0.80=moderate; 0.81 to 1.0=substantial (Shrout, Reference Shrout1998).
Individual-level observations
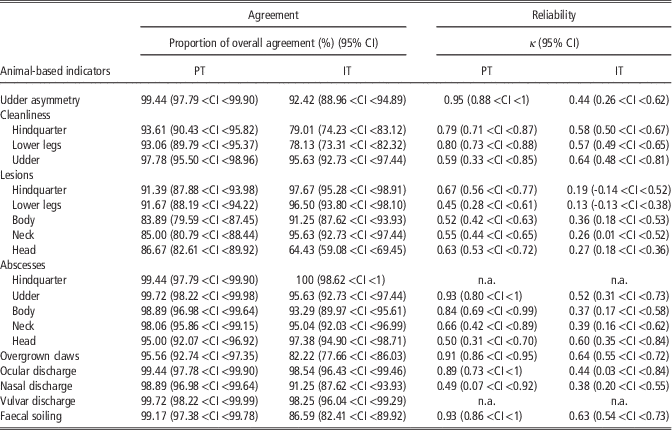
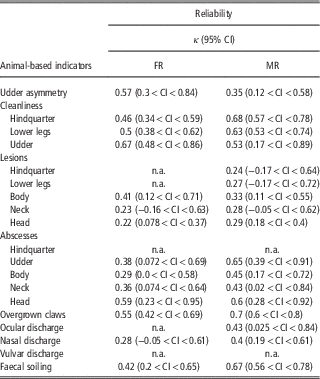
With the exception of the indicator ‘Lesions_head’, the proportion of overall agreement in both field studies, was above 75%, which is an indication of a good agreement among observers. In PT, this good agreement was followed by the highest IOR level (excellent, 0.80 to 0.95) for the indicators: ‘Udder asymmetry’, ‘Cleanliness – hindquarters’, ‘Cleanliness – lower legs’, ‘Abscesses – udder’, ‘Abscesses – body’, ‘Overgrown claws’, ‘Ocular discharge’ and ‘Faecal soiling’. In IT, the same indicators, with the exception of ‘Abscesses – body’, presented the second highest IOR level (fair to good, 0.44 to 0.63) (Table 4). Overall, in both countries, the different indicators under the general description of ‘Lesions’ presented the lowest levels of agreement, being in some cases of poor agreement. In IT, where individual assessment was carried out in four farms at the feeding rack and in six farms using manual restraining, a higher IOR level for most indicators was achieved when animals were manually restrained (Table 5).
Agreement and inter-observer reliability for individual-level observations

CI=confidence intervals; n.a.=not possible to compute the information; PT=Portuguese; IT=Italian.
The table presents the proportion of overall agreement and k scores computed from the assessments performed simultaneously by two observers in 10 Portuguese (PT) and 10 Italian (IT) farms, whereas applying the Animal Welfare Indicators welfare assessment prototype protocol to dairy goats.
k: 0 to 0.40=poor; 0.41 to 0.75=fair to good; and 0.76 to 1=excellent (Streiner and Norman, Reference Streiner and Norman2008).
Inter-observer reliability for individual-level observations (k scores) computed from the assessments performed simultaneously by two observers in 10 Italian (IT) farms, whereas applying the Animal Welfare Indicators welfare assessment prototype protocol to dairy goats at the Feeding Rack (FR) and by Manually Restraining the goats (MR)

CI=confidence intervals; n.a.: not possible to compute the information.
k: 0 to 0.40=poor; 0.41 to 0.75=fair to good; and 0.76 to 1=excellent (Streiner and Norman, Reference Streiner and Norman2008).
For both three-level indicators, ‘BCS’ and ‘Knee calluses’, proportion of overall agreement in both countries was above 75%, showing a good agreement among observers (Table 6). Regarding k w , a substantial IOR level (0.79) was achieved in PT for both indicators, whereas in IT a moderate IOR level (0.46) was found for the BCS indicator and a fair IOR level (0.27) was found for the indicator ‘knee calluses’.
Agreement and inter-observer reliability for the indicators body condition score (BCS) and Knee calluses (three scores)

CI=confidence intervals; PT=Portuguese; IT=Italian.
The table presents the proportion of overall agreement and weighted κ scores (k w ) computed from the assessments performed simultaneously by two observers in 10 PT and 10 IT farms, whereas applying the Animal Welfare Indicators welfare assessment prototype protocol to dairy goats.
k w : 0=poor; 0.00 to 0.20=slight; 0.21 to 0.40=fair; 0.41 to 0.60=moderate; 0.61 to 0.80=substantial; and 0.81 to 1=almost perfect (Streiner and Norman, Reference Streiner and Norman2008).
Overall, and focusing on the group-level indicators that could be computed in both field studies, the two pair of observers reached the highest IOR level (substantial, 0.85 to 0.99) in all the group-level indicators (with the exception of ‘Queuing at drinking’). However, when considering most of the individual-level indicators, the Portuguese pair of observers reached a higher level of IOR (excellent, 0.80 to 0.95) when compared with the Italian observers (‘fair to good’, 0.44 to 0.63). Regarding the individual-level indicators, the majority reached high (fair to good and excellent) IOR levels in both countries.
Discussion
Inter-observer reliability was measured in this study by conducting two field studies where reliability (ICC, k, and k w ,) and agreement (proportion of overall agreement for individual-level indicators) measures were assessed between two pairs of observers, following a similar approach found in previous studies, as Mullan et al. (Reference Mullan, Edwards, Butterworth, Whay and Main2011) and Phythian et al. (Reference Phythian, Toft, Cripps, Michalopoulou, Winter, Jones, Grove-White and Duncan2013). The number of observers (two) for each assessed farm in this study may be considered small when compared with other studies (e.g. Mullan et al., Reference Mullan, Edwards, Butterworth, Whay and Main2011), however, it was determined due to feasibility constraints. Moreover, this constraint was overcome by the replication of the experiment in two different countries.
High levels of IOR support the selection of indicators being evaluated in an on-farm welfare assessment context (Hewetson et al., Reference Hewetson, Christley, Hunt and Voute2006; Kaler et al., Reference Kaler, Wassink and Green2009; Meagher, Reference Meagher2009; Phythian et al., Reference Phythian, Cripps, Michalopoulou, Jones, Grove-White, Clarkson, Winter, Stubbings and Duncan2012). This is particularly important when considering animal-based indicators, as indicators taken on animals are more prone to variation.
Most of the group-level indicators, namely ‘Improperly disbudded’, ‘Queuing at feeding’, ‘Hair coat condition’, and ‘Shivering score 1’ showed the highest level of IOR between observers in both field studies. These results show that the assessment was highly reliable pointing to a usable set of animal-based welfare indicators that were therefore included in the first level of the final AWIN welfare assessment protocol for dairy goats. The training received was appropriate for the application of these indicators, overcoming differences in experience and background of the observers, which re-enforces other studies that highlight the importance of training or ‘calibration’ meetings (Ruddat et al., Reference Ruddat, Scholz, Bergmann, Buehring, Fischer, Manton, Prengel, Rauch, Steiner, Wiedmann, Kreienbrock and Campe2014).
Regarding the individual-level indicators, the majority reached high (fair to good and excellent) IOR levels in both countries, and were above the maximum lower limit of 0.4 established by the Welfare Quality® project. However, IOR of individual-level indicators was lower when compared with the group-level indicators. Overall and considering the two field studies, there are several possible reasons to explain this difference. First of all, the number of individual-level indicators to be assessed on each animal was high, but the restraining time had to be kept to a minimum in order to speed up the total observation time and limit disturbance. This may have affected the reliability of each individual-level indicator. A further possible reason is the fact that individual observation of the animals is more challenging in terms of feasibility, as there is the need to restrain the animals, in what sometimes are sub-optimal conditions. In fact, during the field studies the restraining method was affected by farm characteristics and was different in IT and PT. Our results suggest that the restraining method can actually affect the reliability of the results and may help explaining the better results achieved in PT for individual-level indicators. In PT animals were manually restrained in almost all the farms, whereas in IT many goats were assessed at the feeding rack. When the observers had the opportunity to manually restrain the goats, they probably had a better view of the whole body than when the animals were at the feeding rack. This is supported by the fact that in IT the IOR levels were higher when goats were manually restrained than when they were at the feeding rack. Under this last condition, the observers had a good view of the animal from behind, and this can probably justify the higher IOR levels reached for indicators mainly related to the udder.
Inter-observer reliability differences between countries, with the Portuguese pair of observers reaching a higher level of IOR in most of the individual-level indicators when compared with the Italian observers, may also be explained by the background and experience of the observers, with the common background of the Portuguese observers probably potentiating these results. Another reason for the difference of reliability results between the two countries is purely statistical, as the interpretation of κ values must take into consideration the prevalence of the assessed indicator in the study population (Hoehler, Reference Hoehler2000).
By depicting the differences between the individual and group-level indicators and the differences between the two field studies, our results support that reliability is not an indicator’s absolute attribute; reliability is rather an elaborated interaction between the indicator itself, the observers performing the assessment and the situation in which the assessment takes place (Streiner and Norman, Reference Streiner and Norman2008).
Conclusions
Most of the group-level indicators included in the AWIN prototype protocol for dairy goats presented the highest IOR level both in Portugal and Italy, which was paramount for considering their inclusion in the first-level assessment of the AWIN final protocol. The IOR of individual-level indicators was lower, however in most cases the IOR levels reached were still lying between the ‘fair to good’ and ‘excellent’ thresholds, with the differences found between Portugal and Italy being mostly a result of the restraining method applied. Building on these results the AWIN prototype protocol for dairy goats was refined, which lead to the publication of the final AWIN on-farm welfare assessment protocol for adult dairy goats in intensive production systems.
Acknowledgements
The authors would like to thank the farmers who allowed us to visit their farms and two anonymous referees for their thorough and insightful comments on earlier versions of this paper. The present document results from the Animal Welfare Indicators (AWIN) Project, which has been co-financed by the European Commission, within the VII Framework Program (FP7-KBBE-2010-4, grant no. 266213).