Introduction
Single crystalline multiprincipal element alloys have been found to exhibit many properties, which have been sought after for various applications. A group of such alloys is called high entropy alloys (HEAs). HEAs consist of at least five elements at roughly equal concentrations (5–35 at.%) [Reference Yeh, Chen, Lin, Gan, Chin, Shun, Tsau and Chang1, Reference Tsai and Yeh2, Reference Miracle and Senkov3]. For instance, HEAs have shown good corrosion and wear resistance [Reference Tsai and Yeh2], promising mechanical properties [Reference Tsai and Yeh2], thermal stability and hardness at high temperatures [Reference Tsai and Yeh2, Reference Chuang, Tsai, Wang, Lin and Yeh4, Reference Hsu, Juan, Wang, Sheu, Yeh and Chen5], good tensile strength at low temperatures [Reference Gludovatz, Hohenwarter, Catoor, Chang, George and Ritchie6], and improved ductility, fatigue, strength, and fracture resistance [Reference Gludovatz, Hohenwarter, Catoor, Chang, George and Ritchie6, Reference Wei, Li, Zhu, Liu, Lei, Wang, Wu, Mi, Liu and Wang7, Reference Gludovatz, Hohenwarter, Thurston, Bei, Wu, George and Ritchie8]. These are all properties required in future nuclear applications, such as generation IV reactors, which suggests HEAs as candidate materials for nuclear power plants. In this respect, radiation tolerance is one of the main requirements of newly developed materials. Studies on radiation resistance of HEAs have yielded favorable results [Reference Zhang, Stocks, Jin, Lu, Bei, Sales, Wang, Béland, Stoller, Samolyuk, Caro, Caro and Weber9, Reference Granberg, Nordlund, Ullah, Jin, Lu, Bei, Wang, Djurabekova, Weber and Zhang10, Reference Xia, Yang, Yang, Liu and Zhang11, Reference Zhang, Jin, Xue, Lu, Olsen, Beland, Ullah, Zhao, Bei, Aidhy, Samolyuk, Wang, Caro, Caro, Stocks, Larson, Robertson, Correa and Weber12, Reference Levo, Granberg, Fridlund, Nordlund and Djurabekova13, Reference Granberg, Djurabekova, Levo and Nordlund14]. For example, a reduced defect growth has been observed in a subgroup of HEAs, the so-called equiatomic multicomponent (EAMC) alloys [Reference Granberg, Nordlund, Ullah, Jin, Lu, Bei, Wang, Djurabekova, Weber and Zhang10, Reference Levo, Granberg, Fridlund, Nordlund and Djurabekova13].
Experimental studies on the irradiation resistance of HEAs have been conducted on both single crystalline alloys and polycrystalline materials [Reference Zhang, Stocks, Jin, Lu, Bei, Sales, Wang, Béland, Stoller, Samolyuk, Caro, Caro and Weber9, Reference Xia, Yang, Yang, Liu and Zhang11, Reference Zhang, Jin, Xue, Lu, Olsen, Beland, Ullah, Zhao, Bei, Aidhy, Samolyuk, Wang, Caro, Caro, Stocks, Larson, Robertson, Correa and Weber12, Reference Kiran Kumar, Li, Leonard, Bei and Zinkle15, Reference Lu, Niu, Chen, Jin, Yang, Xiu, Zhang, Gao, Bei, Shi, He, Robertson, Weber and Wang16]. In addition to the experimental investigations, computational studies have also been conducted on single crystals [Reference Granberg, Nordlund, Ullah, Jin, Lu, Bei, Wang, Djurabekova, Weber and Zhang10, Reference Levo, Granberg, Fridlund, Nordlund and Djurabekova13, Reference Granberg, Djurabekova, Levo and Nordlund14, Reference Koch, Granberg, Brink, Utt, Albe, Djurabekova and Nordlund17, Reference Velisa, Ullah, Xue, Jin, Crespillo, Bei, Weber and Zhang18, Reference Ullah, Xue, Velisa, Jin, Bei, Weber and Zhang19]. However, although these experimental and computational results are comparable, from a practical viewpoint, single crystals are often very expensive and show a high anisotropy of different properties, which is undesirable for most applications. Therefore, more research on polycrystalline HEA materials needs to be conducted. The simulations performed on single crystalline materials can also be used for comparison with polycrystalline samples, if experimental observations are made within the grains, far from the grain boundaries. Because the simulations are limited in size, the direct simulation of micrometer grains is impossible with conventional simulation techniques, used for irradiation simulations. However, the effect of grain boundaries can be investigated in nanocrystalline materials, where the average size of the grains is of the order of nanometers.
Irradiation experiments on HEAs have focused on Ni-based alloys in many cases [Reference Granberg, Nordlund, Ullah, Jin, Lu, Bei, Wang, Djurabekova, Weber and Zhang10, Reference Xia, Yang, Yang, Liu and Zhang11, Reference Kiran Kumar, Li, Leonard, Bei and Zinkle15, Reference Lu, Niu, Chen, Jin, Yang, Xiu, Zhang, Gao, Bei, Shi, He, Robertson, Weber and Wang16, Reference Velisa, Ullah, Xue, Jin, Crespillo, Bei, Weber and Zhang18]. In addition, computer simulations have been performed on the same alloys, using different interatomic potentials [Reference Granberg, Nordlund, Ullah, Jin, Lu, Bei, Wang, Djurabekova, Weber and Zhang10, Reference Levo, Granberg, Fridlund, Nordlund and Djurabekova13, Reference Velisa, Ullah, Xue, Jin, Crespillo, Bei, Weber and Zhang18, Reference Ullah, Xue, Velisa, Jin, Bei, Weber and Zhang19]. It was seen that some of the alloys showed a superior performance compared with elemental Ni under the same irradiation conditions. In addition to conventional polycrystalline materials, with grain sizes on the micrometer scale, nanocrystalline metallic systems have become an attractive option for structural materials, mainly because of their high strengths compared with polycrystalline and single crystalline alternatives [Reference Van Swygenhoven and Weertman20, Reference Meyers, Mishra and Benson21, Reference Lu, Lu and Suresh22, Reference Zou, Wheeler, Ma, Okle and Spolenak23, Reference Liao, Lan, Gao, Zhang, Xu, Song, Wang and Lu24, Reference Youssef, Zaddach, Niu, Irving and Koch25, Reference Ebrahimi, Bourne, Kelly and Matthews26]. For instance, nanocrystalline Ni has shown a far higher strength, because the grain size is reduced from micrometers down to tens of nanometers [Reference Ebrahimi, Bourne, Kelly and Matthews26].
A high volume fraction of grain boundaries in nanocrystalline metals obstructs dislocation motion, significantly increasing their tensile strengths. At the same time, the small-size grains may not be thermally stable [Reference Zou, Wheeler, Ma, Okle and Spolenak23], reducing the beneficial effect of nanocrystal structure at high temperatures. However, an increased resistance against thermal grain growth compared with conventional alloys has been reported for nanocrystalline HEAs. Therefore, they present a clear interest for applications in harsh environments, which has been shown in a few previous studies [Reference Zou, Wheeler, Ma, Okle and Spolenak23, Reference Liao, Lan, Gao, Zhang, Xu, Song, Wang and Lu24, Reference Youssef, Zaddach, Niu, Irving and Koch25].
To investigate whether nanocrystalline HEAs are suitable for application in irradiation environments, we have studied the radiation stability of single-phase nanocrystalline multicomponent alloys by means of molecular dynamics simulations. For this purpose, we prepared nanocrystalline cells of pure elemental Ni and Ni-based alloys of different (from binary to quaternary) chemical composition. The prepared simulation cells were subjected to a similar irradiation scheme as used in previous studies of irradiation of single-crystal HEAs [Reference Granberg, Nordlund, Ullah, Jin, Lu, Bei, Wang, Djurabekova, Weber and Zhang10, Reference Levo, Granberg, Fridlund, Nordlund and Djurabekova13], which yielded the results comparable to experiments [Reference Zhang, Nordlund, Djurabekova, Granberg, Zhang and Wang27]. In the present study, we focused on several Ni-based alloys, because they exhibited good irradiation resistance in the form of a single crystal. In addition, nanocrystalline Ni samples have previously shown many desirable properties [Reference Ebrahimi, Bourne, Kelly and Matthews26], increasing the interest of Ni and Ni-based alloys in nanocrystalline form. We observed that nanocrystallinity persists in all the studied materials until a certain irradiation dose, where the nanocrystalline structure collapses and the structure becomes a single crystal. Such an abrupt transition was observed for different alloys in several interatomic potentials. We also studied the evolution of the grain structure, effect of chemical composition, and some of the intermediate defect structures during the irradiation.
Results and discussion
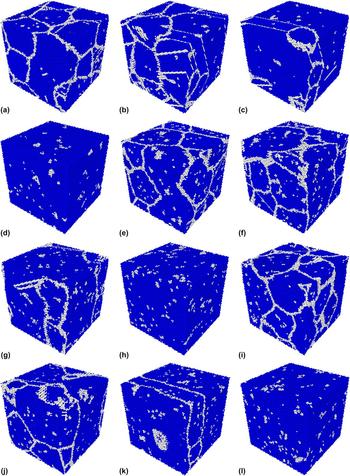
Typical evolution of the grain structure of nanocrystalline Ni during irradiation can be seen in Fig. 1 in all three interatomic potentials. During the massively overlapping cascades, the grain boundaries reorganize themselves to assume the most favorable crystal structure, which appears to be mainly face-centered cubic (FCC). Piece by piece the small grains merge, coarsening the structure and eventually an almost perfectly coherent FCC structure emerges. Remnant defects at the sites of initial grain boundaries and defects continuously introduced by the irradiation process are present in the cell. As is apparent from the figure, the grain evolution is similar for the different potentials, with the largest difference in the number of cascades needed to reach a certain stage of damage evolution in the cells. Most importantly, we observe that the collapse of nanocrystallinity happens after very different numbers of cascades in the different potentials; therefore, the results must be considered rather qualitatively than quantitatively. A quantitative comparison with the response of single-crystal cells cannot be done either; however, a comparison of dislocation structure evolution can be done qualitatively.
Grain evolution and final defect structures in pure Ni for all three potentials (Zhou et al. ((a)–(d)), Bonny et al. ((e)–(h)) and Purja Pun et al. ((i)–(l))). Snapshots taken from key points in FCC fraction evolution (see Fig. 4 ((a)–(c))). The numbers found in the captions are the number of cascades initiated in the simulation cell. 1a) Zhou et al. after 200 cascades; 1b) Zhou et al. after 1100 cascades; 1c) Zhou et al. after 1200 cascades; 1d) Zhou et al. after 1300 cascades; 1e) Bonny et al. after 1000 cascades; 1f) Bonny et al. after 2500 cascades; 1g) Bonny et al. after 2900 cascades; 1h) Bonny et al. after 3100 cascades; 1i) Purja Pun et al. after 400; cascades; 1j) Purja Pun et al. after 1900 cascades; 1k) Purja Pun et al. after 2300 cascades; 1l) Purja Pun et al. after 2600 cascades.
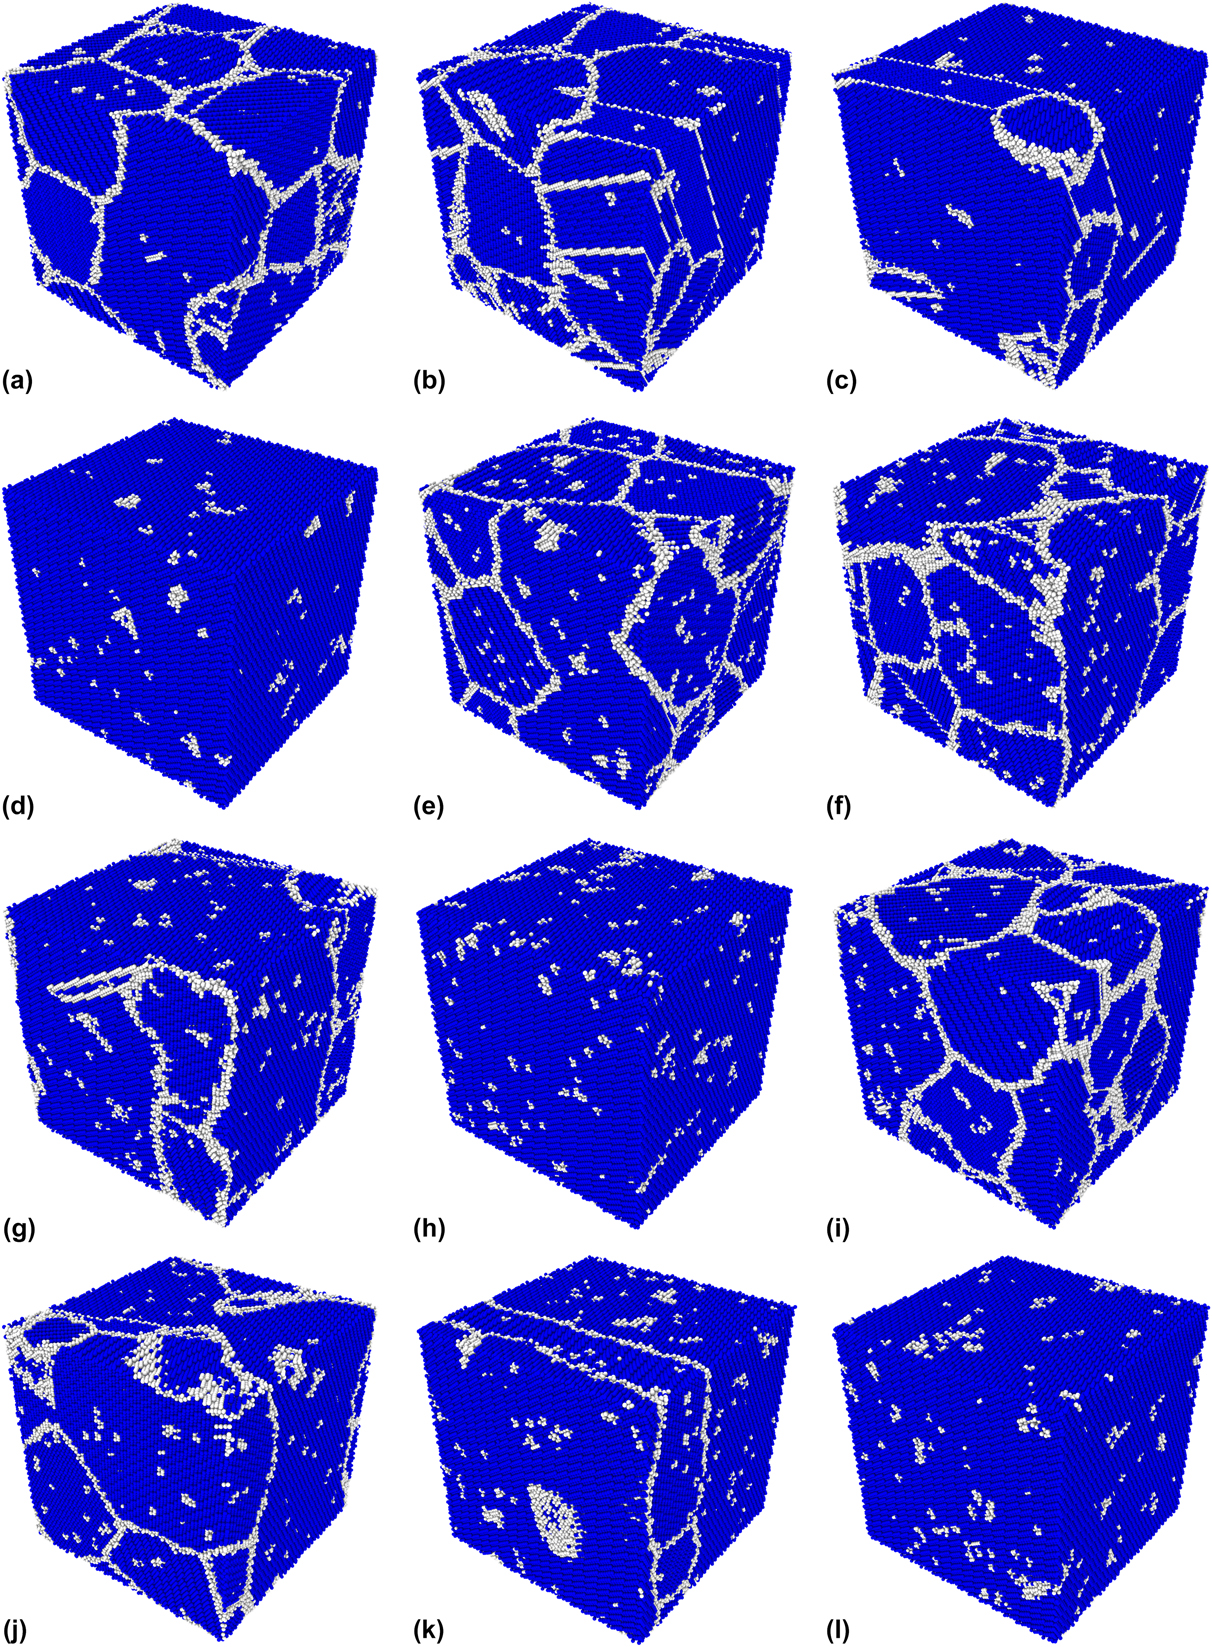
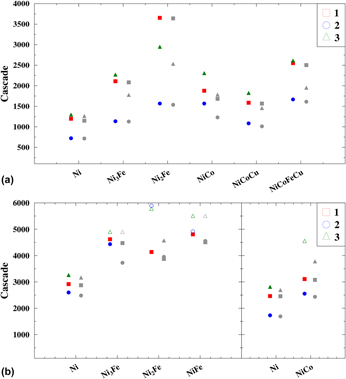
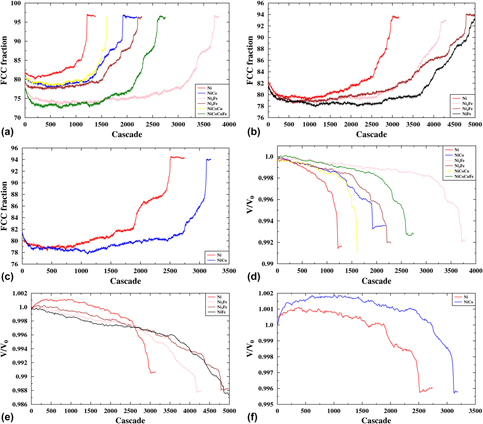
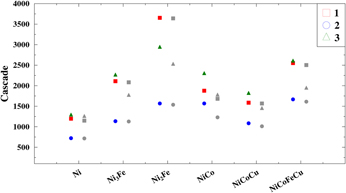
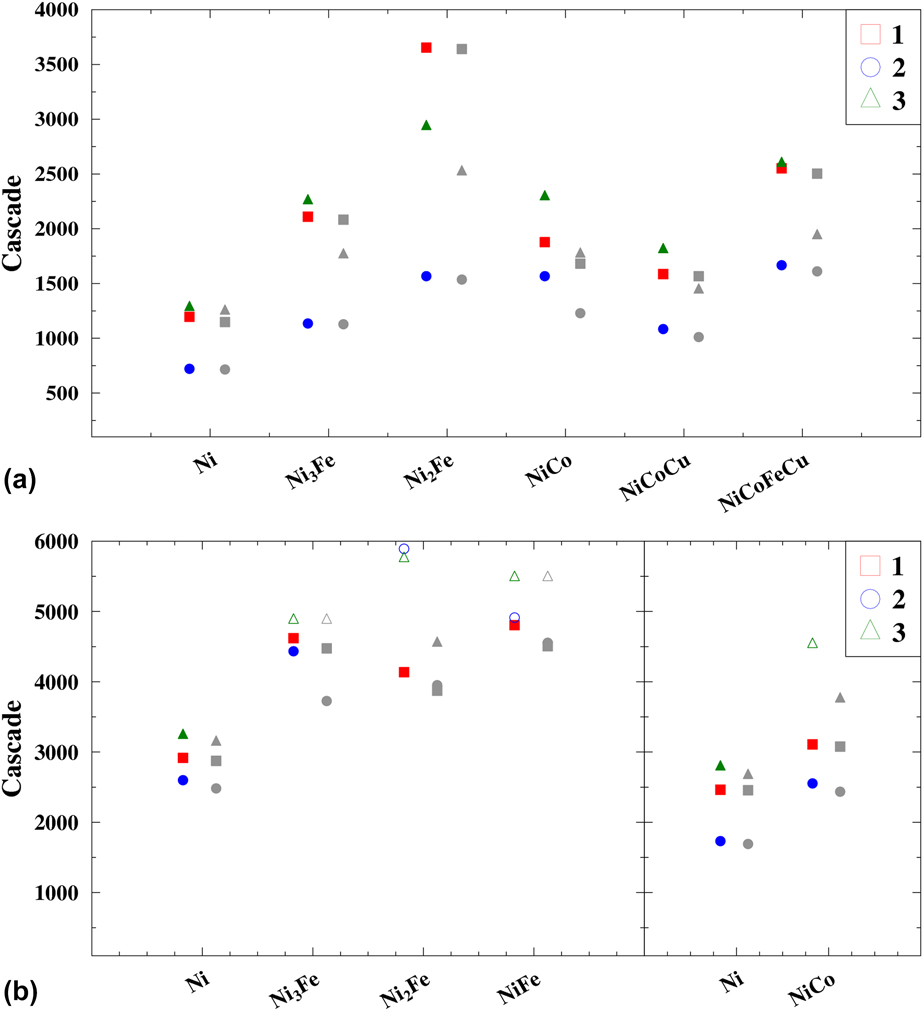
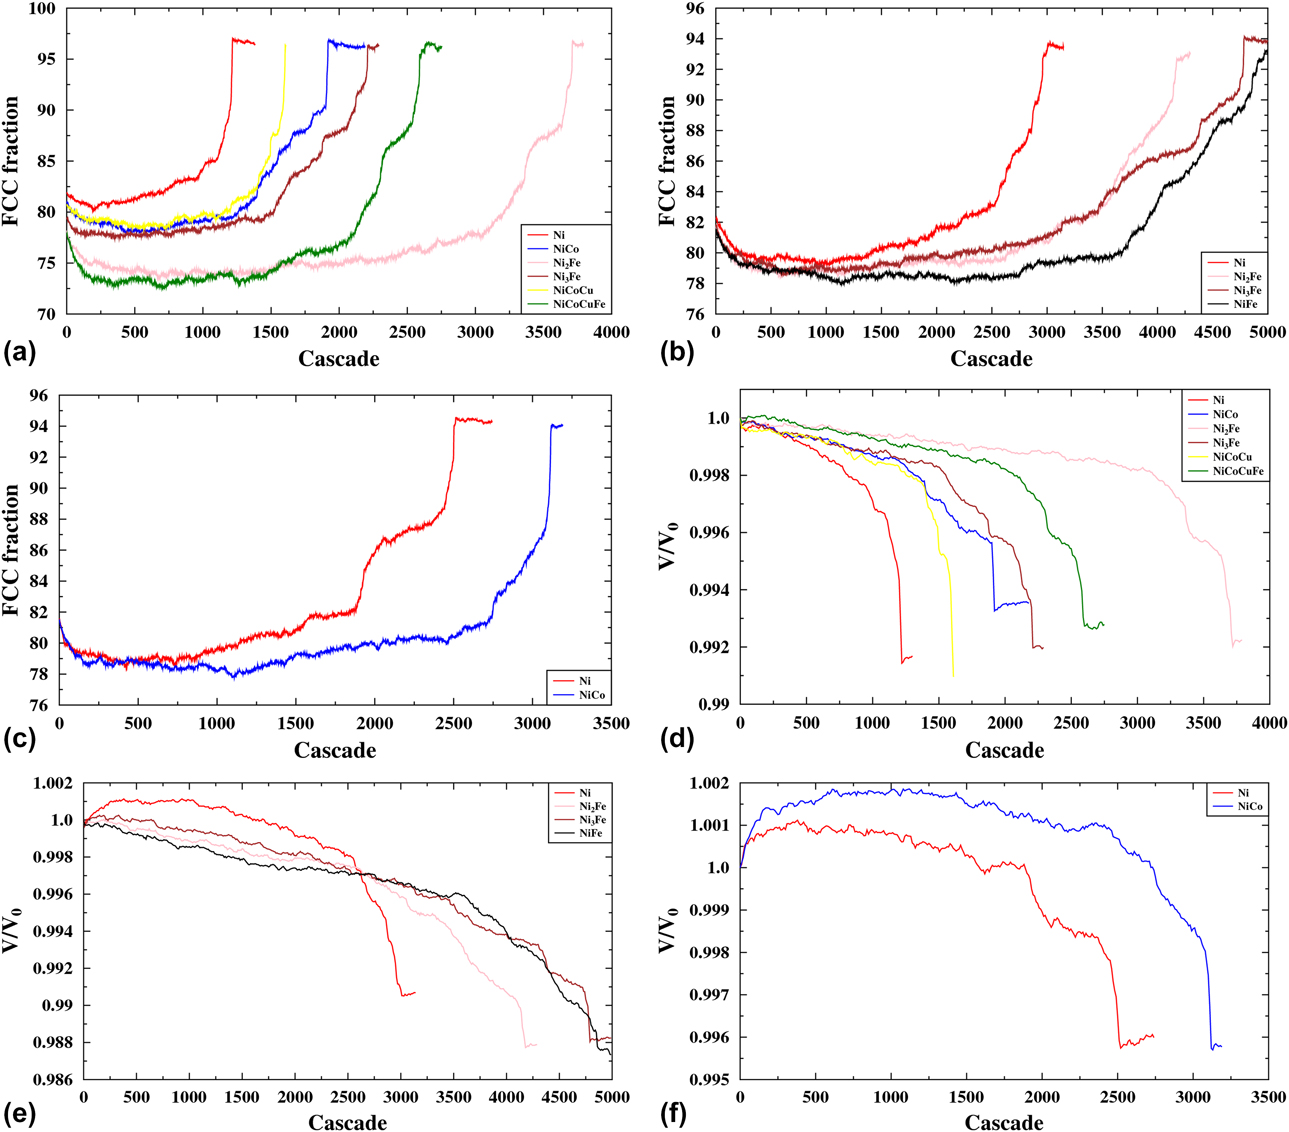
Figure 2 shows the number of cascades for which the amount of FCC atoms has risen above 90% (indicated by red-, green-, and blue-filled symbols) and when the amount of FCC + HCP atoms has risen above 90% (indicated by gray-filled symbols), for each composition. The simulations that meet these criteria are terminated shortly thereafter. Some of the cells did not collapse at all or only according to the second criterion. These cases are marked with open symbols in the figure. We stopped these simulations prematurely, because they had already shown the trend needed for this study. The results for three different cases of the initial nanocrystalline structure (see Fig. 3) are shown by different symbols. In Fig. 4, the evolution of the FCC atom percentage [(a)–(c)] and simulation cell volume [(d)–(f)] for “Case 1” [see Fig. 3(a)] against the number of cascades it has experienced is shown. The plots in (a)–(c) (percentage of the FCC fraction) and (d)–(f) (volume of the simulation cell) of Fig. 4 appear to be mirror images of each other showing increase and decrease of the relative amount of FCC atoms and the volume, respectively, indicating that the phase reorganization has occurred.
The number of cascades that resulted in the collapse of nanocrystallinity for each corresponding composition of the alloys. Open symbols show the results of the prematurely stopped simulations, which showed the trend needed for this study. The differently shaped symbols (square, circle, and triangle) indicate different initial structures (“Case 1”, “Case 2”, and “Case 3”), see Fig. 3. The red-, blue-, and green-filled symbols represent points at which the fraction of FCC atoms in the system has grown over 90%, whereas the gray-filled symbols represent points at which the fraction of FCC + HCP atoms in the system has grown over 90%. 2a) Zhou et al.; 2b) Bonny et al. and Purja Pun et al.
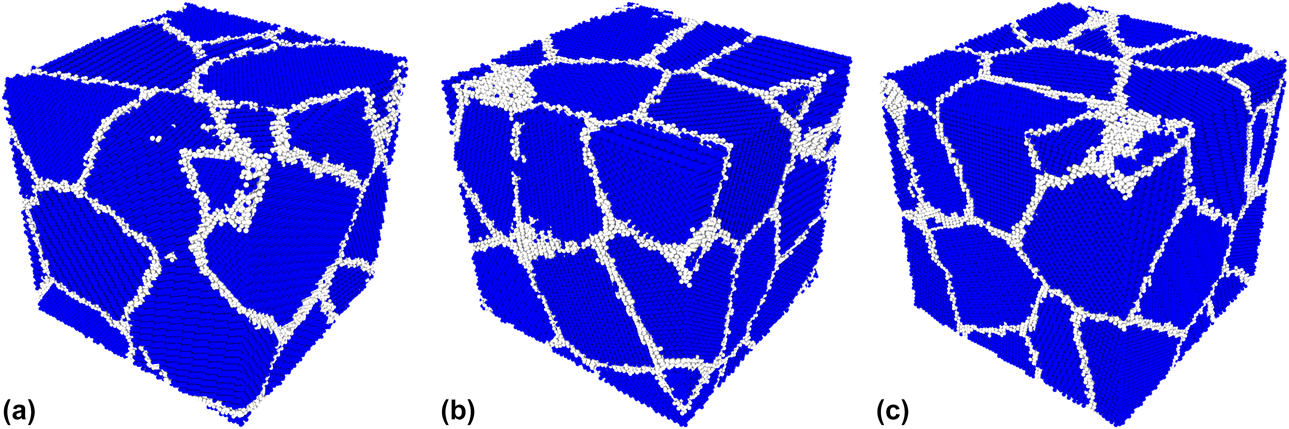
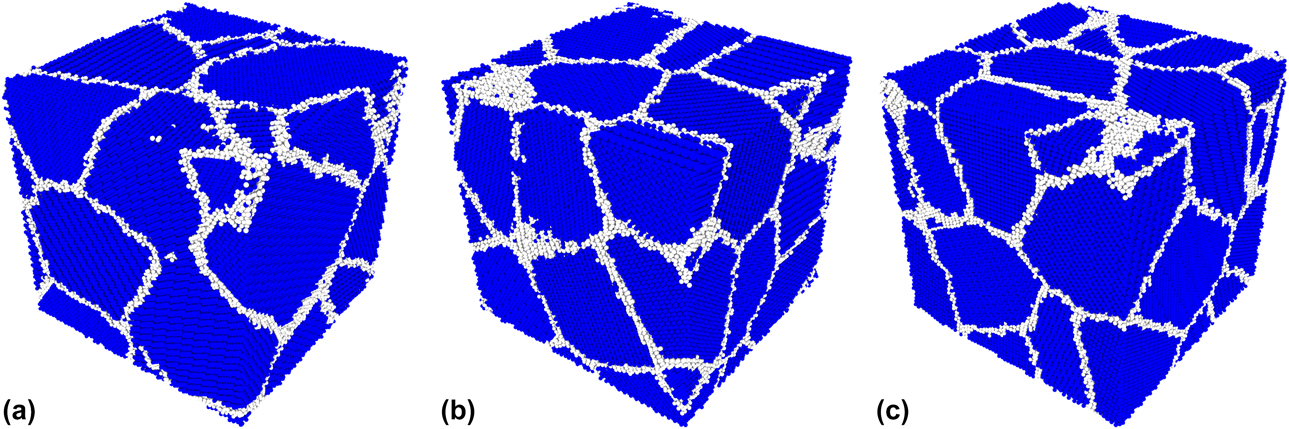
The three initial structures. Atoms with FCC structure are colored blue, and atoms in any other structure are colored white. The atoms are identified using the aCNA (see section “Analysis”). 3a) Case 1; 3b) Case 2; 3c) Case 3.
Graphs showing the FCC percentage [(a)–(c)] and volume [(d)–(f)] evolution in structure “Case 1” for each material in all three used potentials. The volume is divided by the volume of a perfect FCC cell with an equal number of atoms. 4a) Zhou et al.; 4b) Bonny et al.; 4c) Purja Pun et al.; 4d) Zhou et al.; 4e) Bonny et al.; 4f) Purja Pun et al.
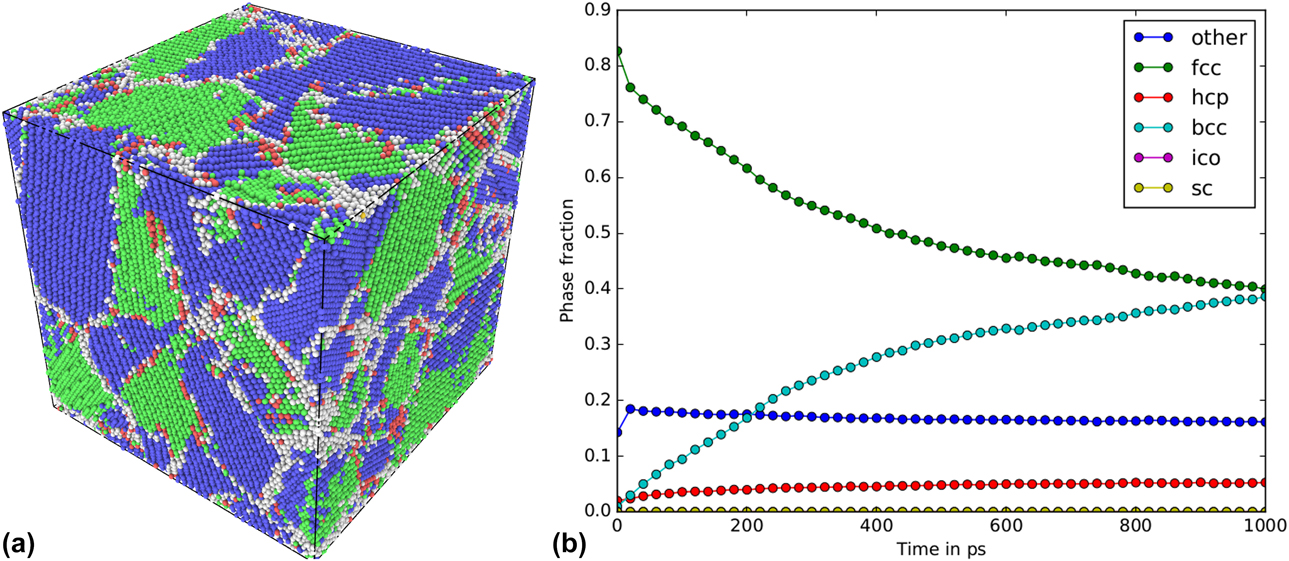
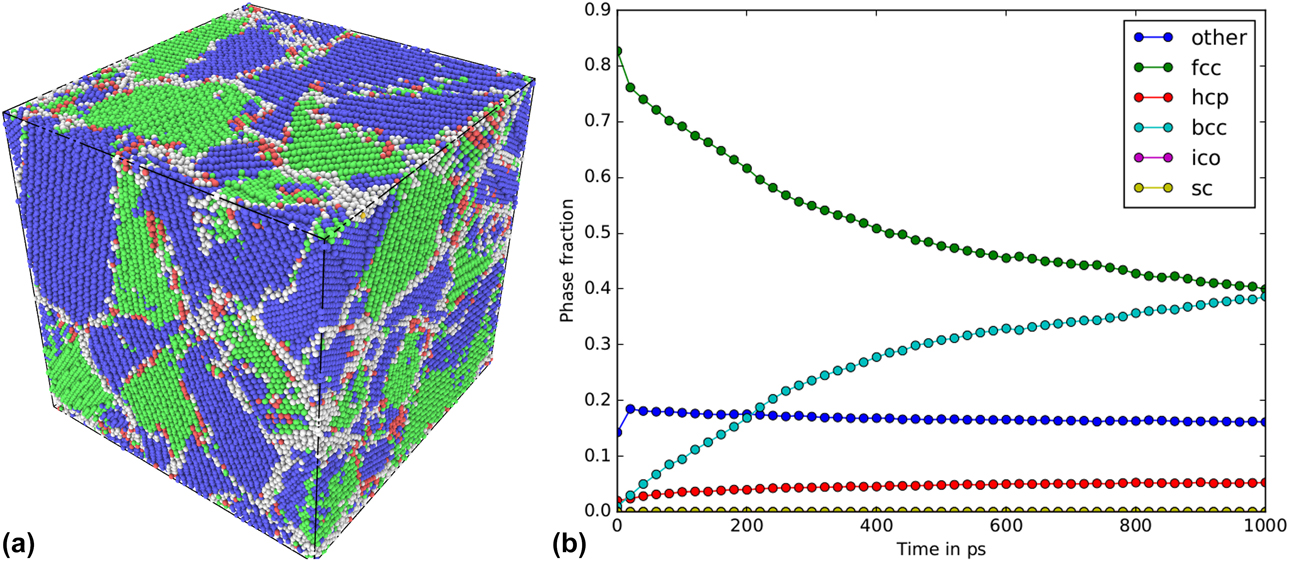
Some of the investigated alloys that are not shown in Fig. 2, but are mentioned in the Methods section, did not follow the same trend in structural evolution. The materials in question were NiFe, NiCoFe, and NiCoCr in the Zhou et al. potential. In all these cells, the grains underwent a phase transition from pure FCC to a mixture of FCC/BCC phases during the prolonged irradiation. Because a single phase was not preserved, we excluded these structures from our analysis as we focused on single-phase nanocrystalline alloys in the present work. Already after a few hundred cascades, the FCC fraction had reduced drastically, whereas the body-centered cubic (BCC) fraction rose. To investigate whether this was an effect of irradiation or a feature of the used potential, we performed aging simulations on the three unirradiated NiFe cells. These simulations confirmed that the phase transition is due to the ground state energies of the compositions rather than due to the irradiation. The aged cell of one of the initial structures can be seen in Fig. 5(a), and the corresponding phase evolution during aging can be seen in Fig. 5(b). Analysis of the ground state energies at 0 K showed that the BCC phase is the most favorable in the Zhou et al. potential for all three excluded alloy compositions. However, in the Bonny et al. potential, the NiFe alloy is stable. This potential predicts the ground state for all concentrations of Fe in the NiFe alloy to be the FCC phase [Reference Bonny, Castin and Terentyev28]; hence, the phase transition from FCC to BCC can hardly be expected in this potential. Therefore, we conclude that excluding the above-mentioned alloys from our analysis does not affect the overall conclusion of the present work.
The aging of NiFe “Case 2”. In (a) the final structure and in (b) the evolution over time. The colors in (a) represent different crystal structures as follows: Green –FCC, blue –BCC, red HCP, yellow –ICO and white OTHER. 5a) Aged NiFe “Case 2” cell; 5b) The evolution of the different phases during aging.
From the above mentioned figures, it is obvious that elemental nanocrystalline Ni is the least stable material in all investigated interatomic potentials. Any additional element stabilizes the structure, making it more resistant to irradiation. It is also apparent that the concentration and type of the added element play an important role. For example, NiCo clearly improves the stability of the nanocrystalline cell in both the Zhou et al. and the Purja Pun et al. potentials, but a further increase of the number of alloying elements (NiCoCu) decreases the stability in the Zhou et al. potential. The fourth component, Fe, in the EAMC alloy (NiCoFeCu) marginally improves the stability of the nanocrystalline structure compared with NiCo. The impact of the secondary element concentration can be seen by comparing the different NixFe samples that were simulated in the Zhou et al. and Bonny et al. potentials. In both potentials, the addition of a quarter or a third of Fe to Ni improves the stability of the nanocrystalline structure. However, from our results, it is not clear which of the two alloys, Ni3Fe or Ni2Fe, is more stable, because in at least one case, the results are opposite in the Zhou et al. and Bonny et al. potentials, implying that the physics described by these potentials is not sufficiently accurate to make a clear distinction.
The overall trend, i.e., the order, in which the specific structures the nanocrystalline phase is more susceptible to the irradiation, is consistent for most of the studied materials. The structure that collapses the earliest has usually the structure “Case 2”, whereas the structure of “Case 3” was found to be the most stable. This implies that not only the size, but also the crystallographic orientation, shape of the grains, and structure of the grain boundaries have strong impact on stability of nanocrystalline phase. This is most clearly seen in the case of Ni2Fe in the Zhou et al. potential, where there is a significant difference in the number of cascades needed to reach 90% of atoms in FCC structure for all three cases (see Fig. 2).
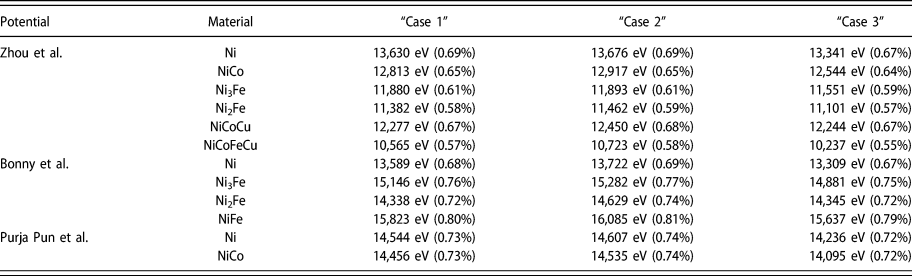
Additional calculations were conducted to investigate whether the difference in initial potential energies of the studied systems plays a major role in the stability of the nanocrystalline phase under irradiation. In these simulations, all initial nanocrystalline cells were quenched to 0 K and compared to similarly relaxed single-crystal cells. We plotted the potential energy distribution for all atoms, including those at the grain boundaries, in all different cells. The plots can be viewed in the online Supplementary material. We clearly see in the plots that energy distributions for all studied materials in all potentials have distinct tails toward the higher potential energies in nanocrystalline systems, whereas no tails are observed for the single-crystal phase. The calculation of the energy stored in the grain boundaries yielded slight differences (<1%) between the different nanocrystalline structures (cases), which can be seen in Table I. We found that the amount of energy stored in the grain boundaries appears to correlate with the order of how quickly a nanocrystalline phase was destroyed. However, the difference in energy stored in grain boundaries between the different cases was of the order of a few percent, as seen from the table. For example, in all potentials, the structure of “Case 2” resulted in the highest potential energy, compared with other cases for a given alloy, and was found to be the least stable under irradiation. The structure of “Case 3”, on the other hand, had the lowest energy and was also found in most cases to be able to withstand the highest irradiation dose before the collapse. Analyzing the absolute value or the relative increase of potential energy in nanocrystalline phase as compared to the single-crystal phase counterpart, we observe the different trends. In the Zhou et al. potential, a correlation can be seen: the lesser the energy increase, the higher the level of tolerance to irradiation of the structure. However, in the two other potentials, we observe either no trend or the opposite trend. These calculations of potential energies of the studied systems show that the stability of the nanocrystalline structure of a given alloy depends to large extent on the specific grain structure and is defined by the energy stored in the grain boundaries. On the other hand, the differences of energy increase with respect to the single-crystal phase for different materials cannot be used for the prediction of relative stability of the compared alloys in nanocrystalline phase. Thus, in the Bonny et al. potential, both the absolute and relative increase of energy because of the presence of grain boundaries are higher for the alloys compared with elemental Ni, and their stability is still much higher.
The energy stored in grain boundaries for all cases and materials. The values in eV are the extra energy and the percentages in parenthesis are the energy increase as compared to a single-crystal phase.

The potential energies of the systems were also monitored during the simulations, and the energy change can be found in the online Supplementary material. These results follow the same trend as seen for the volume change of the cells, see Figs. 4(d)–4(f). In the Zhou et al. potential, the irradiation decreases the potential energy of the system, which indicates that the reorientation induced by irradiation converts the cell into a more stable structure. This is also seen for the alloys in the Bonny et al. potential, but not for elemental Ni. The potential energy in the elemental Ni in the Bonny et al. potential and the Purja Pun et al. potential increases, indicating damage formation which is energetically rather unfavorable. The potential energy of NiCo in the Purja Pun et al. potential also increases, but to a lesser extent than in the elemental Ni cases. The general trend seen for all interatomic potentials is that the elemental Ni experiences more drastic and more rapid changes than any of the Ni-based alloys. In the alloys, the changes are more gradual toward the energetically favorable configuration. This trend indicates higher mobility of the grain boundaries in Ni as compared to other alloys and/or that the reorientation of whole grains is easier in elemental Ni. This is well in line with the result obtained for the Ni and Ni-based EAMC alloys in the single-crystal phase [Reference Granberg, Nordlund, Ullah, Jin, Lu, Bei, Wang, Djurabekova, Weber and Zhang10, Reference Levo, Granberg, Fridlund, Nordlund and Djurabekova13, Reference Granberg, Djurabekova, Levo and Nordlund14], where a higher dislocation mobility was observed in Ni compared with the other alloys.
The structural defects associated with the presence of the grain boundaries may also affect the stability of the nanocrystalline phase during the prolonged irradiation. In the previous work [Reference Levo, Granberg, Fridlund, Nordlund and Djurabekova13], we studied the evolution of dislocation structures formed by massively overlapping cascades in similar single crystal, Ni-based EAMC alloys and elemental Ni only in the Zhou et al. potential. Significantly greater amount of stacking fault tetrahedra (SFTs) was found in the elemental Ni and in the binary alloy NiCo compared with more complex alloys. Hence, one can expect formation of greater amount of SFTs within the grains of nanocrystalline Ni and NiCo, compared with other alloys.
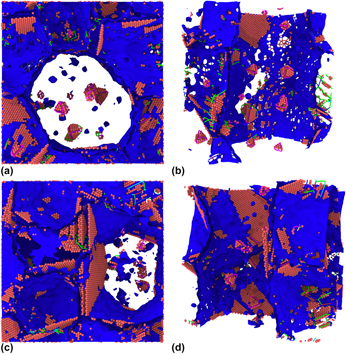
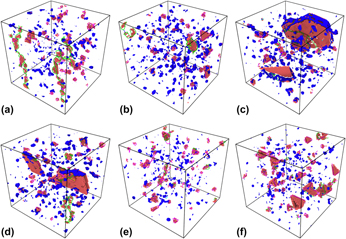
In Fig. 6, snapshots of irradiation simulations of elemental Ni and NiFe in “Case 2” structure are shown in the Zhou et al. potential and in the Bonny et al. potential, respectively. The figures show the interior structures of the irradiated nanocrystalline cells. Similar snapshots of “Case 2” structures for the remaining materials in all potentials can be seen in the online Supplementary material. The images for the Zhou et al. potential were taken after 500 cascades, Bonny et al. potential after 1500 cascades, and Purja Pun et al. potential after 1000 cascades. These specific numbers of cascades were selected to show the cells where SFTs have already been formed after sufficiently long irradiation, but where the nanocrystalline structure has not yet been destroyed. Especially, Ni in the Zhou et al. potential should at this point have a higher number of SFTs than the more complex alloys according to Ref. Reference Levo, Granberg, Fridlund, Nordlund and Djurabekova13. Note that in the figures, blue surfaces denote a defect mesh and red spheres hexagonal close-packed (HCP) atoms, while atoms in the other structures have been hidden for visual clarity. We can clearly see a greater number of SFTs in one of the larger grains in the Ni cell compared with the other materials.
Defect structures in the irradiated nanocrystalline cells. The upper row [(a) and (b)] after 500 cascades for Ni in the Zhou et al. potential and the lower row [(c) and (d)] after 1500 cascades for NiFe in the Bonny et al. potential. 6a) Zhou et al. Ni - view 1; 6b) Zhou et al. Ni - view 2; 6c) Bonny et al. NiFe - view 1; 6d) Bonny et al. NiFe - view 2.
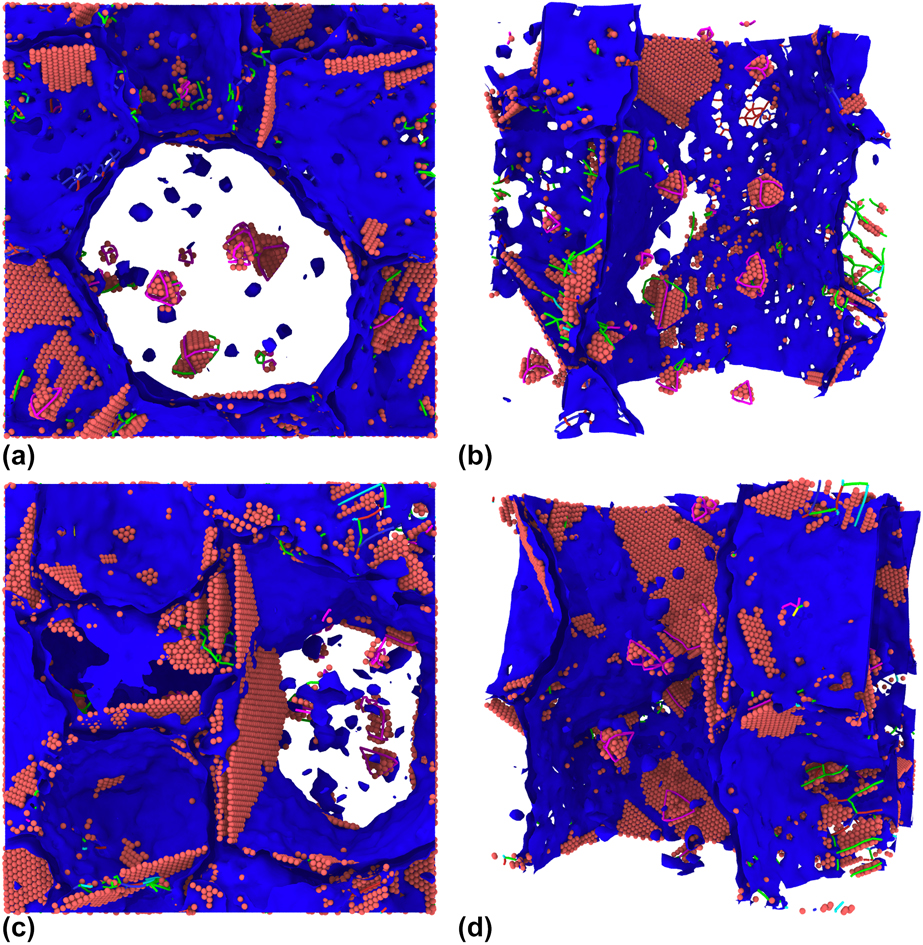
SFTs have been observed before in the irradiated Ni and binary NiFe single-crystal structures in the Bonny et al. potential [Reference Ullah, Xue, Velisa, Jin, Bei, Weber and Zhang19]. We can observe SFTs forming inside the grains of the Ni cells and all NixFe alloys, but in a somewhat more truncated form than those seen in the Zhou et al. potential. In the Bonny et al. potential, there is no clear difference in the amount of formed SFTs between the different materials, as seen in the other potentials. The irradiated cells in the Purja Pun et al. potential also show SFTs inside the grains, albeit more clearly in Ni than in NiCo.
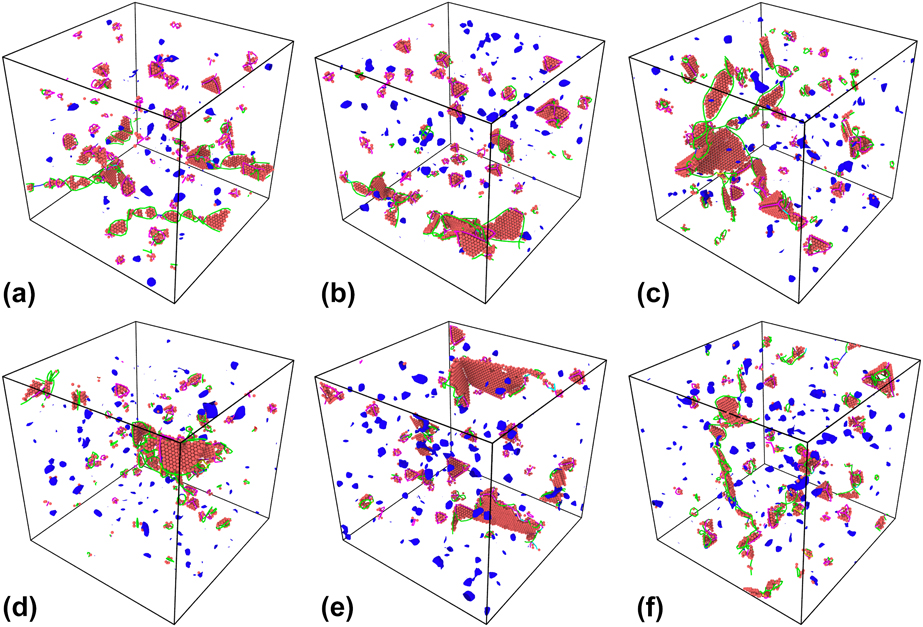
In Fig. 7, the defect structures found in the structure “Case 1” of all materials in the Zhou et al. potential are shown after the collapse of the nanocrystallinity. The structure “Case 1” was chosen, because the defective structure obtained for the structures of other cases was much less clear and often obstructed by stacking faults that remained after the transition from the nanocrystalline to a single-crystal phase. Similar defect structures are seen in all materials: Stacking faults surrounded by Shockley partial dislocations, SFTs outlined by stair-rod dislocations, and defect clusters. When comparing the Ni and NiCo cells [Figs. 7(a) and 7(d)] with initially single crystalline cells that are equally irradiated [Reference Levo, Granberg, Fridlund, Nordlund and Djurabekova13], we see similar defect structures. The most notable difference is that no large Frank loops are present in our initially nanocrystalline cells, as seen in the irradiated single-crystal cells in Ref. Reference Levo, Granberg, Fridlund, Nordlund and Djurabekova13. On the other hand, the Frank loops in the single-crystal cells were of the same order in size as the grains in the nanocrystalline cells. This implies that the structure of grain boundaries may dictate what kind of defect structures form and survive during prolonged irradiation in nanocrystalline materials.
Defect structures in structure “Case 1” for all materials in the Zhou et al. potential. 7a) Zhou et al. Ni at 1300 cascades; 7b) Zhou et al. NiCo at 2000 cascades; 7c) Zhou et al. Ni3Fe at 2250 cascades; 7d) Zhou et al. Ni2Fe at 3750 cascades; 7e) Zhou et al. NiCoCu at 1610 cascades; 7f) Zhou et al. NiCoFeCu at 2750 cascades.
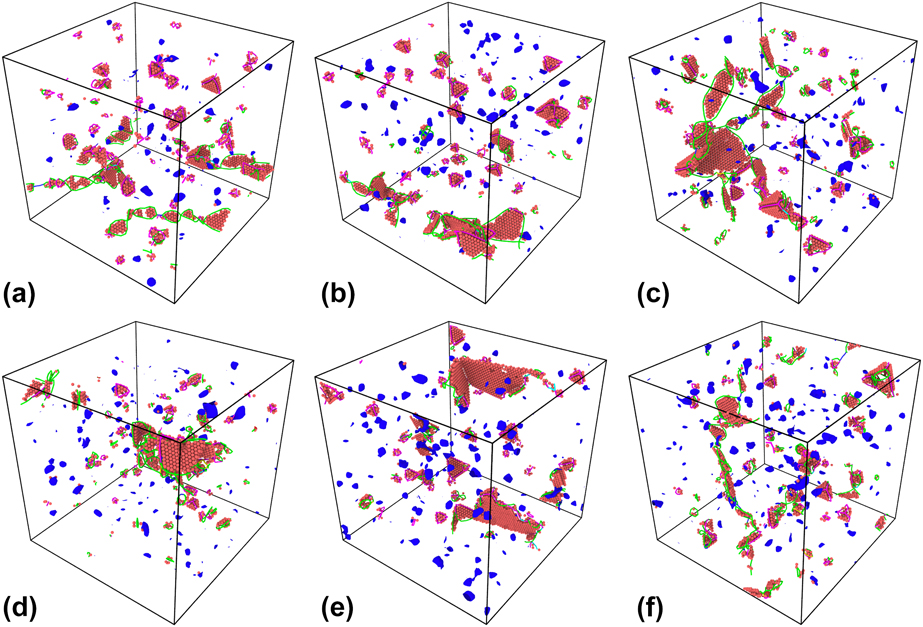
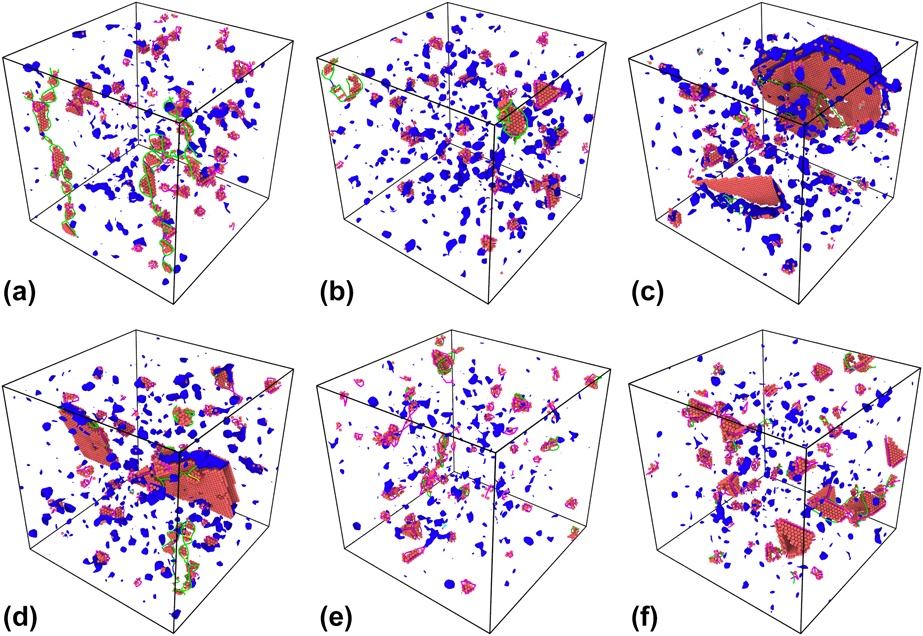
Figure 8 shows the defect structures found in “Case 1” for all materials, in the Bonny et al. [Figs. 8(a)–8(d)] and Purja Pun et al. [Figs. 8(e) and 8(f)] potentials, after the loss of nanocrystallinity. In the Bonny et al. potential, we mostly see similar defect structures to those found in the Zhou et al. potential, except for a couple of very large stacking faults in the Ni2Fe and NiFe alloys, that might be remnant structures of the case-specific grain boundaries. A lot of SFTs can still be observed, complying with results in Ref. Reference Ullah, Xue, Velisa, Jin, Bei, Weber and Zhang19. In the Purja Pun et al. potential, we again observe fairly similar defect structures as for the other potentials, perhaps containing fewer Shockley partial dislocations.
Defect structures in structure “Case 1” for all materials in the Bonny et al. potential [(a)–(d)] and the Purja Pun et al. potential [(e), (f)]. 8a) Bonny et al. Ni at 3100 cascades; 8b) Bonny et al. Ni3Fe at 5000 cascades; 8c) Bonny et al. Ni2Fe at 4250 cascades; 8d) Bonny et al. NiFe at 5000 cascades; 8e) Purja Pun et al. Ni at 2740 cascades; 8f) Purja Pun et al. NiCo at 3195 cascades.
To compare these results with previous ones, further irradiation of the original nanocrystalline structures is needed, even after the collapse, to observe whether the long-term response of these structures is comparable to the structures, which were initially in a single-crystal phase. In principle, the irradiation of the initially nanocrystalline (single crystal after the collapse of nanocrystallinity) cells should yield the type of defects like those present after irradiation of initially single-crystal structures, because the collapse results in an almost perfect coherent FCC structure. However, as described in the next paragraph, the simulation cells became a bit larger in volume after the collapse, indicating that they are vacancy rich, which could affect the defect evolution. Close inspection of these images shows that it is important to bear in mind that the different cells are not comparable quantitatively, because they have not been irradiated to the same dose.
The volume of the formerly nanocrystalline cells is also worth analyzing. Figure 4 shows that the final volumes of the cells for all materials in all potentials are 1–4% larger than that in the respective pure FCC cells with the corresponding number of atoms. This indicates an imbalanced number of interstitials and vacancies in the systems because of the large fraction of grain boundaries. As the interstitials and vacancies have different mobilities, the interstitials migrate easily to the grain boundaries, leaving the vacancies within the grains [Reference Zhao, Stocks and Zhang29]. As seen in Fig. 6 and in the figures in the online Supplementary material, there is only a very small number of dislocations in the center of the grains, excluding the vacancy rich SFTs. The dislocations produced during irradiation recombine at the grain boundaries and only immobile SFTs and other vacancy type defects remain within the grains, contributing to increase of the volume of the cell even after the collapse of nanocrystallinity.
Conclusions
In this work, we found that all studied nanocrystalline multicomponent alloys are more stable under prolonged irradiation compared with nanocrystalline elemental Ni. The evolution of the grain structure during the irradiation is similar for the different interatomic potentials; however, the critical irradiation dose of the collapse of nanocrystallinity was found to be different for different simulation cells. The subsequent addition of elements showed an overall improvement from elemental Ni for three different interatomic potentials and three nanocrystalline cells with different grain structures. When comparing the EAMC alloys to each other, it became obvious that a greater number of elements does not guarantee an increase in stability. The effect of concentration of added elements on the stability of the nanocrystalline phase was not found to be conclusive in the present studies. Some interatomic potentials demonstrated the improving stability with increase of the concentration, but further studies and potential development are needed to obtain conclusive results. The overall order in which the different nanocrystalline structures exhibited the radiation resistance mainly agreed for all the applied interatomic potentials. The three nanocrystalline structures collapsed at different irradiation doses, showing the significant effect of initial geometry of grain structure. We also observed a correlation between the stability of nanocrystalline structure and the energy stored in the grain boundaries, when comparing different grain structures and orientations. On the other hand, the stability of the nanocrystalline structure did not show a direct correlation with the amount of energy stored in the grain boundaries in different interatomic potentials, when comparing different elemental compositions. An indication of higher grain boundary mobility and/or lower barrier for grain reorientation in Ni was observed, which explains a faster collapse of nanocrystallinity in the elemental Ni cell. Similar defect structures to those found previously in single-crystal Ni, NiCo, and NiFe cells after irradiation were found in the initially nanocrystalline cells in the corresponding potentials, except for Frank dislocation loops, which might be explained by finite size of the grains in nanocrystalline structures.
Methods
Creating nanocrystalline simulation cells
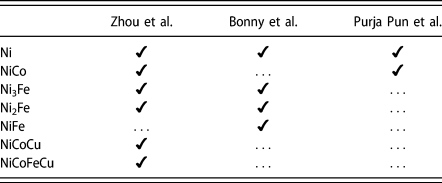
The nanocrystalline cells were created using Voronoi tessellation [Reference Voronoi30, Reference Voronoi31, Reference Voronoi32] around ten randomly chosen points inside the simulation cell. Each point corresponds to the center of a created grain. The constructed Voronoi polyhedrons are filled with a FCC lattice in random crystallographic orientations. Atoms of different types are distributed randomly on the created lattice sites to obtain the different alloy compositions as given in Table II.
The simulated materials (left-most column) with corresponding potentials (top row). If no numbers are indicated, the alloys have an equal molar fraction of all elements.

Each simulation cell of about 446,000 atoms contains 10 grains with an average grain radius of 5 nm resulting in a cubic simulation cell with a side length of 17 nm. The cells in the present simulations are of the same size as used in Refs. Reference Granberg, Nordlund, Ullah, Jin, Lu, Bei, Wang, Djurabekova, Weber and Zhang10, Reference Levo, Granberg, Fridlund, Nordlund and Djurabekova13, and Reference Koch, Granberg, Brink, Utt, Albe, Djurabekova and Nordlund17, where a similar irradiation scheme was applied. To ensure the statistical viability of our results, we created three simulation cells with the same size and number of grains, using different initial grain centers and orientations, leading to different initial grain shapes. The three different cells are visualized in Fig. 3 and referred in the following as “Case 1”, “Case 2”, and “Case 3”. All three structures were used as a base for all nanocrystalline alloys, where the atoms were randomly replaced to achieve the desired ratio of different components. The random cells of all compositions were relaxed in the corresponding interatomic potentials with the Berendsen barostat [Reference Berendsen, Postma, van Gunsteren, DiNola and Haak33] to equilibrium. The temperature was kept constant at 300 K using a Berendsen thermostat [Reference Berendsen, Postma, van Gunsteren, DiNola and Haak33].
Irradiation simulations
The classical MD code PARCAS [Reference Nordlund, Ghaly, Averback, Caturla, Diaz de la Rubia and Tarus34, Reference Nordlund, Keinonen, Ghaly and Averback35] was used for all irradiation simulations. Three different interatomic potentials were used to simulate multiple alloys of different composition, all of which are listed in Table II. We used the following interatomic potentials: Zhou et al. [Reference Zhou, Johnson and Wadley36], Bonny et al. [Reference Bonny, Castin and Terentyev28], and Purja Pun et al. [Reference Purja Pun, Yamakov and Mishin37]. The materials were chosen to correspond to earlier experiments and simulations on single crystalline samples [Reference Zhang, Stocks, Jin, Lu, Bei, Sales, Wang, Béland, Stoller, Samolyuk, Caro, Caro and Weber9, Reference Granberg, Nordlund, Ullah, Jin, Lu, Bei, Wang, Djurabekova, Weber and Zhang10, Reference Zhang, Jin, Xue, Lu, Olsen, Beland, Ullah, Zhao, Bei, Aidhy, Samolyuk, Wang, Caro, Caro, Stocks, Larson, Robertson, Correa and Weber12, Reference Ullah, Xue, Velisa, Jin, Bei, Weber and Zhang19]. The Zhou et al. interatomic potential has been used to study the defect accumulation in single-crystal materials containing up to 4 elements [Reference Granberg, Nordlund, Ullah, Jin, Lu, Bei, Wang, Djurabekova, Weber and Zhang10, Reference Levo, Granberg, Fridlund, Nordlund and Djurabekova13, Reference Granberg, Djurabekova, Levo and Nordlund14, Reference Koch, Granberg, Brink, Utt, Albe, Djurabekova and Nordlund17]. Moreover, it has been used to investigate the interplay of segregation and irradiation in the NiCoFeCu model HEA [Reference Koch, Granberg, Brink, Utt, Albe, Djurabekova and Nordlund17]. The Bonny et al. potential has also been used to study the irradiation of binary and ternary alloys [Reference Velisa, Ullah, Xue, Jin, Crespillo, Bei, Weber and Zhang18, Reference Ullah, Xue, Velisa, Jin, Bei, Weber and Zhang19]. We used several interatomic potentials for the same materials as in Refs. Reference Granberg, Nordlund, Ullah, Jin, Lu, Bei, Wang, Djurabekova, Weber and Zhang10, Reference Levo, Granberg, Fridlund, Nordlund and Djurabekova13, and Reference Granberg, Djurabekova, Levo and Nordlund14, to enable the comparison with previously obtained results, as well as to assess the different interatomic potentials. However, in the present studies, we included Ni2Fe and Ni3Fe to study the effect of Fe on the compositional stability of the nanocrystalline sample, and some previously studied alloys were excluded, because they were not stable in a single-phase nanocrystalline FCC lattice structure in the corresponding interatomic potential, as shown in section “Results and discussion”.
The irradiation scheme applied in the current study is like the ones in Refs. Reference Granberg, Nordlund, Ullah, Jin, Lu, Bei, Wang, Djurabekova, Weber and Zhang10 and Reference Levo, Granberg, Fridlund, Nordlund and Djurabekova13. This scheme has yielded comparable results with experiments for single crystals, where Rutherford backscattering spectroscopy in a channeling direction (RBS-C) spectra were compared with the ones obtained from simulated results [Reference Zhang, Nordlund, Djurabekova, Granberg, Zhang and Wang27, Reference Zhang, Nordlund, Djurabekova, Zhang, Velisa and Wang38]. In the following, we outline the main differences and main principles of the used irradiation procedure. In the current simulations, we split the simulation of a single cascade into two steps. At first, we simulated a 5 keV recoil event with a Berendsen thermostat [Reference Berendsen, Postma, van Gunsteren, DiNola and Haak33] applied to atoms inside a 0.4 nm thick layer at all sides of the simulation cell. Each recoil event was simulated for 20 ps, which was enough for the heat spike to cool down sufficiently. During this simulation step, an adaptive timestep was used to capture the correct trajectories [Reference Nordlund39] and an electronic stopping was applied as a friction force on all atoms with a kinetic energy over 1 eV. During the second step, a relaxation simulation was conducted with both Berendsen thermostat and barostat [Reference Berendsen, Postma, van Gunsteren, DiNola and Haak33], applied to all atoms in the simulation cell. This relaxation simulation lasted for 10 ps and was sufficient to cool the system down to 300 K and to reach an overall zero pressure in the simulation cell. As a result, no overheating or pressure buildup occurred during the simulation. Each recoil event was initiated in the middle of the simulation cell, to avoid any overlap with the thermally controlled borders. To achieve a homogeneous irradiation, the cell was shifted randomly in all three dimensions before initiating the next cascade simulation. This was repeated as many times as needed to achieve massively overlapping cascades and, in our case, to achieve the dose at which the initially nanocrystalline structure fails, i.e., collapses into some simpler phase.
Aging simulations
The binary nanocrystalline NiFe samples were annealed at elevated temperature to study the phase stability under equilibrium conditions without irradiation. These simulations were conducted using the open-source MD code LAMMPS [Reference Plimpton40, 41]. All cases of NiFe described by the Zhou et al. were subjected to this isothermal heat treatment at 800 K in the isobaric–isothermal (NPT) ensemble under pressure-free conditions. In total, each sample was annealed for 1 ns using a 1 fs timestep. To ensure chemical equilibration, we performed Monte Carlo steps in the semigrand canonical ensemble on 25% of the atoms every 20 MD steps [Reference Sadigh, Erhart, Stukowski, Caro, Martinez and Zepeda-Ruiz42]. Similar parameters were used in Ref. Reference Koch, Granberg, Brink, Utt, Albe, Djurabekova and Nordlund17. This Monte Carlo method requires the chemical potential difference ∆µi−j of the different species as input parameter. The following value was used for NiFe: ∆µNi–Fe = −0.212 eV, which results in the desired bulk concentrations.
Analysis
The irradiated cells were mainly analyzed with the Open Visualization Tool (OVITO) [Reference Stukowski43]. The atomistic structure of the simulation cells was studied throughout the simulations with the adaptive Common Neighbor Analysis (aCNA) modifier [Reference Stukowski44]. The CNA modifier determines the number of atoms in the following crystal structures: FCC, HCP, BCC, icosahedral coordination (ICO), and other (unknown coordination structure). We observed that the grain boundaries in the nanocrystalline cells consisted mostly of atoms with an unidentified crystal structure (other), whereas the grain interiors of the unirradiated structures consisted of FCC atoms, which amounted to about 82% of the total number of atoms in the cell. During the massively overlapping cascades, the atoms in the simulation cell reorganize so heavily that grains ultimately reorient and grain boundaries diminish, and the structure of the whole simulation cell transforms into a coherent FCC phase or FCC/HCP complex. Once the percentage of atoms in an FCC structure grew over 90 in the simulation cell, the simulation was stopped because the cell had arguably lost its nanocrystallinity. We also analyzed the percentage of FCC and HCP atoms, because the atoms may reorganize into an HCP structure, as the nanocrystallinity collapses. This can be observed, because the energy difference between the FCC and HCP phases, in the materials described by the interatomic potentials used here, is rather small. We also investigated the volume change of the simulation cells, assuming that a reduction of the simulation cell volume indicates a transition into a more coherent crystal structure. In addition to the analysis of the threshold dose for the collapse of nanocrystallinity, we studied the formation of defects by determining the dislocation structures in the cells. The dislocation structures in the intermediate and final cells were analyzed with the Dislocation Extraction Algorithm (DXA) [Reference Stukowski, Bulatov and Arsenlis45], also implemented in OVITO.
Supplementary material
To view supplementary material for this article, please visit https://doi.org/10.1557/jmr.2019.19.
Acknowledgments
Grants of computer time from CSC—the Finnish IT Center for Science are gratefully acknowledged. This work has been partly conducted within the framework of the EUROfusion Consortium and has also received partial funding from the Euratom Research and Training program 2014–2018 under grant agreement No. 633053. The views and opinions expressed herein do not necessarily reflect those of the European Commission. D.U. and K.A. acknowledge financial support by the Deutsche Forschungsgemeinschaft (DFG) through project Grant No. STU 611/2-1 as part of SPP 2006. F.D. acknowledges partial support by the Competitiveness Growth Program of the Federal Autonomous Educational Institution of Higher Professional Education National Research Nuclear University MEPhI.