Implications
Binational genetic evaluations between Germany and France for type traits were performed with a single-trait MACE (multiple across-country evaluation) model. The use of pre-corrected records has some advantages, in particular with the possibility to apply more robust models or to extend to animal models based on cow performances. The paper shows that the implementation of such evaluation is feasible at an international level (even though only two countries are considered here), and gives interesting results, most of the time (but not always) quite consistent with Interbull results.
Introduction
International genetic evaluations of dairy sires are currently conducted by Interbull using multiple across-country evaluations (MACE) as proposed by Schaeffer (Reference Schaeffer1994). Estimated breeding values (EBVs) from each country are used to obtain deregressed national genetic evaluations for bulls that have daughters with records. Similar traits measured in different countries are considered as distinct, but correlated traits. The required across-country genetic correlations are often difficult to estimate due to weak genetic ties between dairy populations in different countries, as the majority of bulls have daughters in one country only. These genetic correlations are important parameters in the Interbull evaluation to compare bulls across countries. However, these correlations are sometimes surprisingly low for some type traits, e.g. 0.70 for body depth between Germany and France.
Type traits in dairy cattle are scored in a subjective way. A classifier scores an animal following a certain definition for a trait. These definitions are set by each national herdbook organization or for the Holstein breed, by the World Holstein–Friesian Federation (WHFF). So far, WHFF has defined 16 standard traits, which should be scored by all members of WHFF identically (Hamoen, Reference Hamoen2005). At WHFF level, a lot of effort has been devoted to make the definitions for type traits more uniform across countries. In many countries the definition of several traits was adjusted once or several times during a period of 20 years. However, in national genetic evaluations, the scores for a trait were usually considered to follow the same definition over time. When countries keep on using data based on former trait definitions in national evaluations, breeding values reflect the new trait definition very slowly. Furthermore, the corresponding EBVs are used as input in the international genetic evaluations of Interbull, which pulls down the genetic correlation between countries. In order to avoid this, countries should consider changes in trait definitions in their genetic evaluations. This can be done by omitting data scored with an earlier definition or by treating these different scores as different traits in a multiple-trait national evaluation. De Jong and Harbers (Reference De Jong and Harbers2002) showed that the average correlation with other countries increases in such a case. Tsuruta et al. (Reference Tsuruta, Misztal and Lawlor2004) presented changes over time in genetic parameters of type traits even though there was no official change in the definition. These changes over time can also decrease the genetic correlation between countries.
In parallel to international bull comparison, Germany and France decided, in 2005, to perform joint German–French bull and cow test evaluations for all traits included in the national total merit indices. These could be performed using a two-country animal model with original performance data (full multi-trait model) but it was not computationally feasible on all traits due to the number of animals and the number of traits involved. Alternatively, an approximate multi-trait model with a time (year) effect using pre-corrected data from a two-step procedure has been shown to be a feasible and robust approach for prediction of breeding values (Ducrocq et al., Reference Ducrocq, Boichard, Barbat and Larroque2001). Lassen et al. (Reference Lassen, Sorensen, Madsen and Ducrocq2007) showed, via simulation, that a full multi-trait model was not significantly better than such an approach. Lassen et al. (Reference Lassen, Sorensen, Madsen and Ducrocq2007) also showed that including a time (year) effect in the approximate multi-trait model led to evaluations more robust to over- or underestimation of genetic trends and improved genetic progress significantly. The two-step approach was similar to current Interbull international evaluations but using pre-corrected records instead of deregressed EBVs. Another potential improvement was the inclusion of full pedigree information of animals with sire and dam relationship in the evaluations as recommended by Van der Linde et al. (Reference Van der Linde, De Roos, Harbers and De Jong2005), whereas in the current Interbull evaluations, pedigree information of animals is traced back by sire, maternal grandsire (MGS) and phantom group of maternal granddam (MGD).
The objective of this study was to implement a German–French MACE evaluation for each type trait using pre-corrected records in an approximate multi-trait approach. For each trait: (1) genetic correlation across countries was estimated looking at its stability over time, (2) binational genetic evaluation using daughter yield deviations (DYD) of bulls (DYD-MACE) was performed for bull comparison and (3) binational genetic evaluation using yield deviations (YD) of cows (YD-MACE) was performed for bull and cow comparison.
Material and methods
Data
DYD of bulls for DYD-MACE
Data from German (August 2006) and French (October 2006) national genetic evaluations were chosen for implementing the DYD-MACE model. Only Black and White Holstein bulls included in the Interbull evaluation for type traits were selected. There were 15 611 and 15 148 bulls with DYD data from Germany and France, respectively. After combining the German and French files for each trait, there were 27 367 bulls, 574 of which had data in both countries (common bulls). For pedigree information, the current Interbull pedigree file for Holsteins was reformatted from the sire, MGS and MGD format to a sire and dam format. The total number of animals in the pedigree file was 57 137. For unknown parents, we defined genetic groups according to the breed, country of origin, selection path (son to sire, son to dam, daughter to sire and daughter to dam) and birth year of the animal.
For parameter estimation, only bulls having 30 equivalent daughter contributions (EDC) or more were included. In order to assess changes in genetic correlation over time, parameter estimation was done using three different datasets. The first one included all bulls that were born since 1985 (18 860 bulls with 413 common bulls). The second one included bulls from the first dataset that were born since 1990 (15 504 bulls with 257 common bulls). The third one included bulls from the second dataset that were born since 1995 (9329 bulls with 45 common bulls). Although the number of common bulls in this last dataset was reduced, the two countries were well connected through the sires of bulls: 7110 bulls had paternal half-sibs in the other country.
YD of cows for YD-MACE
Data from the French (November 2006) and the German (February 2007) national genetic evaluations were chosen for implementing the YD-MACE model. There were 1 550 642 and 3 680 288 Black and White Holstein cows with YD available from Germany and France, respectively. After combining both datasets, there were 5 230 930 cows and only one of them had data in both countries. The total number of animals in the joint cow pedigree file related with animals having data was 9 745 489 with 48 unknown parents genetic groups.
The general outline of the multiple-trait MACE model
The following statistical model was applied

where qij is the vector of pre-corrected records of the ith animal in country j, bj is the vector of birth year effects in the jth country, Xij is known design matrices relating the observations animal i in country j to birth year effects of jth country, uij is a vector of additive genetic effects of animal i in country j and eij is a vector of residual effects. Adding a birth year effect in the model provided more robust genetic trends (Ducrocq et al., Reference Ducrocq, Delaunay, Boichard and Mattalia2003; Lassen et al., Reference Lassen, Sorensen, Madsen and Ducrocq2007). The pre-corrected records were DYD of bulls in the DYD-MACE evaluation and YD of cows in the YD-MACE evaluation.
The (co)variance matrix of genetic effects of the m countries and its inverse are denoted as:
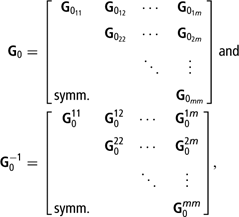
where m is the number of countries,  is the original genetic (co)variance matrix of country j and
 is the genetic covariance matrix between countries j and k. As usually considered in MACE, an animal has data in only one country so the residual correlation between countries can be assumed to be 0. The inverse of error (co)variance matrix of animal i in country j is:

where Ψij is the EDC matrix for animal i in country j. The multiple-trait EDC procedure (Liu et al., Reference Liu, Reinhardt, Bünger and Reents2004a) can be used to approximate matrix Ψ for each animal.
The mixed model equations
The mixed model equations of model (1) consist of equations for additive genetic effects of animals and fixed effects of birth year. Ignoring pedigree contributions, the equations corresponding to animal i are:

where a ii is the diagonal element of animal i in the inverse of the numerator relationship matrix A, and Δij represents the right-hand-side (RHS) of animal i in country j. Note that Δij is not dependent from across-country correlations ( ) and is a function of country-specific information (qij,
 , bj) only. Formula 24 in the paper by Liu et al. (Reference Liu, Reinhardt, Bünger and Reents2004a) can be used to calculate Δij. Equations for the fixed effects of birth year in model (1) are:
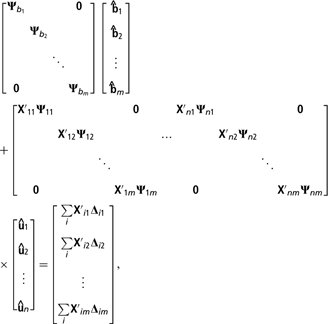
where n is the total number of animals with observation,  represents EBV of animal i in all m countries and
 with nj being the number of animals with observation in country j.
The equation system was simplified in our study because only one trait per country was allowed in order to perform single-trait MACE models (ST-MACE) for each type trait. In this case, all terms in equations (4) and (5) above became scalars except the ones related to birth year effect: the matrix Ψb j and the vectors bj and Xij. The equation system was solved using a pre-conditioned conjugate gradient algorithm and an iteration on data technique (Liu et al., Reference Liu, Reinhardt and Reents2004b). The convergence criterion, defined as the logarithm of the sum of squares of differences in solutions between two consecutive rounds of iteration divided by the sum of squares of solutions in last round of iteration, was set to −10.
Estimation of across-country genetic correlations
An approximate expectation maximization restricted maximum likelihood (EM-REML) method (Liu et al., Reference Liu, Reinhardt and Reents2004b) was used to estimate the across-country genetic correlation for each type traits. It was considered as converged when the change in the across-country genetic correlation estimates was less than 10−6 between two consecutive rounds of iteration. Current estimated Interbull correlations were used as starting values. The unbiasedness of the approximate EM-REML method was validated with simulated data for single and multiple-trait MACE (MT-MACE) models (Tarres et al., Reference Tarres, Liu, Ducrocq, Reinhardt and Reents2007a).
Results
Pearson correlation of DYD with national EBV
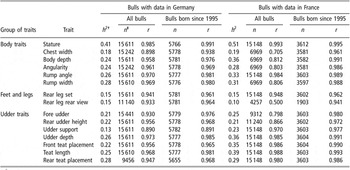
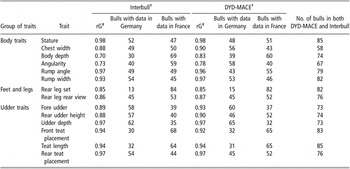
The validation of the DYD values was done by calculating their Pearson’s correlations with the national EBV derived from national cow evaluations. German DYD had high correlation with national EBV ranging from 0.930 for fore udder to 0.985 for stature (Table 1). The higher the heritability of the trait, the higher the correlations. Only two traits were out of this range: chest width (0.898) and udder support (0.890). When only bulls born since 1995 were included, the correlations were higher, ranging from 0.938 for chest width to 0.991 for stature (Table 1), except for udder support (0.891). This trait was well defined in Germany, but the implementation and interpretation vary among classifiers more than for other type traits. Therefore, this trait was excluded for further analyses.
Pearson correlation (r) of daughter yield deviations (DYD) with national estimated breeding values (EBVs) of Holstein bulls for type traits

†h 2 denotes heritability used in the national evaluations.
‡n denotes number of bulls with records.
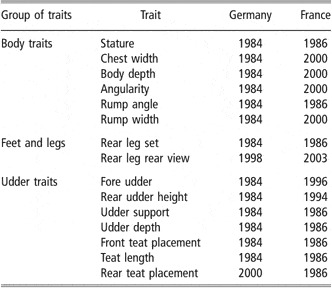
French DYD had high correlation with national EBV for traits evaluated for a long period of time in France (stature, rump angle, rear leg set, udder support, udder depth, front teat placement, teat length and rear teat placement), ranging from 0.948 for rear leg set to 0.993 for stature (Table 1). The other type traits (chest width, body depth, angularity, rump width, rear leg rear view, fore udder and rear udder height) were included later in the French type classification system (most of them since 2000) (Table 2). For these traits, French DYD had low correlations with national EBV ranging from 0.500 for rear leg rear view to 0.812 for body depth (Table 1). These correlations were especially low for the bulls born until the end of 1995. When these bulls were not included, the correlations reached high values ranging from 0.941 for rear leg rear view to 0.991 for body depth.
Year when definitionFootnote † of each trait was updated in German and French dairy cattle

† These definitions are set by each national herdbook organization or for the Holstein breed, by the World Holstein–Friesian Federation (WHFF). For information about WHFF definitions see Hamoen (Reference Hamoen2005). For information about German type classification system go to Deutscher Holstein Verband (Reference Deutscher and Holstein2007). For information about French type classification system go to Prim’holstein France (2007).
Estimated genetic correlations across Germany and France
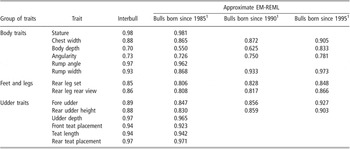
Parameter estimation for traits evaluated for a long period of time in France was done using the first dataset. Estimated across-country genetic correlations were high, ranging from 0.923 for front teat placement to 0.981 for stature (Table 3), except for rear leg set (0.806). These correlations were similar to the Interbull ones. For traits introduced more recently in France, the genetic correlations estimated using the first dataset ranged from 0.55 for body depth to 0.868 for rump width and were lower than the Interbull values (Table 3). These correlations increased as older bulls were discarded by using the second and especially the third dataset for parameter estimation. In this case (including only bulls born since 1995), the estimated across-country genetic correlations reached values much higher than the Interbull ones (Table 3). This applies to almost all type traits but specially for the ones with the lowest correlations, i.e. body depth (0.83 v. 0.70) and angularity (0.78 v. 0.73).
Estimated genetic correlations between Germany and France for type traits estimated using an approximate restricted maximum likelihood (REML) software

EM-REML = expectation maximization restricted maximum likelihood.
1Bulls with fewer than 30 equivalent daughter contributions were discarded.
Binational DYD-MACE genetic evaluations
A birth year effect was included in the binational evaluations to check the validity of national genetic trends as recommended by Ducrocq et al. (Reference Ducrocq, Delaunay, Boichard and Mattalia2003) and Lassen et al. (Reference Lassen, Sorensen, Madsen and Ducrocq2007). For almost all type traits, the year effects were small indicating that in general there was no bias in the genetic trend estimated in national evaluations. Small differences in annual genetic trend between 1% and 2.5% of genetic standard deviation were only detected for chest width, body depth, rear leg set, udder support and rear teat placement on the German scale, and for rear leg set, udder support and rear teat placement on the French scale (results not shown).
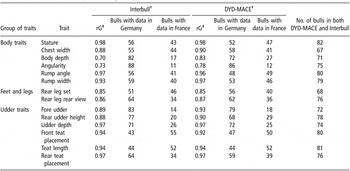
The DYD-MACE binational evaluation provided EBVs on the German and French scales for all bulls, which could be compared to EBVs published by Interbull. After discarding unofficial bulls and bulls born until the end of 1985, top 100 rankings on the German and French scale were obtained based on DYD-MACE and Interbull breeding values. For traits evaluated for a long period of time, the DYD-MACE top-100 list had around 80 bulls also present in the Interbull rankings, both on the German (Table 4) and French scales (Table 5). The proportions of German and French bulls in the DYD-MACE top-100 lists were also similar to the proportions in the Interbull top-100 lists (Tables 4 and 5).
Number of bulls in the top 100 rankings for type traits on the German scale

DYD-MACE = daughter yield deviations multiple across-country evaluations.
There were two different rankings based on DYD-MACE and Interbull EBV (estimated breeding values).
†In the rankings there were also bulls with data in both countries (not shown).
‡Estimated across-country genetic correlation among Germany and France.
Number of bulls in the top 100 rankings for type traits on the French scale

DYD-MACE = daughter yield deviations multiple across-country evaluations.
There were two different rankings based on DYD-MACE and Interbull EBV (estimated breeding values).
†In the rankings there were also bulls with data in both countries (not shown).
‡Estimated across-country genetic correlation among Germany and France.
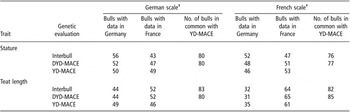
For traits introduced more recently in France, the DYD-MACE top-100 list had around 70 bulls present also in the Interbull rankings, on both the German and French scales (Tables 4 and 5). The proportions of bulls from the two countries were similar for almost all traits. The differences can be partially explained by the higher genetic correlations assumed in the DYD-MACE evaluation that increased the presence of foreign bulls on each country scale.
Binational YD-MACE genetic evaluations
The binational evaluation using YD of cows was tested for stature and teat length, but it will be generalized in the future to other type traits. A birth year effect was included to correct for potential bias in genetic trend. The slopes of the birth year effect were small and similar to the values obtained in the DYD-MACE evaluation (results not shown).
The YD-MACE binational evaluation provided EBVs for all bulls and cows on the German and French scales. The EBVs of bulls were sorted to obtain top-bull lists on both scales that were comparable to the Interbull and DYD-MACE lists. The YD-MACE top-100 bull list for stature and teat length had around 80 bulls present in the Interbull and also the DYD-MACE lists, on both scales (Table 6). The proportions of German and French bulls in the YD-MACE top-100 bull lists were also similar to the proportions in the Interbull and DYD-MACE lists, both for stature and teat length (Table 6). The EBVs of cows were also sorted to obtain top-cow lists on both scales. However, in this case it was difficult to compare the proportion of cows with data from each country because of the different number of cows with data, and the different heritability of the traits in both countries (results not shown).
Number of bulls in the top 100 bull rankings for stature and teat length on the German and French scale

DYD-MACE = daughter yield deviations multiple across-country evaluations; YD-MACE = yield deviations multiple across-country evaluations.
There were three different rankings based on Interbull, DYD-MACE and YD-MACE breeding values.
†In the rankings there were also bulls with data in both countries (not shown).
Discussion
Binational evaluations from Germany and France were done separately for each type trait with ST-MACE model. Although evaluations were performed using pre-corrected records instead of deregressed proofs, it is not our intention to try to rigorously compare both methods because often they give the same (or very similar) results, especially on large datasets. Some people have done that in the past, with debatable conclusions (Madsen et al., Reference Madsen, Sorensen and Mark2001; Madsen and Mark, Reference Madsen and Mark2002; Ducrocq et al., Reference Ducrocq, Delaunay, Boichard and Mattalia2003). However, pre-corrected records have some advantages, in particular with the possibility to apply more robust models (see Lassen et al. (Reference Lassen, Sorensen, Madsen and Ducrocq2007) for convincing arguments about the superiority of such models, not applicable to deregressed proofs) or to extend to animal models based on cow performances. So pre-corrected records here are an improvement and our intention has been to show that implementation is feasible at international level (even though only two countries are considered here), and gives interesting results, most of the time (but not always) quite consistent with Interbull results. The identification of the instances where these results are different from Interbull ones’ is the major contribution of this paper, rather than the actual values of the correlations. Some of these results were already presented in the Interbull congress (Tarres et al., Reference Tarres, Liu, Ducrocq, Reinhardt and Reents2007b).
Changes in genetic correlation over time
Estimated genetic correlations across Germany and France were very consistent with those of Interbull, although none of the datasets are of exactly the same time period as used for Interbull evaluations. For traits introduced more recently in France, increasing genetic correlations over time were observed. Using newer data led to higher genetic correlation estimates between Germany and France. This can be explained because more recent cows are classified in a more unified way, i.e. more homogeneous, than the older ones. De Jong and Harbers (Reference De Jong and Harbers2002) also showed that when there was a redefinition of the scoring system for a type trait, the average correlation with other countries increased by omitting data scored with an earlier definition. Consistency of trait definition across time can be assessed using DYD (Van Pelt et al., Reference Van Pelt, Van der Linde, Harbers and De Jong2006). The national genetic evaluations of both countries (especially France) can be improved by removing records of cows scored with an earlier definition rather than by removing bulls born before 1995. It seems to be reasonable to exclude records of cows scored with an earlier definition from the national genetic evaluations and use the resulting DYD of bulls or YD of cows for a ST-MACE model. It would be easily applicable and useful to remove potential bias in DYD of bulls and YD of cows attributable to simultaneously evaluating records scored with different definition. However, Tsuruta et al. (Reference Tsuruta, Misztal and Lawlor2004) argued that genetic parameters could change over time not only by redefinition of the recording system but also by other factors such as selection, migration, segregation, mutation and inbreeding.
Omitting older data is a way to deal with changes in genetic parameters over time for type traits in international bull comparisons without changing national evaluations. Currently, most national genetic evaluations for type traits in Holsteins are conducted with a multiple-trait model that assumes that additive genetic and environmental variances, and genetic and environmental correlations among traits are constant over time. In the future, countries should consider changes over time in their genetic evaluations. De Jong and Harbers (Reference De Jong and Harbers2002) proposed to treat older and newer scores as different traits in a multiple-trait national evaluation. Tsuruta et al. (Reference Tsuruta, Misztal and Lawlor2004) estimated changes in genetic parameters for productive life, production and selected type traits over time using random regression (RR) models. They compared estimates of variance components and genetic correlations among traits with those estimated with a multiple-trait interval model, which assumed a distinct trait for every 3-year interval. As verified by simulation (Tsuruta et al., Reference Tsuruta, Misztal, Lawlor and Klei2003), such estimation using RR can be successful but changes in genetic parameters should be gradual over time and residual variances need to be modelled as heterogeneous. Uribe et al. (Reference Uribe, Schaeffer, Jamrozik and Lawlor2000) and Tsuruta et al. (Reference Tsuruta, Misztal, Klei and Lawlor2002) also performed genetic evaluations of dairy cattle for type traits using RR models, but in this case to take into account age-specific changes (i.e. the trajectory was over the age of cow when classified, rather than over the period of classification).
Binational genetic evaluations
Once the genetic correlations were estimated, binational evaluations using DYD of bulls were performed for each type trait. Bulls’ rankings differed somewhat from Interbull rankings but a similar proportion of bulls was found from each country in the top lists. Binational evaluations were extended to animal models based on cow performances (YD) for stature and teat length in order to show that they are feasible. This was very appealing because the more computationally demanding full multi-trait model, i.e. two-country animal model with original performance data, may not be feasible using these large datasets, especially if in the future more countries are added to such evaluation. The cow rankings obtained are influenced by the differences in heritability and the number of cows from each country. In most cases, this favours French cows because type traits had higher heritabilities and bulls’ EBVs were often more reliable in France because of a higher number of scored daughters per bull.
Finally, type traits are currently evaluated in both countries in three blocks of traits (udder/feet and legs/other traits). Within each block, a multiple-trait model is used and genetic correlations among traits are considered. The information of other correlated type traits is included using the genetic correlations to the other traits in the same block. In contrast, in the ST-MACE only one trait is evaluated each time. In order to avoid these differences between models for national and international evaluations, an MT-MACE model allowing a variable number of correlated traits per country should be used in the future. In such case, multiple-trait DYD and multiple-trait EDC should be obtained from national genetic evaluations (Liu et al., Reference Liu, Reinhardt, Bünger and Reents2004a).
Conclusions
The estimated genetic correlations for type traits between Germany and France appear to be reasonably consistent with what is observed by Interbull. This study shows that using data from more homogeneous type classification systems led to higher genetic correlation estimates between Germany and France for type traits. Higher genetic correlations will have a clear impact on re-ranking of sires and top lists for international bull comparison. International cow comparisons are possible if YD of cows are used as input data in MACE models.
Acknowledgements
The financial support by German Holstein Association (DHV) and Union Nationale des Coopératives d’Elevage et d’Insémination Animale (UNCEIA) of France is greatly appreciated. The colleagues from Vereinigte Informationssysteme Tierhaltung (VIT) (Wolfgang Ruten and Erik Pasman) and Institut de l’Elevage (Mickael Brochard and Stephanie Minery) are greatly acknowledged for providing data.