1. Introduction
It is well known that when a spherical droplet sediments under gravity in a viscous fluid, its shape remains spherical during the motion, and the drag is given by the classical Hadamard–Rybczynski equation. When surfactants are present, the surfactants can get swept to the back of the droplet and increase the drag through Marangoni effects (Palaparthi, Papageorgiou & Maldarelli Reference Palaparthi, Papageorgiou and Maldarelli2006). However, when the droplet's shape is perturbed by some external source during sedimentation, the droplet can form a thread or cavity and eventually fragment. This phenomenon plays a significant role in the breakup of emulsions, as well as improving heat and mass transfer between phases due to a sudden increase in surface area. This instability requires a finite deformation and hence is a highly nonlinear phenomenon.
The stability of different droplet shapes under gravity has been examined in several studies. The computational work by Pozrikidis (Reference Pozrikidis1990) and Koh & Leal (Reference Koh and Leal1989) first explored the stability of a clean viscous droplet translating through an unbounded fluid. Koh & Leal (Reference Koh and Leal1990) later experimentally investigated the impact of initial prolate and oblate perturbations on the evolution of the droplet shapes in the creeping flow limit. Their experimental results were found to be in good agreement with the numerical results from Koh & Leal (Reference Koh and Leal1989). Johnson & Borhan (Reference Johnson and Borhan2000) examined how surfactant transport alters the stability of droplet shapes and the formation of threads/cavities. Their numerical model considered non-ideal surfactant interactions and found that the surfactants have a destabilizing effect on droplet motion. Some numerical studies have also focused on examining the role of confinement on clean droplet motion (Martinez & Udell Reference Martinez and Udell1990; Pozrikidis Reference Pozrikidis1992). Borhan & Mao (Reference Borhan and Mao1992) investigated the effect of surfactant on a neutrally buoyant droplet's motion through a circular tube. The influence of bulk soluble surfactants on droplet motion through cylindrical capillaries in the Stokes flow limit was explored by Johnson & Borhan (Reference Johnson and Borhan2003).
In this study, we examine how surface rheology affects the stability of droplet shapes during sedimentation. Currently, there is an extensive literature on how surfactants affect droplet migration, coalescence, rotation, deformation and breakup in different domains of external flow types (extensional, shear and mixed flows), fluid interfaces and boundary conditions (Stone & Leal Reference Stone and Leal1990; Borhan & Mao Reference Borhan and Mao1992; Pawar & Stebe Reference Pawar and Stebe1996; Li & Pozrikidis Reference Li and Pozrikidis1997; Dai & Leal Reference Dai and Leal2008; Manor, Lavrenteva & Nir Reference Manor, Lavrenteva and Nir2008; Narsimhan & Shaqfeh Reference Narsimhan and Shaqfeh2010; Pawar et al. Reference Pawar, Caggioni, Ergun, Hartel and Spicer2011; Vannozzi Reference Vannozzi2012; Carroll & Gupta Reference Carroll and Gupta2014; Mandal, Bandopadhyay & Chakraborty Reference Mandal, Bandopadhyay and Chakraborty2015, Reference Mandal, Bandopadhyay and Chakraborty2016). Most of these studies focus on the effects that arise from surface concentration inhomogeneities (Marangoni effects) and the lowering of surface tension. However, the influence of surface viscosities and elasticities on these different phenomena (droplet rotation, migration, coalescence, deformation and breakup) remains less explored. In the case of more complex surface-active and polymeric agents (such as vesicles, lipid bilayers, polymersomes, solid particulates), it becomes essential to incorporate the effects of interfacial viscosity and elasticity to understand the dynamics of the system better. In recent years, there has been increasing interest in understanding the physics of systems with complex interfaces.
Droplet interfaces embedded with certain low molecular weight surfactants and proteins exhibit predominantly viscous responses. Eicosanol (a fatty alcohol), hexadecanol (a low molecular weight surfactant) and protein  $\beta$-casein (Brooks et al. Reference Brooks, Fuller, Frank and Robertson1999; Fuller & Vermant Reference Fuller and Vermant2012; Gunning et al. Reference Gunning, Kirby, Wilde, Penfold, Woodward and Morris2013; Verwijlen, Moldenaers & Vermant Reference Verwijlen, Moldenaers and Vermant2013) are some of the examples of surface-active agents that form highly viscous membranes. The mechanics of such interfaces can be described using the Boussinesq–Scriven law that provides an expression for the interfacial stresses that arise from viscous dissipation (i.e. surface viscosities) on a surface. The first computational analysis of the influence of surface viscosity on transient deformation of a droplet in a simple shear flow was presented by Pozrikidis (Reference Pozrikidis1994) using boundary element simulations. Their model considered only droplets with equal surface shear and dilatational viscosity; however, the steady-state behaviour could not be extracted due to numerical instability. The numerical study by Gounley et al. (Reference Gounley, Boedec, Jaeger and Leonetti2016) explored how both interfacial shear and dilatational viscosities alter the deformation and stability of a single droplet subjected to shear flow. Using the small deformation perturbation theories developed by Narsimhan (Reference Narsimhan2019), Singh & Narsimhan (Reference Singh and Narsimhan2020) examined how both these interfacial viscosities alter the droplet deformation and breakup in shear and extensional flows. The influence of interfacial shear viscosity was found to reduce droplet deformation and increase the critical capillary number compared with a clean droplet. In contrast, the interfacial dilatational viscosity was found to have the opposite effect – i.e. it increases the droplet deformation and reduces the critical capillary number compared with the clean droplet (Gounley et al. Reference Gounley, Boedec, Jaeger and Leonetti2016; Narsimhan Reference Narsimhan2019; Singh & Narsimhan Reference Singh and Narsimhan2020). The effect of pressure-dependent interfacial viscosities on droplet stability in shear flow was investigated by Luo, Shang & Bai (Reference Luo, Shang and Bai2019). Several experimental studies also focused on measuring the interfacial rheological properties of fluid–fluid surfaces (Miller et al. Reference Miller, Ferri, Javadi, Krägel, Mucic and Wüstneck2010; Choi et al. Reference Choi, Steltenkamp, Zasadzinski and Squires2011; Fuller & Vermant Reference Fuller and Vermant2012).
In terms of droplet sedimentation, Levan (Reference Levan1981) first investigated the impact of surface viscosity on an undeformed spherical droplet's translation speed under an external force. They found that the translation speed with interfacial viscosity remains the same as that of a clean droplet with a modified viscosity ratio and only depends on the surface dilatational viscosity. The surface shear viscosity plays no role in the translation dynamics of an undeformed spherical droplet. Narsimhan (Reference Narsimhan2018) provided the physical insights behind these observations. Dehghani & Narsimhan (Reference Dehghani and Narsimhan2019) quantified the drag of a spherical droplet with a viscoelastic membrane translating in unsteady Stokes flow. They observed the hydrodynamic drag to be the same as that of a clean droplet with interior viscosity replaced with an effective frequency-dependent surface dilatational moduli. Using the regular perturbation expansion for low surface Péclet numbers, Dandekar & Ardekani (Reference Dandekar and Ardekani2020) investigated the impact of interfacial viscosity on the migration of a spherical droplet in Poiseuille flow. This study aims to explore how the presence of interfacial viscosities impact the stability of a perturbed droplet translating under gravity, which has not been accounted for in previous studies examining droplet translation.
2. Method of analysis
2.1. Problem statement
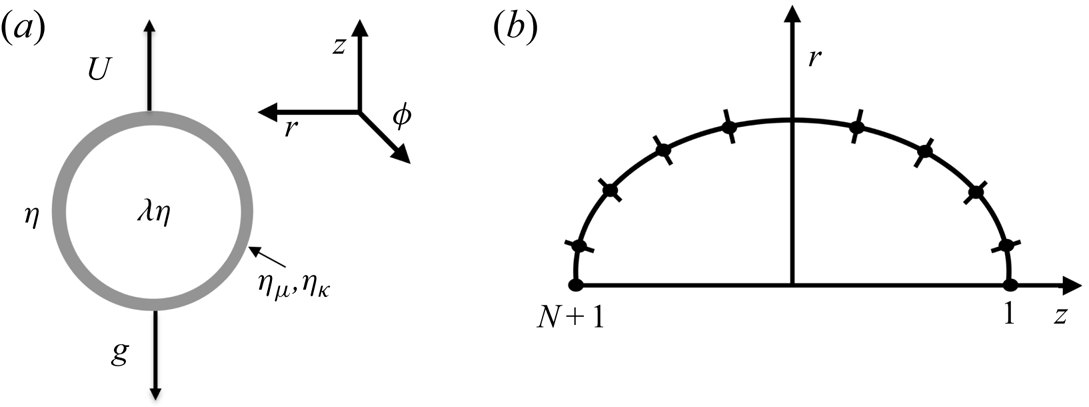
We examine how interfacial viscosity influences the stability of an initially perturbed droplet sedimenting through an unbounded stagnant fluid. Figure 1 $(a)$ shows the schematic of the problem set-up. The viscosity of the internal fluid is
 $\lambda \eta$, and the external fluid is
 $\eta$. The gravitational force is acting in the negative
 $z$-direction. The droplet interface is covered with a thin layer of insoluble surfactant and has a surface shear viscosity
 $\eta _\mu$ and a surface dilatational viscosity
 $\eta _\kappa$. The initial perturbation of the droplet can be in the form of a prolate or an oblate ellipsoid. The Taylor deformation parameter
 $\varDelta$ characterizes the initial deformation
 \begin{equation} \varDelta = \frac{L-B}{L+B}, \end{equation}
where  $L$ is the length of the major axis and
 $B$ is the length of the minor axis. Positive values of
 $\varDelta$ imply that the droplet's initial perturbation is in the form of a prolate ellipsoid, whereas negative values are for initial oblate perturbations.
 $(a)$ Problem set-up.
 $(b)$ Schematic of the droplet interface (axisymmetric about the
 $z$-axis) discretized into
 $N+1$ elements connected by the
 $N+1$ nodes in the
 $z$–
 $r$ azimuthal plane.

2.2. Non-dimensionalization and governing equations
We non-dimensionalize lengths by the radius  $R$ of a spherical droplet that has equivalent volume to the initially perturbed droplet. All velocities are non-dimensionalized by the translational speed of an undeformed spherical droplet (Levan Reference Levan1981; Narsimhan Reference Narsimhan2018)
 \begin{equation} U_T = M_D \frac{g\Delta\rho R^2}{\eta}; \quad M_D = \frac{2+2\lambda^\ast}{6+9\lambda^\ast}, \end{equation}
where  $\Delta \rho = \rho _{in}-\rho _{out}$ is the difference between the inner and outer fluid densities, g is the gravitational acceleration constant,
 $M_D$ is a non-dimensional mobility coefficient and
 $\lambda ^\ast = \lambda + ({2}/{3})({\eta _\kappa }/{R\eta })$ is a modified viscosity ratio that depends on the surface viscosity. Time is non-dimensionalized by
 $R/U_T$, bulk stresses by
 $\eta U_T/R$ and surface stresses by
 $\eta U_T$.
The Stokes and continuity equation describe the fluid dynamics inside and outside of the droplet. We model the interfacial rheology of the droplet using the Boussinesq–Scriven constitutive relationship (Boussinesq Reference Boussinesq1913; Scriven Reference Scriven1960).
The governing equation and boundary conditions in dimensionless form are given as follows:
 $$\begin{align} \lambda\nabla^2\boldsymbol{u}^{in} &= \boldsymbol{\nabla} p^{in}, \quad \boldsymbol{\nabla}\boldsymbol{\cdot} \boldsymbol{u}^{in}=0, \end{align}$$
 $$\begin{align}\nabla^2\boldsymbol{u}^{out} & = \boldsymbol{\nabla} p^{out}, \quad \boldsymbol{\nabla}\boldsymbol{\cdot} \boldsymbol{u}^{out}=0. \end{align}$$
In the above expressions, p represents the dynamic pressure. At the droplet interface, there exists continuity of velocity
 \begin{equation} \boldsymbol{u}^{in} = \boldsymbol{u}^{out}, \end{equation}
and the viscous traction jump from the fluid flow  $(\boldsymbol {\tau }^{in} - \boldsymbol {\tau }^{out})\boldsymbol {\cdot } \boldsymbol {n}$ balances the tractions from interfacial viscosities, gravity and surface tension
 \begin{equation} (\boldsymbol{\tau}^{in} - \boldsymbol{\tau}^{out})\boldsymbol{\cdot} \boldsymbol{n} = \boldsymbol{f_\mu} + \boldsymbol{f_\kappa} - \frac{1}{M_D}(\boldsymbol{e_z}\boldsymbol{\cdot}\boldsymbol{x_s})\boldsymbol{n} + \frac{1}{Ca} \left( \boldsymbol{\nabla_s}\sigma - \sigma\boldsymbol{n}\boldsymbol{\nabla}\boldsymbol{\cdot}\boldsymbol{n} \right). \end{equation}
In the above equation, n is the outward pointing normal vector, the quantity  $\sigma$ is the dimensionless surface tension normalized by
 $\sigma _c$, which is the surface tension of a clean interface without surfactant. The quantity
 $Ca= U_T \eta /\sigma _c$ is the capillary number. The unit vector
 $\boldsymbol {e_z}$ is in the
 $z$-direction and
 $\boldsymbol {x_s}$ is the position vector of a point on the interface. Lastly, the surface force densities
 $\boldsymbol {f_\mu }$ and
 $\boldsymbol {f_\kappa }$ are the tractions from the interfacial shear and dilatational viscosities, given by the Boussinesq–Scriven constitutive relationship (Boussinesq Reference Boussinesq1913; Scriven Reference Scriven1960):
 \begin{gather} \boldsymbol{f_\kappa} = \boldsymbol{\nabla_s}\boldsymbol{\cdot}[Bq_\kappa \boldsymbol{\mathsf{P}}(\boldsymbol{\nabla_s}\boldsymbol{\cdot}\boldsymbol{u_s})], \end{gather}
 \begin{gather} \boldsymbol{f_\mu} ={-} \boldsymbol{\nabla_s}\boldsymbol{\cdot}[Bq_\mu \boldsymbol{\mathsf{P}}(\boldsymbol{\nabla_s}\boldsymbol{\cdot}\boldsymbol{u_s}) - \boldsymbol{\mathsf{P}}\boldsymbol{\cdot}(\boldsymbol{\nabla_s}\boldsymbol{u_s} + {\boldsymbol{\nabla_s}\boldsymbol{u_s}}^T)\boldsymbol{\cdot}\boldsymbol{\mathsf{P}}]. \end{gather}
In the above expressions,  $Bq_{\mu }={\eta _\mu }/{R\eta }$ is the Boussinesq number for the surface shear viscosity, and
 $Bq_{\kappa }={\eta _\kappa }/{R\eta }$ is the Boussinesq number for the surface dilatational viscosity. The quantity
 $\boldsymbol {u_s}$ is the interfacial velocity,
 $\boldsymbol{\mathsf{P}}=\boldsymbol{\mathsf{I}}-\boldsymbol {nn}$ is the projection operator on the surface and
 $\boldsymbol {\nabla _{s}} = \boldsymbol{\mathsf{P}}\boldsymbol {\cdot }\boldsymbol {\nabla }$ is the surface gradient. We also define additional dimensionless parameters
 $Bq$ and
 $\lambda _{ds}$ as they represent an alternative way of characterizing the interfacial stresses;
 $Bq= Bq_\mu + Bq_\kappa$ represents the ratio of the total interfacial stresses to the bulk viscous stresses, and
 $\lambda _{ds} = {\eta _\kappa }/{\eta _\mu }$ represents the ratio of the surface dilatational viscosity to the surface shear viscosity.
The evolution of the surfactant concentration along the droplet's surface is taken into account using the time-dependent convective–diffusion equation (Stone Reference Stone1990)
 \begin{equation} \frac{\partial\varGamma}{\partial t} + \boldsymbol{\nabla_s} \boldsymbol{\cdot}(\varGamma \boldsymbol{u_t}) + \varGamma (\nabla_s \boldsymbol{\cdot}\boldsymbol{n})(\boldsymbol{u_s}\boldsymbol{\cdot}\boldsymbol{n}) = \frac{1}{M_D Pe_s}\nabla_s^2\varGamma. \end{equation}
In the above equation,  $\varGamma$ is the dimensionless surfactant concentration (normalized by the initial surfactant concentration
 $\varGamma _0$),
 $\boldsymbol {u_t}$ is the tangential component of the interfacial velocity and
 $\boldsymbol {n}$ is the outward-pointing normal vector. The dimensionless parameter
 $Pe_s={gR^3\Delta \rho }/{\eta D_s}$ is the surface Péclet number, where
 $D_s$ is the surface diffusivity;
 $Pe_s$ denotes the ratio of surface convection of surfactant to surface diffusion. In this study, we employ a linear surface equation of state to relate the surface tension to the surfactant concentration
 \begin{equation} \sigma = 1-\beta\varGamma. \end{equation}
In the above expression, the dimensionless parameter  $\beta =\varGamma _0 R_G T/\sigma _c$ denotes the surface elasticity number, where
 $R_G$ is the ideal gas constant and
 $T$ is the absolute temperature.
The interfacial viscosity can vary locally along the surface of the droplet depending on how the surfactant redistributes on the interface as the droplet deforms. The surface viscosity has been found to vary strongly with surface pressure in several experimental studies (Kurtz, Lange & Fuller Reference Kurtz, Lange and Fuller2006; Kim et al. Reference Kim, Choi, Zasadzinski and Squires2011; Fuller & Vermant Reference Fuller and Vermant2012; Kim et al. Reference Kim, Choi, Zell, Squires and Zasadzinski2013; Samaniuk & Vermant Reference Samaniuk and Vermant2014). Here, we assume a formulation similar to Manikantan & Squires (Reference Manikantan and Squires2017) to capture the surface viscosity dependence on surface pressure  $\varPi$, in dimensional form
 \begin{align} \eta_{\kappa}^\pm &= \eta_{\kappa}^0\exp\left({\pm \frac{\varPi-\varPi_0}{\varPi_c}}\right), \end{align}
 \begin{align} \eta_{\mu}^\pm &= \eta_{\mu}^0\exp\left({\pm \frac{\varPi-\varPi_0}{\varPi_c}}\right). \end{align}
The ‘ $+$’ sign denotes a
 $\varPi$-thickening surfactant while a ‘
 $-$’ sign is for
 $\varPi$-thinning surfactant;
 $\varPi _0$ is the reference surface pressure, and
 $\eta ^0_\mu$ and
 $\eta ^0_\kappa$ denotes the shear and dilatational surface viscosity at
 $\varPi _0$;
 $\varPi _c$ is the pressure scale over which significant viscosity changes occur (Manikantan & Squires Reference Manikantan and Squires2017).
The surface pressure  $\varPi$ can be related to the dimensional surface tension
 $\sigma ^\prime$ through the expression
 \begin{equation} \varPi = \sigma_c - \sigma^\prime, \end{equation}
where  $\sigma _c$ is the surface tension corresponding to the clean interface.
In the dimensionless form, (2.10) and (2.11) can be written as
 \begin{align} Bq_{\kappa}^\pm &= Bq_{\kappa}^0\exp\left({\pm \frac{\sigma_0-\sigma}{\varPi_c^\ast}}\right), \end{align}
 \begin{align} Bq_{\mu}^\pm &= Bq_{\mu}^0\exp\left({\pm \frac{\sigma_0-\sigma}{\varPi_c^\ast}}\right), \end{align}
where  $\varPi _c^\ast$ is the ratio of surface pressure scale
 $\varPi _c$ to surface tension of a clean interface
 $\sigma _c$ and
 $\sigma _0$ is the non-dimensional surface tension at reference surface pressure
 $\varPi _0$.
The surface shear viscosity of insoluble viscous monolayer of eicosanol reduces from  $\eta _{\mu } \sim 80$ to
 $4 \,\mathrm {\mu }\textrm {N}\,\textrm {s}\,\textrm {m}^{-1}$ as the surface pressure increases from
 $\varPi \sim 8$ to
 $15 \, \textrm {mN}\,\textrm {m}^{-1}$ (Brooks et al. Reference Brooks, Fuller, Frank and Robertson1999; Kurtz et al. Reference Kurtz, Lange and Fuller2006; Zell et al. Reference Zell, Nowbahar, Mansard, Leal, Deshmukh, Mecca, Tucker and Squires2014). Surfactant hexadecanol forms a purely viscous monolayer with surface shear viscosity
 $\eta _{\mu } \sim 10^3\,\mathrm {\mu }\textrm {N}\,\textrm {s}\,\textrm {m}^{-1}$ at the air–water interface (Verwijlen et al. Reference Verwijlen, Moldenaers and Vermant2013). The surface viscosity of the DPPC (dipalmitoylphosphatidylcholine) monolayer at the air–water interface exponentially decreases with surface pressure with the surface pressure scale
 $\varPi _c$
 $\sim 6 - 8 \, \textrm {N}\,\textrm {m}^{-1}$ (Kim et al. Reference Kim, Choi, Zasadzinski and Squires2011; Hermans & Vermant Reference Hermans and Vermant2014; Manikantan & Squires Reference Manikantan and Squires2017). Based on the droplet size (
 $100 - 1000\,\mathrm {\mu }\textrm {m}$) and exterior fluid viscosity (
 $1 - 10\,\textrm {m}\,\textrm {N}\,\textrm {s}\,\textrm {m}^{-2}$), the value of Boussinesq number
 $Bq$ can range from
 $\sim {\textit{O}}(1)-{\textit{O}}(10)$, and the non-dimensional surface pressure scale
 $\varPi _c^\ast$ can range from
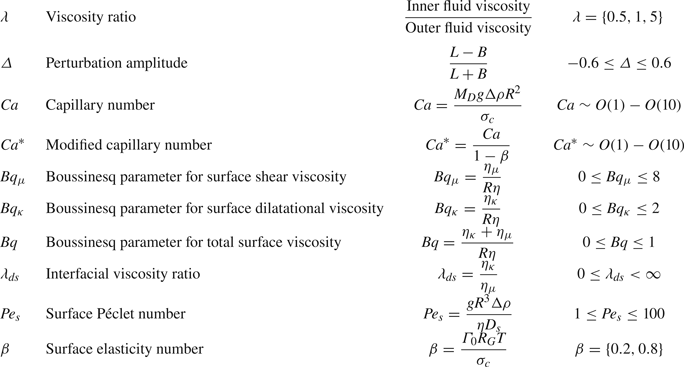
 $\sim 0.05-0.5$ for different types of fluid interfaces. The dimensionless parameters, along with the descriptions and the ranges explored in this study, are listed in table 1. Due to numerical instabilities encountered at large values of
 $Bq_\kappa$ in this study, we set the dilatational Boussinesq parameter in the range 0–2.
Dimensionless parameters.

2.3. Boundary-integral method
The motion of the droplet is axisymmetric about the  $z$-axis. An approach similar to Pozrikidis (Reference Pozrikidis1990) is adopted to formulate the problem. In the axisymmetric domain, the boundary-integral equation for the interfacial velocity
 $\boldsymbol {u_s}$ is (Pozrikidis Reference Pozrikidis1990; Pozrikidis et al. Reference Pozrikidis1992)
 \begin{align} \boldsymbol{u_s}(\boldsymbol{x_0}) &={-}\frac{1}{4{\rm \pi}(1+\lambda)} \int_C \boldsymbol{\mathsf{M}}(\boldsymbol{x, x_0}) \boldsymbol{\cdot} [[\boldsymbol{\tau} \boldsymbol{\cdot}\boldsymbol{n}]] \,\textrm{d}l(\boldsymbol{x})\notag\\ &\quad + \frac{1}{4{\rm \pi}}\frac{1-\lambda}{1+\lambda}\int_C^{PV }\boldsymbol{\mathsf{q}}(\boldsymbol{x, x_0}) \boldsymbol{\cdot} \boldsymbol{u_s}(\boldsymbol{x}) \,\textrm{d}l(\boldsymbol{x}), \end{align}
where  $\textrm {d}l$ is the differential arclength along the droplet contour and
 $\boldsymbol{\mathsf{M}}$ and
 $\boldsymbol{\mathsf{q}}$ represent the single-layer and double-layer potentials, respectively. The expressions for
 $\boldsymbol{\mathsf{M}}$ and
 $\boldsymbol{\mathsf{q}}$ can be found in Pozrikidis et al. (Reference Pozrikidis1992). Also,
 $[[\boldsymbol {\tau } \boldsymbol {\cdot }\boldsymbol {n}]]$ represents the jump in traction at the droplet interface
 \begin{equation} [[\boldsymbol{\tau} \boldsymbol{\cdot}\boldsymbol{n}]] = (\boldsymbol{\tau}^{out} - \boldsymbol{\tau}^{in})\boldsymbol{\cdot}\boldsymbol{n}. \end{equation}
All quantities are expressed in polar cylindrical coordinates  $(z, r, \phi )$.
As shown in figure 1 $(b)$, the droplet interface is discretized into
 $N$ boundary elements connecting
 $N+1$ nodes. The position vector
 $\boldsymbol {x}=[z(s),\ r(s) \cos \phi ,\ r(s) \sin \phi ]$ on the droplet surface is parameterized in terms of angle
 $0 < \phi < {\rm \pi}$ and coordinate
 $s$ using the cubic spline procedure described in Pozrikidis (Reference Pozrikidis2002). Briefly, we denote
 $s_i$ as the polygonal arclength values at the
 $N+1$ nodal positions
 $z_i$ and
 $r_i$
 \begin{equation} s_i = s_{i-1} + \sqrt{(z_{i}-z_{i-1})^2 + (r_{i}-r_{i-1})^2}, \quad s_0=0. \end{equation}
We then represent  $z(s)$ and
 $r(s)$ on the
 $i$th element in parametric form as follows:
 \begin{gather} z(s) = a_x^i(s-s_i)^3 + b_x^i(s-s_i)^2 + c_x^i(s-s_i) + z_i, \end{gather}
 \begin{gather} r(s) = a_y^i(s-s_i)^3 + b_y^i(s-s_i)^2 + c_y^i(s-s_i) +r_i, \end{gather}
where  $\{a_x^i,b_x^i,c_x^i, a_y^i,b_y^i,c_y^i\}$ are the coefficients of the cubic spline. The spline is subject to continuity of first and second derivatives as well as the condition
 $(z^\prime , r^\prime ) =(0,\pm 1)$ at the endpoints. As the number of elements become large,
 $s$ converges to the true arclength coordinate.
On the droplet surface, the normal vector  $\boldsymbol {n}$ and the tangent vector
 $\boldsymbol {t}$ in the parametrized form are defined as
 \begin{equation} \boldsymbol{n} = \frac{r^\prime\,\boldsymbol{e_z}-z^\prime\,\boldsymbol{e_r}}{ \sqrt{r^{\prime2} + z^{\prime2}} }, \quad \boldsymbol{t} = \frac{z^\prime\,\boldsymbol{e_z}+r^\prime\,\boldsymbol{e_r}}{ \sqrt{r^{\prime2} + z^{\prime2}} }, \end{equation}
where  $\boldsymbol {e_r}$ and
 $\boldsymbol {e_z}$ are the unit vectors in the
 $r$ and
 $z$ directions, respectively. The surface curvature
 $2H=\boldsymbol {\nabla _s}\boldsymbol {\cdot }\boldsymbol {n}$ is computed using the expression
 \begin{equation} 2\,H = \frac{z^\prime\,r^{\prime\prime}-r^\prime\,z^{\prime\prime}}{\left(z^{\prime2} + r^{\prime2}\right)^{{3}/{2}}} - \frac{z^\prime}{r\,\left(z^{\prime2} + r^{\prime2}\right)^{{1}/{2}}}. \end{equation}
All derivatives are with respect to the coordinate  $s$.
2.3.1. Numerical scheme: droplet with constant interfacial viscosities and constant surface tension
In this section, we outline the numerical procedure for the time evolution of the droplet shape for an interface with constant surface viscosity and constant surface tension. In the parameterized form, force density  $\boldsymbol {f_\sigma }$,
 $\boldsymbol {f_\mu }$ ,and
 $\boldsymbol {f_\kappa }$ can be written as
 \begin{gather} \boldsymbol{f_\sigma} ={-}\frac{1}{Ca}\,2H\,\boldsymbol{n}, \end{gather}
 \begin{gather} \boldsymbol{f_\mu} = Bq_\mu \left[ 2\,H\left( \boldsymbol{\nabla_s}\boldsymbol{\cdot}\boldsymbol{u_s}\right)\boldsymbol{n} - \boldsymbol{\nabla_s}\, \left(\boldsymbol{\nabla_s}\boldsymbol{\cdot}\boldsymbol{u_s}\right) +\boldsymbol{\nabla_s}\boldsymbol{\cdot} 2\, \boldsymbol{\mathsf{e}}_{\boldsymbol{\mathsf{s}}}\right ], \end{gather}
 \begin{gather} \boldsymbol{f_\kappa} = Bq_\kappa \left[ - 2\,H\left( \boldsymbol{\nabla_s}\boldsymbol{\cdot}\boldsymbol{u_s}\right)\boldsymbol{n} + \boldsymbol{\nabla_s}\, \left(\boldsymbol{\nabla_s}\boldsymbol{\cdot}\boldsymbol{u_s}\right) \right]. \end{gather}
In the above equations,  $H=(\boldsymbol {\nabla _s}\boldsymbol {\cdot }\boldsymbol {n})/2$ is the mean surface curvature,
 $\boldsymbol{\mathsf{e}}_{\boldsymbol{\mathsf{s}}}$ is the surface rate of the strain tensor defined as
 \begin{equation} \boldsymbol{\mathsf{e}}_{\boldsymbol{\mathsf{s}}} = \frac{u_z^\prime + u_r^\prime r^\prime }{z^{\prime2}+r^{\prime2}}\,\boldsymbol{t}\boldsymbol{t} + \frac{u_r}{r}\,\boldsymbol{e_\phi}\boldsymbol{e_\phi}, \end{equation}
and  $\boldsymbol {\nabla _s}\boldsymbol {\cdot }\boldsymbol {u_s}$ is the surface divergence of interfacial velocity defined as
 \begin{equation} \boldsymbol{\nabla_s}\boldsymbol{\cdot}\boldsymbol{u_s} = \frac{z^\prime\,u_z^\prime + r^\prime\,u_r^\prime}{\left(z^{\prime2} + r^{\prime2}\right)} + \frac{u_r}{r}, \end{equation}
where  $\boldsymbol {e_r}$,
 $\boldsymbol {e_\phi }$ and
 $\boldsymbol {e_z}$ are the unit vectors in the
 $r$,
 $\phi$ and
 $z$ directions, respectively.
We approximate the velocity vector  $\boldsymbol {u_s}=[u_z(s),\ u_r(s) \cos \phi ,\ u_r(s) \sin \phi ]$ at any interfacial location on the droplet via a cubic spline interpolation parametrized in terms of the cumulative polygonal arclength
 $s$ and subject to continuity of the first and second derivatives at the internal nodes. This spline parameterization is similar to what was described earlier for the position vector. To evaluate the single and double-layer line integrals, we first use cubic splines to compute the interfacial traction and position at the node locations, and then use six-point Gauss–Legendre quadrature assuming a linear variation of the nodal tractions and positions over each element on the droplet surface. We use the singularity subtraction methods as outlined in Pozrikidis (Reference Pozrikidis1990) to compute the singular integrals in
 $\boldsymbol{\mathsf{M}}$ and
 $\boldsymbol{\mathsf{q}}$ as
 $\boldsymbol {x}\to \boldsymbol {x_o}$. The resulting coupled system of equations (from boundary-integral equations and cubic spline interpolation) is solved using matrix inversion for the cubic spline coefficients of the velocity, which allow us to obtain the velocity and its first (
 $u_r^{\prime }$,
 $u_z^{\prime }$) and second (
 $u_r^{\prime \prime }$,
 $u_z^{\prime \prime }$) derivatives at the
 $N+1$ collocation points.
Starting from an initial droplet shape characterized by the Taylor deformation parameter  $\varDelta$, we evolve the droplet shape over time by following the steps described below:
(i) For a given droplet shape at time
 $t$, the velocity at time $t$ is evaluated using the boundary-integral equation (2.15).
(ii) Using a second-order Runge–Kutta scheme, the nodes on the droplet surface are advanced (using the nodes’ total normal velocity) to obtain the updated shape at time
$t + \Delta t$. We set the time step $\Delta t$ between $0.001 - 0.005$.(iii) A re-meshing scheme is employed if the nodes on the mesh become too separated or too close (if the distance between two nodes becomes too small, i.e.
$\Delta d< {0.16 {\rm \pi}}/{N}$, we remove one of the nodes, and if the distance is too large, i.e. $\Delta d> {1.3 {\rm \pi}}/{N}$, we add a node in between the two nodes).(iv) Steps (i)–(iii) are repeated to evolve the droplet shape over time. We typically simulate up to 50–150 dimensionless time units.


To ensure that the volume of the droplet is conserved as the droplet translates, we rescale the nodes’ position after every time step. Similar corrections have also been used in previous numerical studies (Stone & Leal Reference Stone and Leal1990; Pawar & Stebe Reference Pawar and Stebe1996). A typical simulation starts with  $N=100$ nodes, and the nodes are then added based on the re-meshing scheme described above. The total number of nodes for the droplet shapes reported in this manuscript range from
 $100 - 600$.
2.3.2. Numerical scheme: droplet with constant interfacial viscosities and Marangoni flows
This section outlines the numerical procedure for a droplet with surfactant transport and constant interfacial viscosity. As the droplet translates through the external fluid, the flow around the droplet sweeps the surfactant towards the droplet's rear end, which induces surfactant concentration inhomogeneities. In this case, the traction contribution from surface tension will have an additional term resulting from Marangoni stresses  $\boldsymbol {\nabla _s}\sigma$ in the force balance equation across the interface. The surfactant is initially assumed to be uniformly distributed over the droplet's surface, i.e.
 $\varGamma =1$. For a droplet with surfactant transport we redefine the capillary number
 $Ca$ as
 $Ca^\ast =Ca/(1-\beta )$, which is based on the reduced initial surface tension in the presence of surfactant – i.e.
 $\sigma _c(1-\beta )$. The force balance at the interface becomes
 \begin{equation} (\boldsymbol{\tau}^{in} - \boldsymbol{\tau}^{out})\boldsymbol{\cdot} \boldsymbol{n} = \boldsymbol{f_\mu} + \boldsymbol{f_\kappa} - \frac{1}{M_D}z\boldsymbol{n} - \frac{1}{Ca^\ast(1-\beta)} \left( \beta\boldsymbol{\nabla_s}\varGamma + (1-\beta\varGamma)\boldsymbol{n}\boldsymbol{\nabla}\boldsymbol{\cdot}\boldsymbol{n} \right). \end{equation}
The following time-advancing procedure is employed to obtain the evolution of droplet shapes:
(i) For a given droplet shape and surfactant concentration at time
$t$, the velocity at time $t$ is evaluated using the boundary-integral equation (2.15).(ii) Using the explicit Euler method, the nodes on the droplet surface are advanced to obtain the updated shape at time
$t + \Delta t$. We note that a second-order Runge–Kutta scheme could alternatively be used like in § 2.3.1, but we choose the explicit Euler for simplicity sake.(iii) A re-meshing scheme is employed if the nodes on the mesh become too separated or too close.
(iv) An implicit Euler method is used to update surfactant concentration. At each node, the discretized surfactant convective–diffusion equation is
(2.28)To solve for the nodal concentration values$$\begin{align} &\frac{\varGamma^{i}_{t+\Delta t} - \varGamma^{i}_t }{\Delta t } + \varGamma^{i}_{t+\Delta t} \left(\frac{(\boldsymbol{u}\boldsymbol{\cdot} \boldsymbol{t}) \, \textrm{d}r/\textrm{d}s}{r} + \frac{\textrm{d}(\boldsymbol{u}\boldsymbol{\cdot} \boldsymbol{t})}{\textrm{d}s} + (\boldsymbol{\nabla_{s}} \boldsymbol{\cdot} \boldsymbol{n}) \,(\boldsymbol{u}\boldsymbol{\cdot} \boldsymbol{n})\right)_i\nonumber\\ &\quad + \frac{\textrm{d}\varGamma^{i}_{t+\Delta t}}{\textrm{d}s} \left(\boldsymbol{u}\boldsymbol{\cdot} \boldsymbol{t} - \frac{1}{Pe_S M_D}\frac{\textrm{d}r/\textrm{d}s}{r}\right)_i - \frac{1}{Pe_S M_D}\frac{\textrm{d}^2\varGamma^{i}_{t+\Delta t}}{\textrm{d}s^2} =0. \end{align}$$$\varGamma ^i_{t+\Delta t}$, the concentrations at times $t$ and $t + \Delta t$ are written as cubic splines with the condition $\textrm {d} \varGamma /\textrm {d}s = 0$ at the poles of the droplet. The bracketed terms in the above equation are computed using spline approximations of position at time $t+\Delta t$ (from step (ii)) and velocity at time $t$ (from step (i)). This procedure yields a linear system of equations for the spline coefficients of the updated concentration profile, which is solved by matrix inversion.(v) Steps (i)–(iv) are repeated to evolve the droplet shape and surfactant concentration profile over time.


As stated previously, we rescale the nodes’ position after every time step to ensure the droplet volume is conserved. Similarly, we also rescale the surfactant concentration to conserve the total surfactant on the droplet's surface. Similar corrections have been used in previous numerical studies (Stone & Leal Reference Stone and Leal1990; Pawar & Stebe Reference Pawar and Stebe1996) over the same range of surface Péclet numbers studied here ( $Pe_s \sim O(1-100)$).
2.3.3. Numerical scheme: droplet with pressure-dependent interfacial viscosities and Marangoni flows
For a droplet with pressure-dependent interfacial viscosities, the Boussinesq parameters  $Bq_\kappa$ and
 $Bq_\mu$ are a function of surface tension
 $\sigma$, as shown in equations (2.13) and (2.14). We assume the surfactant is initially uniformly distributed over the droplet's surface, i.e.
 $\varGamma =1$. We choose the surface pressure associated with the initial surface concentration as the reference surface pressure
 $\varPi _0$. Substituting the reference parameters in (2.13) and (2.14) returns the modified expression for the Boussinesq parameters in terms of surface concentration given below
 \begin{align} Bq_{\kappa}^\pm &= Bq_{\kappa}^0\exp\left({\pm \frac{\beta(\varGamma-1)}{\varPi_c^\ast}}\right), \end{align}
 \begin{align} Bq_{\mu}^\pm &= Bq_{\mu}^0\exp\left({\pm \frac{\beta(\varGamma-1)}{\varPi_c^\ast}}\right). \end{align}
As the Boussinesq parameters are now functions of surface concentration, the tractions from interfacial viscosities will have additional term resulting from surface gradient of  $Bq_\mu$ and
 $Bq_\kappa$. The force density
 $\boldsymbol {f_\mu }$ ,and
 $\boldsymbol {f_\kappa }$ becomes
 \begin{align} \boldsymbol{f_\mu} &={-}(\boldsymbol{\nabla_s}\,{\boldsymbol{\cdot}}\,\boldsymbol{u_s})\boldsymbol{\nabla_s}Bq_\mu \,{+}\, \boldsymbol{\nabla_s}Bq_\mu\boldsymbol{\cdot}2\boldsymbol{\mathsf{e}}_{\boldsymbol{\mathsf{s}}} + Bq_\mu \left[ 2\,H\left( \boldsymbol{\nabla_s}\,{\boldsymbol{\cdot}}\,\boldsymbol{u_s}\right) \,{-}\, \boldsymbol{\nabla_s}\, \left(\boldsymbol{\nabla_s}\,{\boldsymbol{\cdot}}\,\boldsymbol{u_s}\right) +\boldsymbol{\nabla_s}\boldsymbol{\cdot} 2\, \boldsymbol{\mathsf{e}}_{\boldsymbol{\mathsf{s}}}\right ], \end{align}
 \begin{align} \boldsymbol{f_\kappa} &= (\boldsymbol{\nabla_s}\boldsymbol{\cdot}\boldsymbol{u_s})\boldsymbol{\nabla_s}Bq_\kappa + Bq_\kappa \left[ - 2\,H\left( \boldsymbol{\nabla_s}\boldsymbol{\cdot}\boldsymbol{u_s}\right) + \boldsymbol{\nabla_s}\, \left(\boldsymbol{\nabla_s}\boldsymbol{\cdot}\boldsymbol{u_s}\right) \right]. \end{align}
The numerical scheme to update the nodes’ position and velocity is the same as discussed in the previous § 2.3.2.
3. Results
3.1. Effect of constant surface viscosity
In this section, we discuss the results for a droplet with constant surface viscosity. We neglect the effect of surfactant concentration and surface tension inhomogeneities to understand the isolated influence of surface viscosity on droplet translation.
3.1.1. Clean droplet
At zero Reynolds number, the exact solution for the sedimentation speed of a spherical droplet is given by the Hadamard–Rybczynski equation. The accuracy of our numerical procedure is established by verifying the computed velocity at each node of the spherical droplet with the theoretical expression. The velocity computed on each node of the undeformed spherical droplet's surface (discretized into 100 mesh elements) is well within the  $0.01\,\%$ range of the theoretical expressions of the translation speed.
We also examine the droplet's nonlinear time evolution at different combinations of initial Taylor deformation parameter  $\varDelta$ (ranging from
 $-0.6$ to
 $0.6$) and viscosity ratio
 $\lambda$ (for values
 $0.5$,
 $1$ and
 $5$). At capillary numbers lower than the critical capillary number,
 $Ca_C$, the initially perturbed droplet reverts to its spherical shape and is stable. However, above
 $Ca_C$, the droplet deforms continuously with time, and the initial shape is unstable. The droplet's rear end evolves either into a growing tail for initial prolate perturbations or a cavity for initial oblate perturbations. Similar observations have been reported in previous studies on clean droplet translation (Koh & Leal Reference Koh and Leal1989; Pozrikidis Reference Pozrikidis1990). In our study, we determine
 $Ca_C$ by observing the droplet shape over time for several
 $Ca$ spaced by increments of 0.01. We record
 $Ca_C$ as the midpoint between the largest stable
 $Ca$ (i.e. the largest
 $Ca$ at which the streamwise distance reaches the spherical limit
 $d \rightarrow 2$ within 0.05
 $\%$ error) and the smallest unstable
 $Ca$ (i.e. the smallest
 $Ca$ where
 $d$ does not reach
 $d \rightarrow 2$).
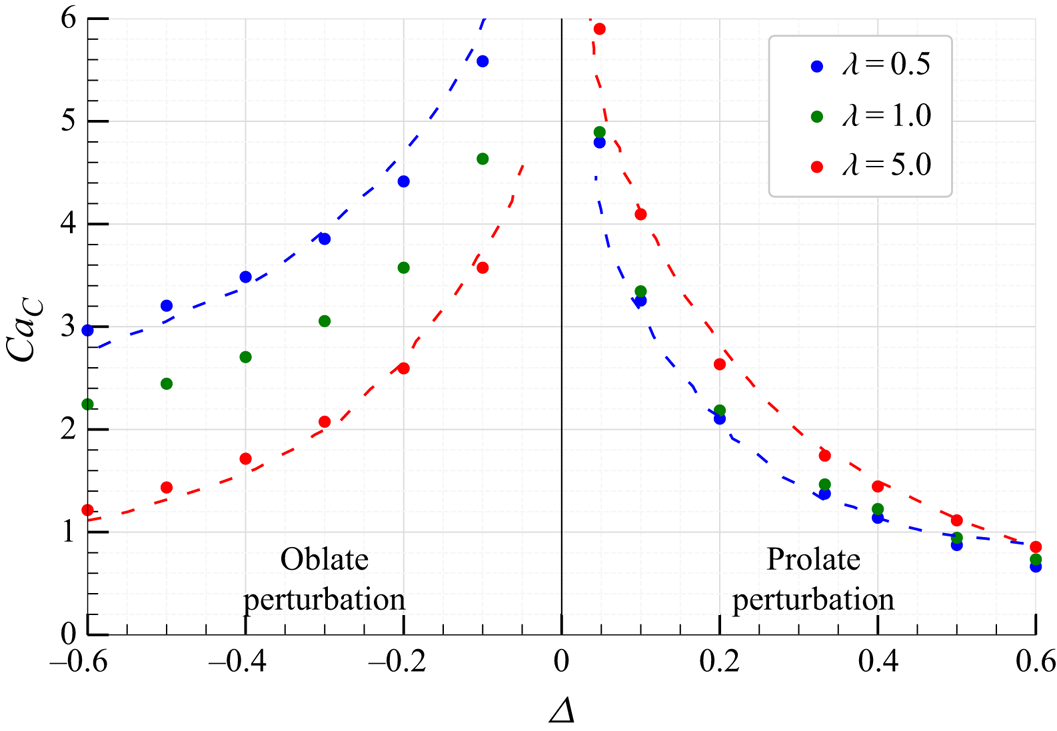
Figure 2 shows the dependence of critical capillary number  $Ca_C$ on
 $\varDelta$ at values of viscosity ratio
 $\lambda =0.5$,
 $1$ and
 $5$ for a clean droplet. The results from Koh & Leal (Reference Koh and Leal1989) (shown by dashed curves) match well with our numerical results (represented by dots). As can be seen from figure 2, for initial oblate shapes (
 $\varDelta <0$), lower viscosity ratio droplets have a higher
 $Ca_C$ than higher viscosity ratio droplets at the same initial deformation
 $\varDelta$. The opposite trend occurs for initial prolate shapes. At a positive value of
 $\varDelta$, a higher viscosity ratio droplet has a higher
 $Ca_C$ than a lower viscosity ratio droplet.
Value of  $Ca_C$ vs
 $\varDelta$ for a clean droplet at viscosity ratio values
 $\lambda = 0.5$, 1 and 5. The dashed curves are from Koh & Leal (Reference Koh and Leal1989), and the dots represent our numerical results.

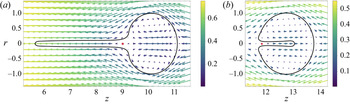
Figure 3 $(a{,}b)$ shows the flow fields inside and outside of an unstable droplet with prolate (
 $\varDelta = 0.2$) and oblate (
 $\varDelta = -0.2$) initial deformations at
 $\lambda = 1$,
 $Ca=4.5$ and large times. The streamline patterns are in the frame of reference of the front tip of the droplet. In the case of an initially prolate droplet, as seen in figure 3
 $(a)$, the front part returns to a spherical shape. The internal fluid has a stagnation point at the droplet's neck, which leads to a local extension towards the droplet's growing tail. On the contrary, a droplet with an initially oblate shape has its stagnation point located in the external fluid, which causes local extension of the external fluid towards the droplet cavity (figure 3
 $b$). The above mechanism explains the opposite impact of increasing viscosity ratio on
 $Ca_C$ for prolate and oblate perturbations. For a droplet with
 $\lambda > 1$ and
 $\varDelta > 0$ (prolate shape), the more viscous internal fluid undergoes extension and the instability grows more slowly compared with a lower viscosity ratio droplet. However, for a droplet with
 $\lambda > 1$ and
 $\varDelta < 0$ (oblate shape), the less viscous external fluid undergoes extension, and the instability grows faster than a lower viscosity ratio droplet.
Streamline pattern for  $(a)$ an unstable initial prolate droplet (
 $\varDelta =0.2$,
 $\lambda =1$,
 $Ca = 4.5$ and
 $t = 10$) and
 $(b)$ an unstable initial oblate droplet (
 $\varDelta =-0.2$,
 $\lambda =1$,
 $Ca=4.5$ and
 $t = 13$). The red dot depicts the stagnation point in the flow. The flow fields are computed in the frame of reference of the front tip of the translating droplet.

We will discuss the impact of constant interfacial shear and dilatational viscosities on droplet stability in §§ 3.1.2 and 3.1.3.
3.1.2. Droplet with constant surface shear viscosity
For an undeformed spherical droplet with interfacial shear viscosity, the surface shear viscosity does not alter the sedimentation speed of the droplet (Levan Reference Levan1981; Narsimhan Reference Narsimhan2018). The traction contribution from interfacial shear viscosity  $\boldsymbol {f_\mu }$ is found to be zero over the undeformed droplet's surface, and the translation speed remains the same as that of a clean droplet. Here, we explore how interfacial shear viscosity alters the stability of the droplet shape with finite initial perturbations. The Boussinesq shear parameter
 $Bq_\mu$ measures the relative importance of the surface shear stresses to the bulk viscous stresses. We examine how the critical capillary number
 $Ca_C$ varies with
 $Bq_\mu$ for different
 $\varDelta$ and
 $\lambda$ combinations.
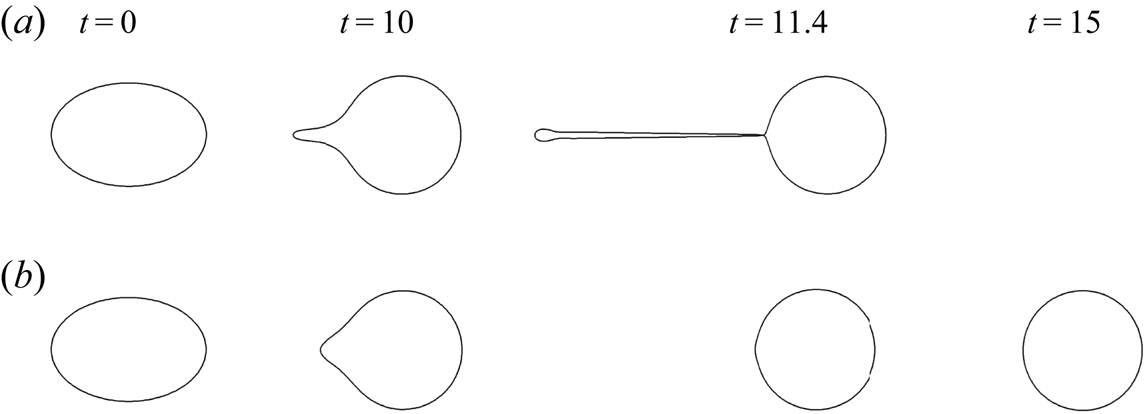
We find that the surface shear viscosity increases  $Ca_C$ compared with a clean droplet. For instance, figure 4 compares the evolution of two initially prolate droplets having the same initial Taylor deformation parameter and viscosity ratio (
 $\varDelta =0.2$ and
 $\lambda =0.5$) at
 $Ca=2.6$. In the first case (figure 4
 $a$), a clean droplet is unstable and develops a growing tail that approaches pinch off at time
 $t=11.4$. In the second case (figure 4
 $b$), a droplet with surface shear viscosity (
 $Bq_{\mu } = 1.5$ and
 $Bq_{\kappa } = 0$) is stable and reverts to its spherical shape. For the first case, the critical capillary number
 $Ca_C$ is
 $2.11$, and for the second case,
 $Ca_C$ is
 $3.06$. From the above, it can be noted that at
 $\lambda =0.5$ and
 $\varDelta =0.2$, increasing
 $Bq_\mu$ from
 $0$ to
 $1.5$ causes a significant increase in
 $Ca_C$, roughly
 $45\,\%$.
Time evolution of two initially prolate droplets having the same viscosity ratio, initial perturbation and capillary number ( $\lambda = 0.5$,
 $\varDelta = 0.2$ and
 $Ca = 2.6$).
 $(a)$ Clean droplet:
 $Bq_\mu =0$,
 $Bq_\kappa =0$ (i.e.
 $Bq=0$).
 $(b)$ Droplet with interfacial shear viscosity:
 $Bq_\mu =1.5$,
 $Bq_\kappa =0$ (i.e.
 $Bq=1.5$,
 $\lambda _{ds}=0)$.

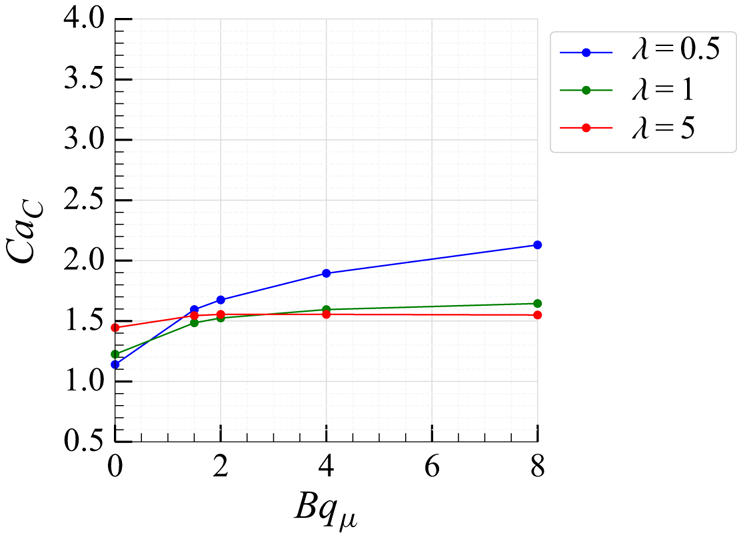
Figure 5 shows the variation of  $Ca_C$ with
 $Bq_\mu$ at viscosity ratios
 $\lambda =$
 $0.5$,
 $1$ and
 $5$ for a droplet with an initial prolate shape (
 $\varDelta =0.4$). As can be seen from this plot, the
 $Ca_C$ increases upon increasing the
 $Bq_\mu$ for all viscosity ratios. Also, the surface shear viscosity has a more significant impact on lower viscosity ratio droplets than on droplets with higher viscosity ratios. For example, we see a droplet with
 $Bq_\mu = 8$ having a higher
 $Ca_C$ for low viscosity ratio droplets (
 $\lambda = 0.5$) compared with higher viscosity ratio droplets (
 $\lambda = 5$), which is opposite to the trend observed for the clean droplet case (
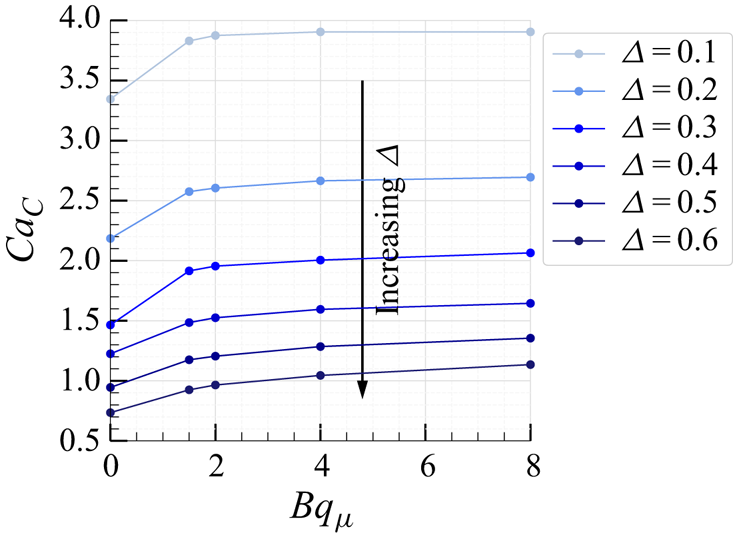
 $Bq_\mu = 0$). In figure 6, we show the variation of
 $Ca_C$ with
 $Bq_\mu$ at different
 $\varDelta$ values for an initially prolate droplet at
 $\lambda =1$. Again, the presence of interfacial shear viscosity increases
 $Ca_C$ for all
 $\varDelta$ values.
Value of  $Ca_C$ vs
 $Bq_\mu$ at viscosity ratio values
 $\lambda =$ 0.5, 1 and 5. The deformation parameter is
 $\varDelta =0.4$ and
 $Bq_{\kappa } = 0$ (i.e.
 $\lambda _{ds}=0$).

Value if  $Ca_C$ vs
 $Bq_\mu$ at different values of deformation parameter
 $\varDelta$ (
 $0.1 \leq \varDelta \leq 0.6$). The viscosity ratio is
 $\lambda =1$ and
 $Bq_{\kappa } = 0$ (i.e.
 $\lambda _{ds}=0$).

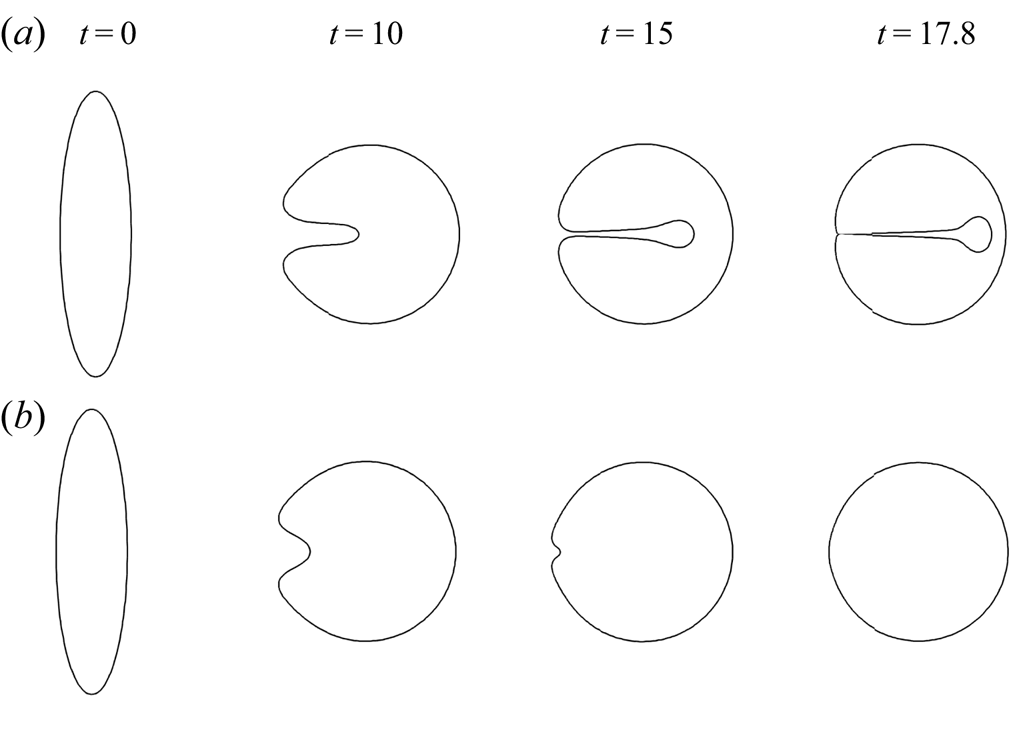
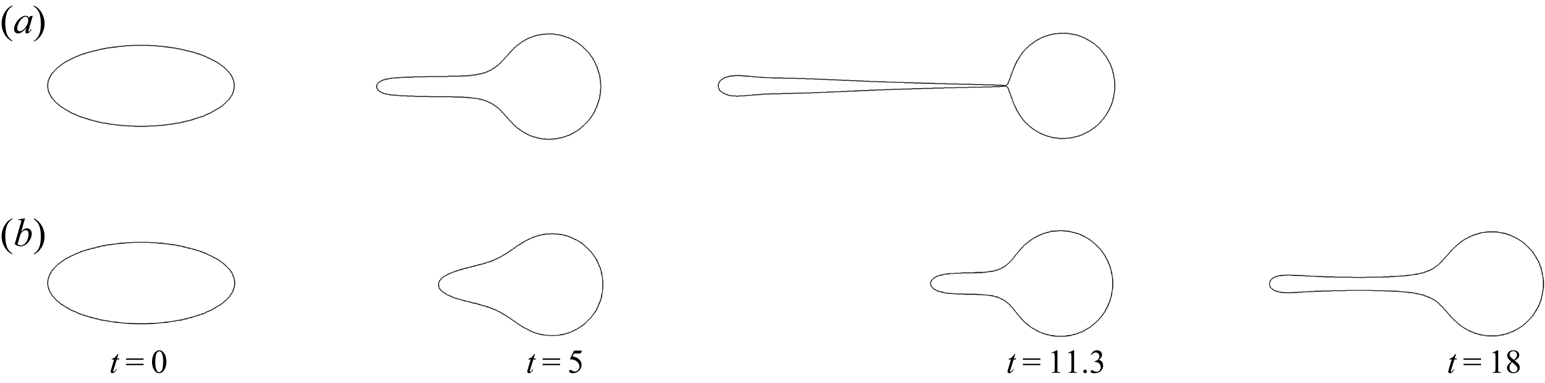
The interfacial shear viscosity is found to have a similar effect for droplets with an initial oblate shape as well ( $\varDelta < 0$). Figure 7 compares the evolution of two droplets at the same viscosity ratio and initial deformation (
 $\varDelta =-0.6$ and
 $\lambda =1.0$). At the same capillary number (
 $Ca=2.5$), the clean droplet (figure 7
 $a$) forms a growing cavity at the droplet's rear end and becomes unstable. In comparison, the droplet with surface shear viscosity (figure 7
 $b$) becomes stable and eventually returns to a sphere. The presence of interfacial shear viscosity increases the
 $Ca_C$ from 2.24 in the first case (clean droplet) to 2.59 in the second case (
 $Bq_\mu =1.5$ and
 $Bq_\kappa =0$), which is roughly
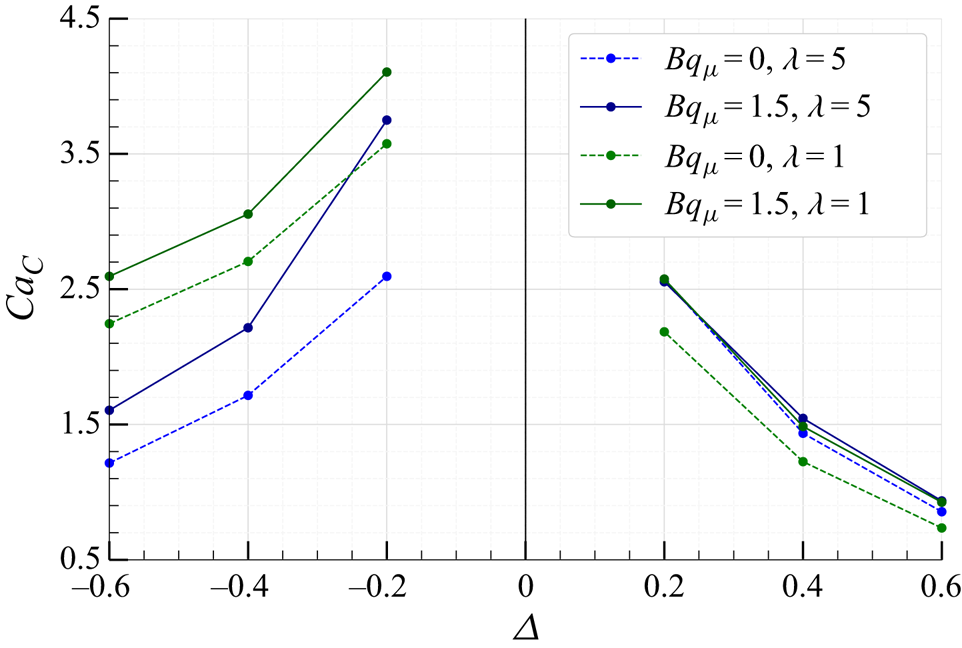
 $16\,\%$. From figure 8, we can see that an increase in
 $Bq_\mu$ from
 $0$ to
 $1.5$ leads to an increased
 $Ca_C$ for a given droplet at all
 $\varDelta$ values (
 $-0.6$ to
 $0.6$).
Time evolution of two initially oblate droplets having the same viscosity ratio, initial perturbation and capillary number ( $\lambda = 1$,
 $\varDelta = -0.6$ and
 $Ca = 2.5$).
 $(a)$ Clean droplet:
 $Bq_\mu =0$,
 $Bq_\kappa =0$ (i.e.
 $Bq=0$).
 $(b)$ Droplet with shear viscosity:
 $Bq_\mu =1.5$,
 $Bq_\kappa =0$ (i.e.
 $Bq=1.5$,
 $\lambda _{ds}=0)$.

Value if  $Ca_C$ vs
 $\varDelta$ at
 $\lambda =1$ (green curves) and
 $\lambda =5$ (blue curves). The dashed curves represent results for clean droplet (
 $Bq=0$) and the bold curves are for droplet with surface shear viscosity (
 $Bq=1.5$,
 $\lambda _{ds}=0)$.

To gain a better understanding of the instability, figure 9 $(a)$ shows the flow field around an unstable, initially prolate droplet (
 $\lambda =1$ and
 $\varDelta =0.4$) with interfacial shear viscosity (
 $Bq_\mu =1.5$,
 $Bq_\kappa =0$) at time
 $t=16$ (computed via boundary-integral equation inside and outside the drop). The flow fields are drawn in the frame of reference of the translating droplet's front tip. Figure 9
 $(b)$ shows the tractions from interfacial shear viscosity (computed using (2.23)) acting on the droplet surface corresponding at the same instance of time. We emphasize that these tractions are not ‘driving forces’ for instability, but rather give an idea for how flow arising from surface tension or gravity is promoted or inhibited. The blue arrows act as a guide to the eye to show the existing fluid flow inside the droplet.
Effect of the surface shear viscosity on an unstable droplet with initial prolate perturbation ( $\varDelta =0.4$) at
 $Bq=1.5$,
 $\lambda _{ds}=0$,
 $Ca=2.0$,
 $\lambda =1$ and
 $t=16$.
 $(a)$ Streamline pattern inside and outside the droplet (computed via boundary-integral equation inside and outside the drop). The flow fields are drawn in the frame of reference of the front tip of the translating droplet.
 $(b)$ Vectors over the droplet's surface represent the computed traction
 $\boldsymbol {f}_{\mu }$ from interfacial shear viscosity. The blue arrows act as a guide to the eye to show the existing fluid flow inside the droplet.

From (2.23), we see that the surface shear tractions consist of two contributions – one that opposes surface velocity gradients and another that mimics a variable surface tension – i.e.  $\sigma ^{effective} = \sigma - \eta _{\mu } \nabla _s \boldsymbol {\cdot } \boldsymbol {u_s}$. The combination of these effects does not alter the traction at the head of the droplet due to the special nature of the spherical surface (Narsimhan Reference Narsimhan2018). However, as seen in figure 9
 $(b)$, these effects inhibit flow in the neck and tail of the droplet, which lowers droplet elongation compared with a clean droplet at the same capillary number and reduces the growth rate of the tail. For instance, figure 10 compares the time evolution of two unstable droplets having the same viscosity ratio and initial perturbation (
 $\lambda =0.5$ and
 $\varDelta =0.4$) at the same capillary number (
 $Ca=2.0$). In the case of the clean droplet (figure 10
 $a$), the instability grows at a faster rate and the tail appears to pinch off from the parent droplet at
 $t=11.3$. For the second case (
 $Bq_\mu =2$,
 $Bq_\kappa =0$, figure 10
 $b$), the presence of surface shear viscosity inhibits the tail growth, and the instability is observed at comparatively larger times.
Time evolution of two unstable droplets with the same initial prolate shape ( $\varDelta = 0.4$), same viscosity ratio (
 $\lambda = 0.5$) and same capillary number (
 $Ca = 2.0$).
 $(a)$ Clean droplet
 $Bq_{\mu } = 0,\ Bq_{\kappa } = 0$.
 $(b)$ Droplet with surface shear viscosity (
 $\lambda _{ds}=0)$
 $Bq_{\mu } = 2.0,\ Bq_{\kappa } = 0$.

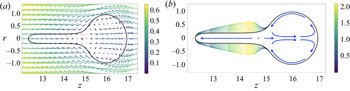
A similar effect of surface shear viscosity is seen for an unstable droplet that is initially oblate. Figure 11 $(a)$ shows the computed flow field inside and outside an unstable droplet (
 $\lambda = 5$,
 $t = 25$) with an oblate initial perturbation (
 $\varDelta = -0.4$), drawn in the frame of reference of the front tip of the droplet. Figure 11
 $(b)$ shows the surface shear traction vectors acting on the droplet interface (computed using (2.23)). The blue arrows in figure 11
 $(b)$ depict the existing fluid flow. As the droplet deforms, the front part of the droplet returns to a hemispherical shape with the internal fluid circulating inside. The instability is observed at the rear end as the external fluid penetrates into the growing cavity. As seen in figure 11
 $(b)$, the traction from interfacial shear viscosity counters the penetration of fluid into the cavity and inhibits the thinning of the cavity.
Effect of the surface shear viscosity on an unstable droplet with an initial oblate perturbation ( $\varDelta =-0.4$) at
 $Bq=1.5$,
 $\lambda _{ds}=0$,
 $Ca=3.0$,
 $\lambda =5$ and
 $t=25$.
 $(a)$ Streamline pattern inside and outside the droplet (computed via boundary-integral equation inside and outside the drop). The flow fields are drawn in the frame of reference of the front tip of the translating droplet.
 $(b)$ Vectors over the droplet's surface represent the computed traction
 $\boldsymbol {f_\mu }$ from interfacial shear viscosity. The blue arrows act as a guide to the eye to show the existing fluid flow inside the droplet.

3.1.3. Droplet with constant surface dilatational viscosity
The Boussinesq dilatational parameter  $Bq_{\kappa }$ measures the relative importance of surface dilatational stresses to the bulk viscous stresses. To validate our code for a given
 $Bq_{\kappa }$, we compare our numerical results with known results for a translating spherical droplet. The translational speed of a spherical droplet modified by
 $Bq_{\kappa }$ is given by equation (2.2a,b), and the non-dimensional velocity at each node on the sphere is given by (Narsimhan Reference Narsimhan2018)
 \begin{equation} \boldsymbol{u} ={-}\frac{1}{2 + 2 \lambda^\ast} \left[ (1+2\lambda^\ast) \boldsymbol{\mathsf{I}} + \boldsymbol{nn} \right] \boldsymbol{\cdot} \boldsymbol{e}_z, \end{equation}
where  $\lambda ^\ast = \lambda + \frac {2}{3}Bq_\kappa$ is the modified viscosity ratio. For a mesh with 100 elements, we find the computed velocity to be within 0.01 % of the theoretical prediction.
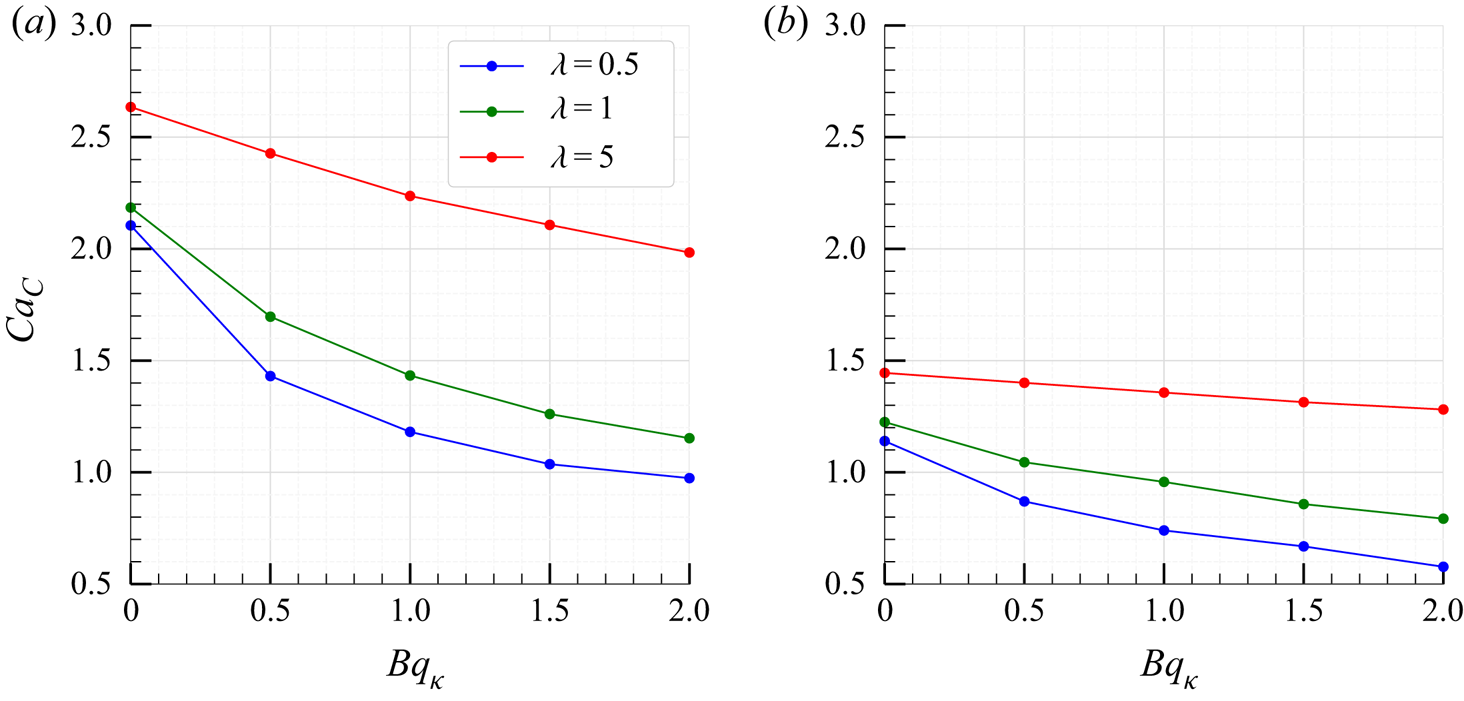
Next, we examine the stability of the droplet shape to finite initial prolate and oblate perturbations. It is found that surface dilatational viscosity decreases the critical capillary number  $Ca_C$ compared with a clean droplet. Figure 12
 $(a)$ shows the variation of critical capillary number
 $Ca_C$ with
 $Bq_\kappa$ for a droplet with initial prolate deformation (
 $\varDelta =0.2$) at viscosity ratios
 $\lambda =$
 $0.5$,
 $1$ and
 $5$. The value of
 $Ca_C$ monotonically decreases with an increase in
 $Bq_\kappa$. Similar behaviour is observed for a droplet with a relatively larger initial deformation of
 $\varDelta =0.4$, as shown in figure 12
 $(b)$. From figures 12
 $(a)$ and 12
 $(b)$, it can be noted that dilatational viscosity has a more significant impact on a droplet with a low viscosity ratio and small initial perturbation than a droplet with a high viscosity ratio and large initial perturbation. For instance, upon increasing
 $Bq_\kappa$ from 0 to 2, the reduction in
 $Ca_C$ is
 $48\,\%$ for a droplet with
 $\lambda =0.5$ and
 $\varDelta =0.2$, and
 $10\,\%$ for a droplet with
 $\lambda =5$ and
 $\varDelta =0.4$.
Value of  $Ca_C$ vs
 $Bq_\kappa$ at viscosity ratio values
 $\lambda = 0.5$, 1 and 5. The shear Boussinesq number is
 $Bq_\mu =0$ (i.e.
 $\lambda _{ds} = \infty$).
 $(a)$ The initial deformation is
 $\varDelta =0.2$.
 $(b)$ The initial deformation is
 $\varDelta =0.4$.

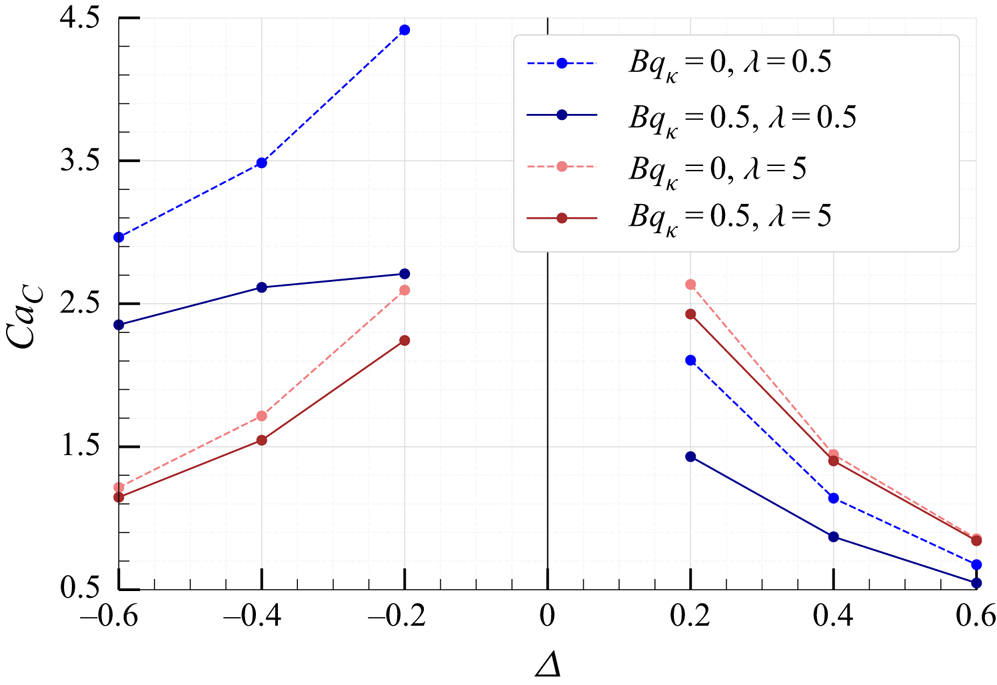
Figure 13 shows how  $Ca_C$ varies with the initial deformation
 $\varDelta$ upon increasing
 $Bq_\kappa$ from 0 to 0.5. The results corresponding to viscosity ratio
 $\lambda =0.5$ are shown using blue curves, while the results corresponding to the viscosity ratio
 $\lambda = 5$ are shown using red curves. As can be noted from the plot, for all
 $\varDelta$ values ranging from
 $-0.6$ to 0.6 (i.e. oblate and prolate initial deformations), the value
 $Ca_C$ decreases upon increasing the interfacial dilatational viscosity.
Value of  $Ca_C$ vs
 $\varDelta$ at
 $\lambda =0.5$ (blue curves) and
 $\lambda =5$ (red curves). The dashed curves represent results for a clean droplet (
 $Bq=0$) and the bold curves represent results for a droplet with surface dilatational viscosity (
 $Bq=0.5$,
 $\lambda _{ds}=\infty$).

Figure 14 $(a)$ shows the flow field around an unstable, initially prolate droplet (
 $\lambda =1$ and
 $\varDelta =0.4$) with interfacial dilatational viscosity (
 $Bq_\mu =0$,
 $Bq_\kappa =1.5$) at time
 $t=10$ (computed via boundary-integral equation inside and outside the drop). The flow fields are drawn in the frame of reference of the translating droplet's front tip. Figure 14
 $(b)$ shows the interfacial dilatational traction vectors along the droplet's surface (computed using (2.24)). The blue arrows in figure 14
 $(b)$ depict the current fluid flow inside the droplet. Unlike the interfacial shear traction, the dilatational traction acting on the front spherical part of the droplet is non-zero. This traction reduces the fluid circulation inside the front portion of the droplet and increases fluid flow penetrating into the growing tail. The expression for the surface dilatational traction mimics the formulation of the variable surface tension, as can be seen from (2.24). As a result, the effect of surface dilatational viscosity can be seen as an ‘effective’ surface tension
 \begin{equation} \sigma^{effective} = \sigma + \eta_\kappa(\boldsymbol{\nabla_{s}} \boldsymbol{\cdot} \boldsymbol{u_{s}}). \end{equation}
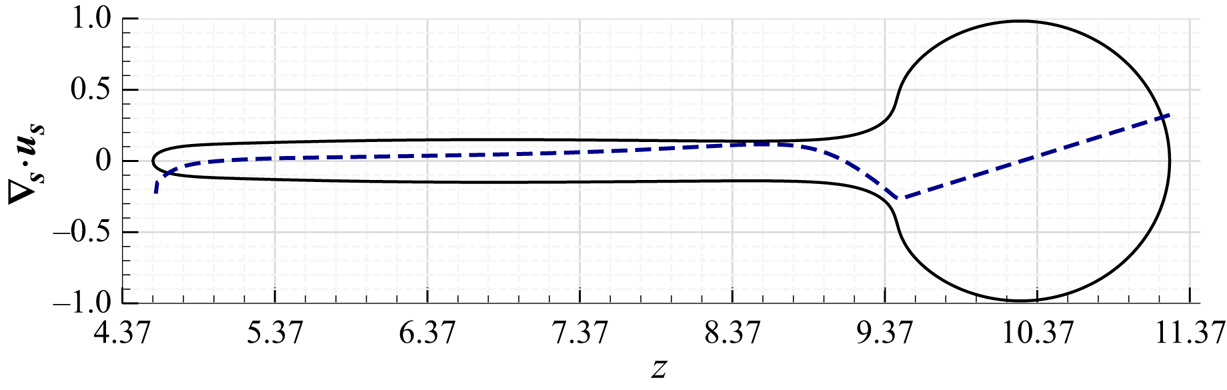
In figure 15, we plot the variation of surface divergence of interfacial velocity  $\boldsymbol {\nabla _{s} \boldsymbol {\cdot } u_{s}}$ with axial position coordinate
 $z$ for the droplet's upper half overlayed with the droplet shape shown in figure 14. In the zones of high curvature (i.e. the droplet's neck and the rear pole), the negative surface divergence of interfacial velocity lowers the effective surface tension, which promotes the growth of the tail. This effect is analogous to the effect of increasing capillary number for a clean droplet. For a clean droplet, a droplet with a higher capillary number is more elongated at a particular instance of time and the droplet pinch off takes a longer time, when compared with a droplet at a lower
 $Ca$. The effect of surface dilatational viscosity also appears similar to the effect of surfactant convection on translating droplet shapes, as reported by (Johnson & Borhan Reference Johnson and Borhan2000). Due to surface convection effects, the surfactant is swept towards the tail and there is also a local accumulation of surfactant in the neck region. The higher surfactant concentration lowers the surface tension in this region and promotes elongation of the droplet.
Effect of the surface dilatational viscosity on an unstable droplet with initial prolate perturbation ( $\varDelta = 0.4$) at
 $Bq=1.5$,
 $\lambda _{ds}=\infty$,
 $Ca=2.0$,
 $\lambda =1$ and
 $t=10$.
 $(a)$ Streamline pattern inside and outside the droplet (computed via boundary-integral equation inside and outside the drop). The flow fields are drawn in the frame of reference of the front tip of the translating droplet.
 $(b)$ Vectors over the droplet's surface represent the computed traction
 $\boldsymbol {f_\kappa }$ from interfacial dilatational viscosity. The blue arrows act as a guide to the eye to show the existing fluid flow inside the droplet.

Variation of surface divergence of interfacial velocity  $\boldsymbol {\nabla _{s}} \boldsymbol {\cdot } \boldsymbol {u_{s}}$ with axial position coordinate
 $z$ for the droplet's upper half overlayed with the droplet shape.

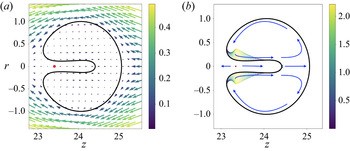
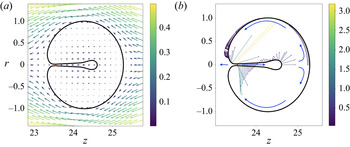
A similar effect of surface dilatational viscosity is seen for an unstable droplet that is initially oblate. Figure 16 shows an unstable droplet with an initial oblate perturbation ( $\lambda =5$,
 $Bq_{\kappa } = 1.5$, and
 $\varDelta =-0.4$ at time
 $t=25$). Figure 16
 $(a)$ shows the streamline pattern relative to the droplet's front tip (computed via boundary-integral equation inside and outside the drop), and figure 16
 $(b)$ shows the interfacial dilatational traction vectors along the droplet's surface (computed using (2.24)). As can be observed from figure 16
 $(b)$, the non-zero traction in the front spherical part opposes the fluid circulation inside the droplet. In the neck region, the surface dilatational viscosity lowers the effective surface tension, which drives the thinning of the neck region and increases the deformation of the cavity compared with a clean droplet.
Effect of the surface dilatational viscosity on an unstable droplet with initial oblate perturbation ( $\varDelta =-0.4$) at
 $Bq=0.5$,
 $\lambda _{ds}=\infty$,
 $Ca=2.0$,
 $\lambda =5$ and
 $t=25$.
 $(a)$ Streamline pattern inside and outside the droplet (computed via boundary-integral equation inside and outside the drop). The flow fields are drawn in the frame of reference of the front tip of the translating droplet.
 $(b)$ Vectors over the droplet's surface represent the computed traction
 $\boldsymbol {f_\kappa }$ from interfacial dilatational viscosity (traction vectors are shown only in the droplet's upper half). The blue arrows act as a guide to the eye to show the existing fluid flow inside the droplet.

3.1.4. Droplet with constant surface shear and dilatational viscosity
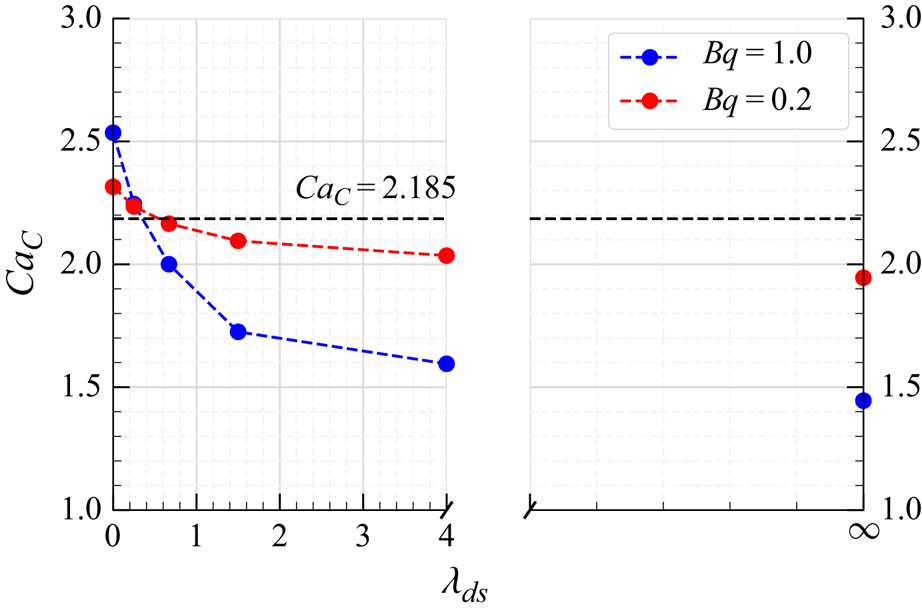
In this section, we discuss the combined influence of constant surface shear and dilatational viscosity on droplet stability. Figure 17 shows the variation of critical capillary number with  $\lambda _{ds}= Bq_{\kappa }/Bq_{\mu }$ for a fixed
 $Bq = Bq_{\kappa } + Bq_{\mu }$. The dimensionless parameters are:
 $\lambda =1$ and
 $\varDelta =0.2$, and we show results for
 $Bq =1.0$ (blue curve) and
 $Bq=0.2$ (red curve). The critical capillary number of a clean droplet with
 $\lambda =1$ and
 $\varDelta =0.2$ is
 $Ca_C=2.185$ (shown in black dashed line). As shown in figure 17, the critical capillary number monotonically decreases with
 $\lambda _{ds}$ starting from a droplet with pure surface shear viscosity (
 $\lambda _{ds}=0$) and approaches the
 $Ca_C$ of a droplet with pure surface dilatational viscosity (
 $\lambda _{ds}=\infty$). In general, interfaces embedded with surfactants, lipid bilayers and proteins exhibit both surface shear and dilatational responses to deformations and the droplet membrane dynamics can be viscoelastic (Lucassen-Reynders Reference Lucassen-Reynders1993; Erni Reference Erni2011; Jaensson & Vermant Reference Jaensson and Vermant2018). In this work we neglect surface elasticity to understand the isolated impact of interfacial shear and dilatational viscosity on droplet translation. The surface rheological investigation of lipid monolayer DPPC and DMPE (dimyristoyl phosphatidylethanolamine) at the air–water interface under shear and dilatational deformations predicts
 $\lambda _{ds} \sim {\textit{O}} (10^5)$, as measured in some studies (Krägel et al. Reference Krägel, Kretzschmar, Li, Loglio, Miller and Möhwald1996; Kim et al. Reference Kim, Choi, Zasadzinski and Squires2011). Hexadecanol (a low molecular weight surfactant) exhibits a purely viscous response under surface shear deformations and a viscoelastic response under dilatational deformations with
 $\lambda _{ds} \sim {\textit{O}}(10^4)$ (Verwijlen et al. Reference Verwijlen, Moldenaers and Vermant2013; Samaniuk & Vermant Reference Samaniuk and Vermant2014). The surface viscosity ratio estimate of the PtBMA (poly(tert-butyl acrylate)) system is measured to be
 $\lambda _{ds}\sim {\textit{O}}(10^3)$ (Krägel et al. Reference Krägel, Kretzschmar, Li, Loglio, Miller and Möhwald1996; Samaniuk & Vermant Reference Samaniuk and Vermant2014). The surface shear rheological response of protein
 $\beta$-casein is predominantly viscous, while its dilatational rheological response is viscoelastic with
 $\lambda _{ds}\sim {\textit{O}}(1)$ (Freer et al. Reference Freer, Yim, Fuller and Radke2004; Erni, Windhab & Fischer Reference Erni, Windhab and Fischer2011). Globular protein ovalbumin forms viscoelastic interfaces with interfacial viscosity ratio
 $\lambda _{ds}\sim {\textit{O}}(10^6)$ (Erni et al. Reference Erni, Fischer, Windhab, Kusnezov, Stettin and Läuger2003; Xiong et al. Reference Xiong, Ren, Tian, Yang, Li and Li2018).
Value of  $Ca_C$ vs
 $\lambda _{ds}$ for a fixed
 $Bq = Bq_{\kappa } + Bq_{\mu }$. The dimensionless parameters are:
 $\lambda =1$ and
 $\varDelta =0.2$, and we show results for
 $Bq =1.0$ (blue curve) and
 $Bq=0.2$ (red curve). The critical capillary number of a clean droplet with
 $\lambda =1$ and
 $\varDelta =0.2$ is
 $Ca_C=2.185$ (shown in black dashed line).

Although these simulations did not measure the impact of surface elasticity, they show that the isolated effect of surface viscosity should decrease  $Ca_C$ compared with a clean droplet for the vast range of experimental conditions reported. Only
 $\lambda _{ds} \lessapprox 0.6$ will give rise to an increased
 $Ca_C$ compared with a clean droplet, which is unlikely to occur for most surfactant systems. These results also show that dilatational resistance influences droplet stability more strongly than shear resistance, which is different than the case for droplet breakup in shear flow (Gounley et al. Reference Gounley, Boedec, Jaeger and Leonetti2016; Narsimhan Reference Narsimhan2019).
3.1.5. Droplet shapes after onset of instability
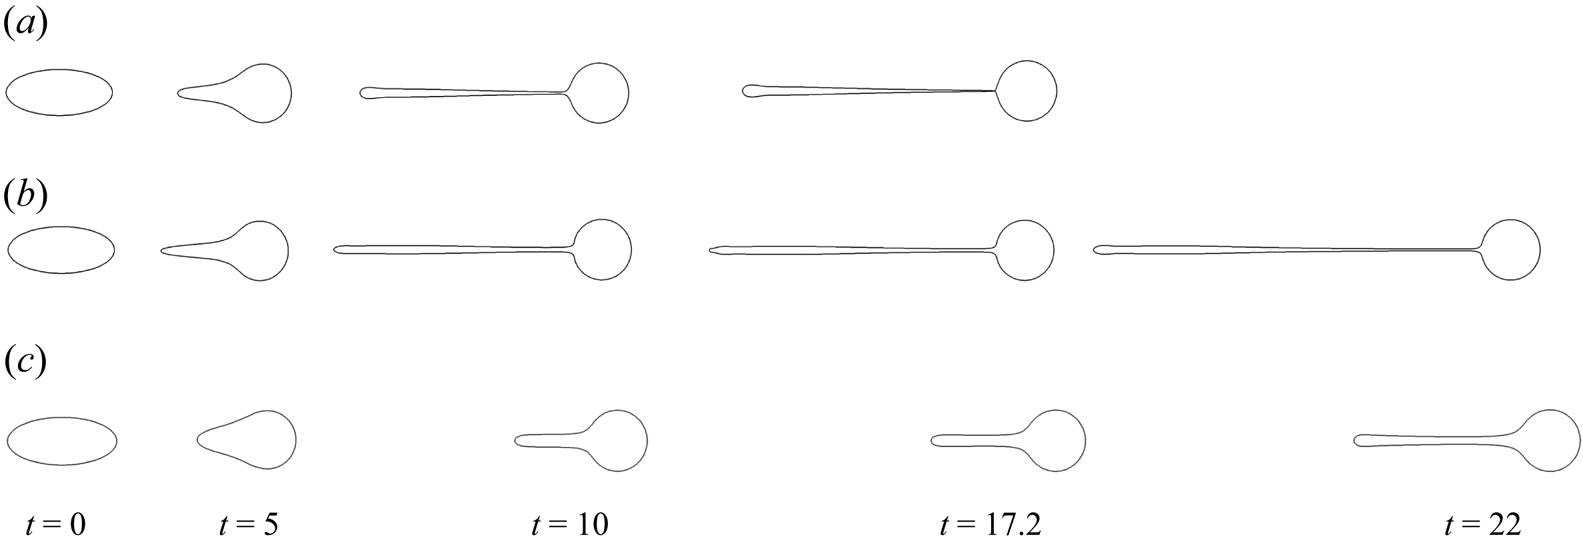
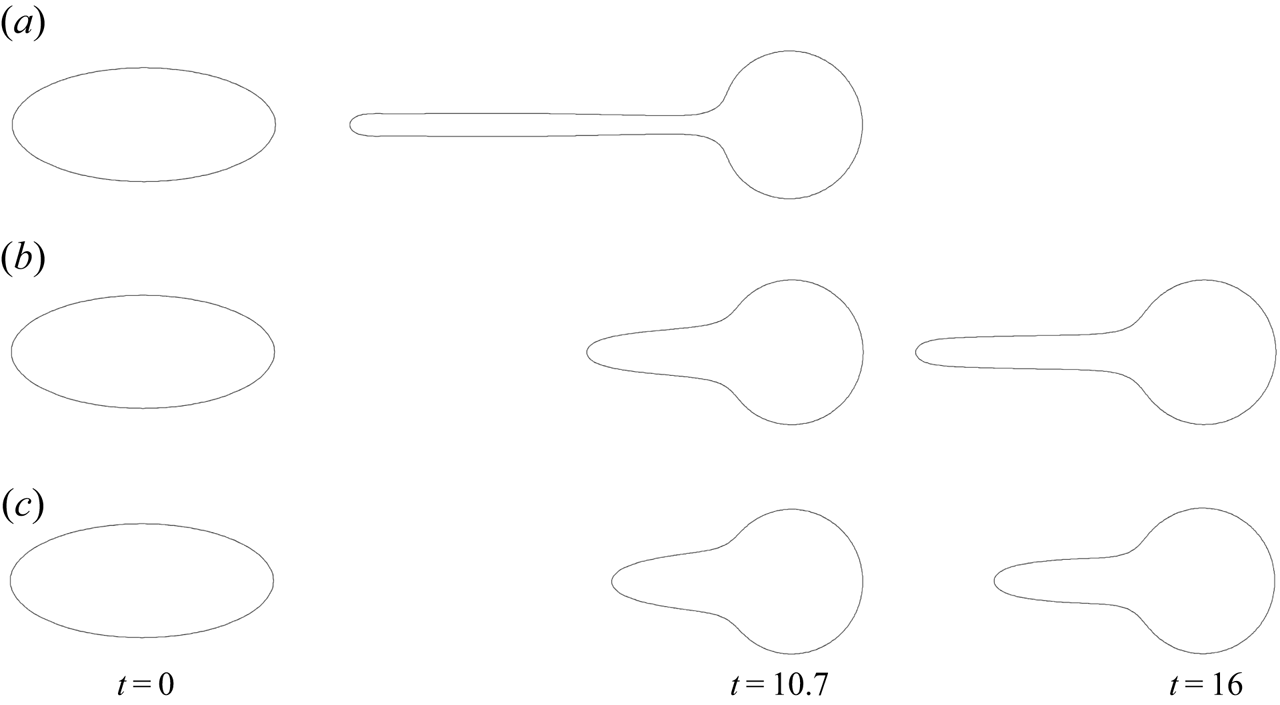
To understand how interfacial viscosity alters the droplet shapes during stretching, figure 18 plots snapshots of an unstable, initially prolate droplet ( $\varDelta = 0.4$,
 $\lambda = 1$,
 $Ca = 2$) for different values of interfacial viscosity. As shown in figure 18
 $(a)$, the tail of a clean droplet appears to pinch off from the parent droplet at time
 $t=17.2$. For the droplet with surface dilatational viscosity (figure 18
 $b$), the droplet does not approach pinch off around time
 $t=17.2$ and instead continues to thin dramatically near the neck region and forms a highly elongated shape at time
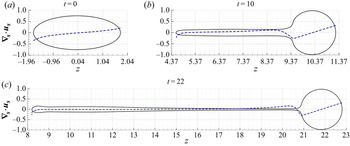
 $t=22$. Figure 19 shows the variation of surface divergence of the velocity with axial position coordinate
 $z$ for the droplet's upper half overlayed with the droplet shapes shown in figure 18
 $(b)$ at times
 $t=0$,
 $t=10$ and
 $t=22$. The negative value of
 $\boldsymbol {\nabla _{s}} \boldsymbol {\cdot } \boldsymbol {u_{s}}$ in the neck region lowers the ‘effective’ surface tension. The lowered surface tension then drives the thinning of the droplet's neck region and delays the pinch off compared with a clean droplet. The surface shear viscosity, in contrast, delays the tail's growth significantly, as shown in figure 18
 $(c)$. Thus, it appears that both shear and dilatational viscosities delay the onset of pinch off compared with a clean droplet, although the mechanisms are distinct.
Time evolution of an initially prolate droplet that is unstable ( $\lambda = 1$,
 $\varDelta = 0.4$,
 $Ca = 2$) for three different cases;
 $(a)$ clean droplet
 $Bq_{\mu }= 0,\ Bq_{\kappa }= 0$,
 $(b)$ droplet with surface dilatational viscosity (
 $Bq=1.5$,
 $\lambda _{ds}=\infty$)
 $Bq_{\mu }= 0,\ Bq_{\kappa }= 1.5$ and
 $(c)$ droplet with surface shear viscosity (
 $Bq=1.5$,
 $\lambda _{ds}=0$)
 $Bq_{\mu }= 1.5,\ Bq_{\kappa }= 0$.

Variation of surface divergence of interfacial velocity  $\boldsymbol {\nabla _{s}} \boldsymbol {\cdot } \boldsymbol {u_{s}}$ with axial position coordinate
 $z$ for the droplet's upper half overlayed with the droplet shapes shown in figure 18
 $(b)$ at times
 $t=0$, 10 and 22.

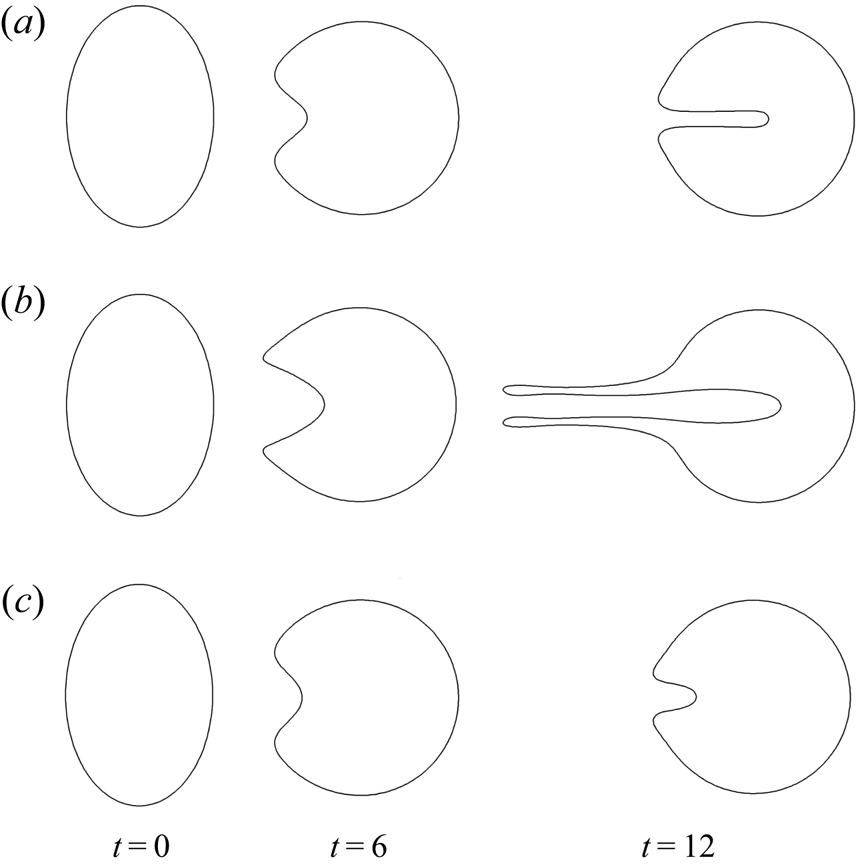
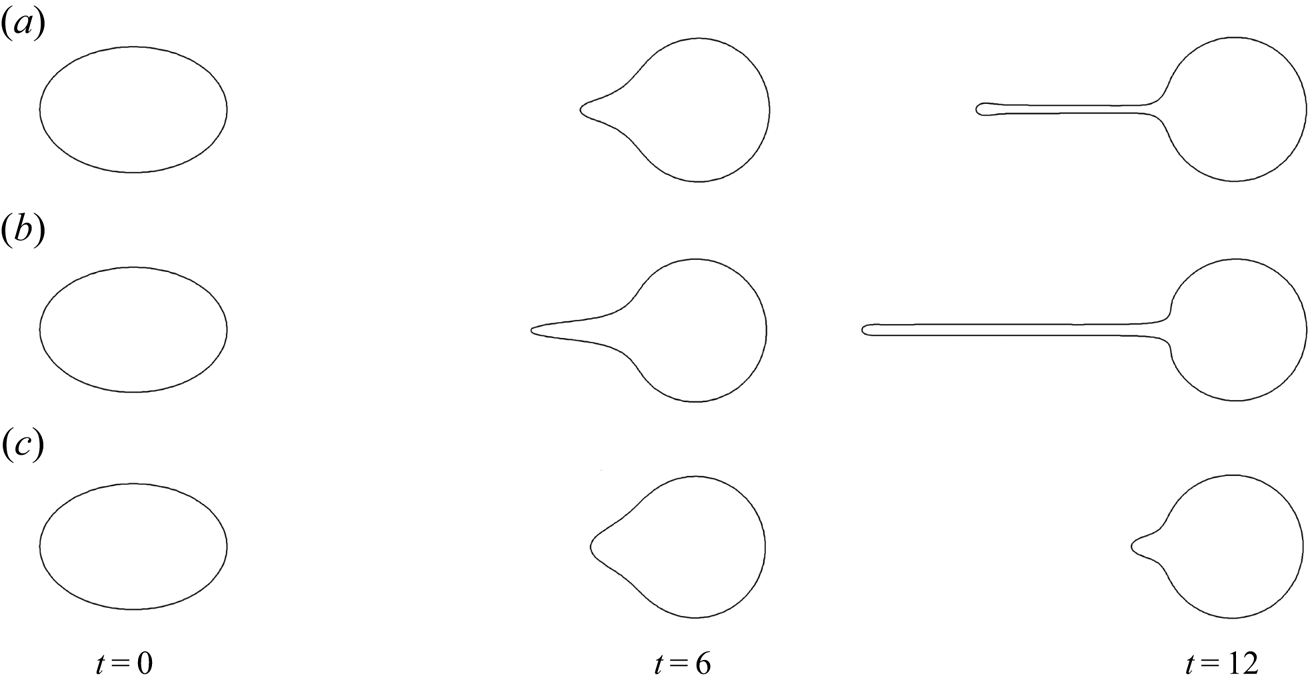
Figure 20 shows the influence of interfacial viscosities on the evolution of droplet shapes for an unstable droplet that is initially oblate ( $\lambda = 1$,
 $\varDelta = -0.2$,
 $Ca = 4.5$). Here, the cavity grows faster in the case of the droplet with dilatational viscosity compared with the clean droplet. At
 $t=12$, in figure 20
 $(b)$, the internal fluid entrained in the cavity opening develops into a highly pronounced filament. It seems that, at high capillary numbers, the presence of surface dilatational viscosity induces droplet filamentation, which is otherwise suppressed by surface tension in clean droplets (Pozrikidis Reference Pozrikidis1990). From figure 20
 $(c)$, we can see that the surface shear viscosity significantly inhibits the growth of the cavity at the droplet's rear end compared with the clean droplet. Lastly, we note that for oblate shapes, shear and dilatational surface viscosity delay pinch off compared with clean droplets.
Time evolution of an initially oblate droplet that is unstable ( $\lambda = 1$,
 $\varDelta = -0.2$,
 $Ca = 4.5$) for three different cases;
 $(a)$ clean droplet
 $Bq_{\mu }= 0,\ Bq_{\kappa }= 0$,
 $(b)$ droplet with surface dilatational viscosity (
 $Bq=1.0$,
 $\lambda _{ds}=\infty$)
 $Bq_{\mu }= 0,\ Bq_{\kappa }= 1$ and
 $(c)$ droplet with surface shear viscosity (
 $Bq=1.0$,
 $\lambda _{ds}=0$)
 $Bq_{\mu }= 1,\ Bq_{\kappa }= 0$.

3.2. Combined effects of constant surface viscosity and surfactant transport
The previous study by Johnson & Borhan (Reference Johnson and Borhan2000) showed that surfactant transport (i.e. Marangoni stresses) has a destabilizing effect on droplet motion. As the droplet translates, surfactant gets swept towards the trailing region, which results in a lower surface tension in that region. This lower surface tension promotes droplet stretching and grows the instability faster than a clean droplet. In this section, we will discuss the combined effects of surface viscosity and surfactant transport on the evolution of droplet shapes. We will assume that the interfacial viscosities do not vary locally with surfactant concentration distribution and are fixed at their initial values  $Bq_\mu ^0$ and
 $Bq_\kappa ^0$ as the droplet translates. When
 ${\Delta \varPi }/{\varPi _c^\ast }\ll 1$, the surface viscosity does not change considerably with surface pressure and can be assumed to be constant.
Figure 21 shows the droplet shape evolution for three cases:  $(a)$ clean droplet: (
 $Bq=0$),
 $(b)$ droplet with surface dilatational viscosity (
 $Bq=1.0$,
 $\lambda _{ds}=\infty$) and
 $(c)$ droplet with surface shear viscosity (
 $Bq=1.0$,
 $\lambda _{ds}=0$). The values of the surface Péclet number
 $Pe_s$ and elasticity parameter
 $\beta$ are set to 1 and 0.2 respectively. The modified capillary number is
 $Ca^\ast =2.5$ and the viscosity ratio is
 $\lambda =1$. The initial droplet shape is unstable in cases
 $(a)$ and
 $(b)$. The droplet develops a tail that grows continuously with time, and the instability grows faster for the case where the interface has only surface dilatational viscosity. In the case of the droplet with only surface shear viscosity (figure 21
 $c$), the surface shear viscosity significantly delays the tail's growth.
Time evolution of an initially prolate droplet with  $\lambda =1$,
 $\varDelta =0.2$,
 $Pe_s=1$,
 $\beta =0.2$ and
 $Ca^\ast =2.5$ for three cases:
 $(a)$ clean droplet
 $Bq_{\mu }= 0,\ Bq_{\kappa }= 0$,
 $(b)$ droplet with surface dilatational viscosity (
 $Bq=1.0$,
 $\lambda _{ds}=\infty$)
 $Bq_{\mu }= 0,\ Bq_{\kappa }= 1.0$ and
 $(c)$ droplet with surface shear viscosity (
 $Bq=1.0$,
 $\lambda _{ds}=0$)
 $Bq_{\mu }= 1.0,\ Bq_{\kappa }= 0$.

For the droplet shape evolution shown in figures 21 $(a)$ and 21
 $(b)$, we increase
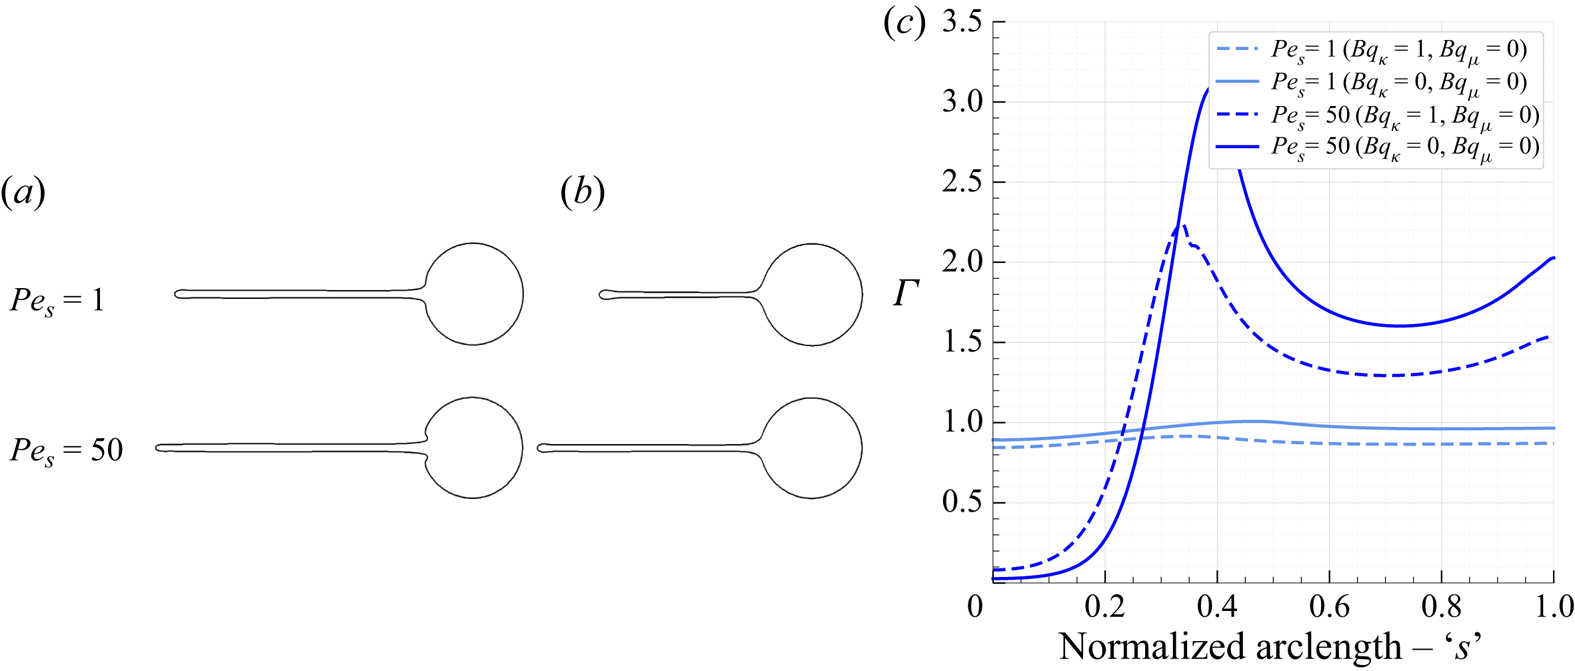
 $Pe_s$ from 1 to 50 to understand the effect of surface Péclet number on droplet translation. Figure 22 plots the surfactant concentration as a function of the normalized arclength
 $s$ (
 $s=0$ at the front tip and
 $s=1$ at the trailing tip of the translating droplet) for the two cases (i)
 $Pe_s=1$ and (ii)
 $Pe_s=50$ at time
 $t=13$. Upon increasing the
 $Pe_s$, the surface convection increases and a larger amount of surfactant is swept to the back of the droplet. Due to higher surfactant concentration at the trailing end of the droplet, the surface tension decreases at the droplet tail and the instability grows faster. As a result, the droplet with
 $Pe_s=50$ is more deformed at time
 $t=13$ compared with a droplet with
 $Pe_s=1$ for both clean droplet and droplet with surface dilatational viscosity.
Plot of non-dimensional surfactant concentration  $\varGamma$ vs normalized arclength
 $s$ at
 $Pe_s=1$ and
 $Pe_s=50$ for a clean droplet (
 $Bq=0$,
 $\lambda _{ds}=0$) and droplet with surface dilatational viscosity (
 $Bq=1.0$,
 $\lambda _{ds}=\infty$) at time
 $t=13$. The dimensionless parameters are:
 $\lambda =1$,
 $\varDelta =0.2$,
 $\beta =0.2$ and
 $Ca^\ast =2.5$. The arclength is
 $s=0$ at the front tip and
 $s=1$ at the trailing tip of the translating droplet. The corresponding droplet shapes with
 $Pe_s=1$ and
 $Pe_s=50$ at time
 $t=13$ are shown alongside the plot;
 $(a)$
 $Bq_{\mu }= 0,\ Bq_{\kappa }= 1$,
 $(b)$
 $Bq_{\mu }= 0,\ Bq_{\kappa }= 0$.

Figure 23 plots the time evolution of droplet shapes for an interface with only surface shear viscosity for  $Bq_\mu$ values 0, 2 and 4. The initial shape of the droplet is prolate with
 $\varDelta =0.4$. The values of
 $Pe_s$,
 $\beta$,
 $\lambda$ and
 $Ca^\ast$ are fixed at 1, 0.2, 1 and 2.5, respectively. As can be noted from figure 23, increasing the value of
 $Bq_\mu$ slows down the tail's growth and reduces the droplet deformation.
Time evolution of an unstable, initially prolate droplet with only surface shear viscosity for three cases:  $(a)$
 $Bq_\mu =0$,
 $(b)$
 $Bq_\mu =2$ and
 $(c)$
 $Bq_\mu =4$. The values of dimensionless parameters are:
 $\lambda =1$,
 $\varDelta =0.4$,
 $Pe_s=1$,
 $\beta =0.2$ and
 $Ca^\ast =2.5$.

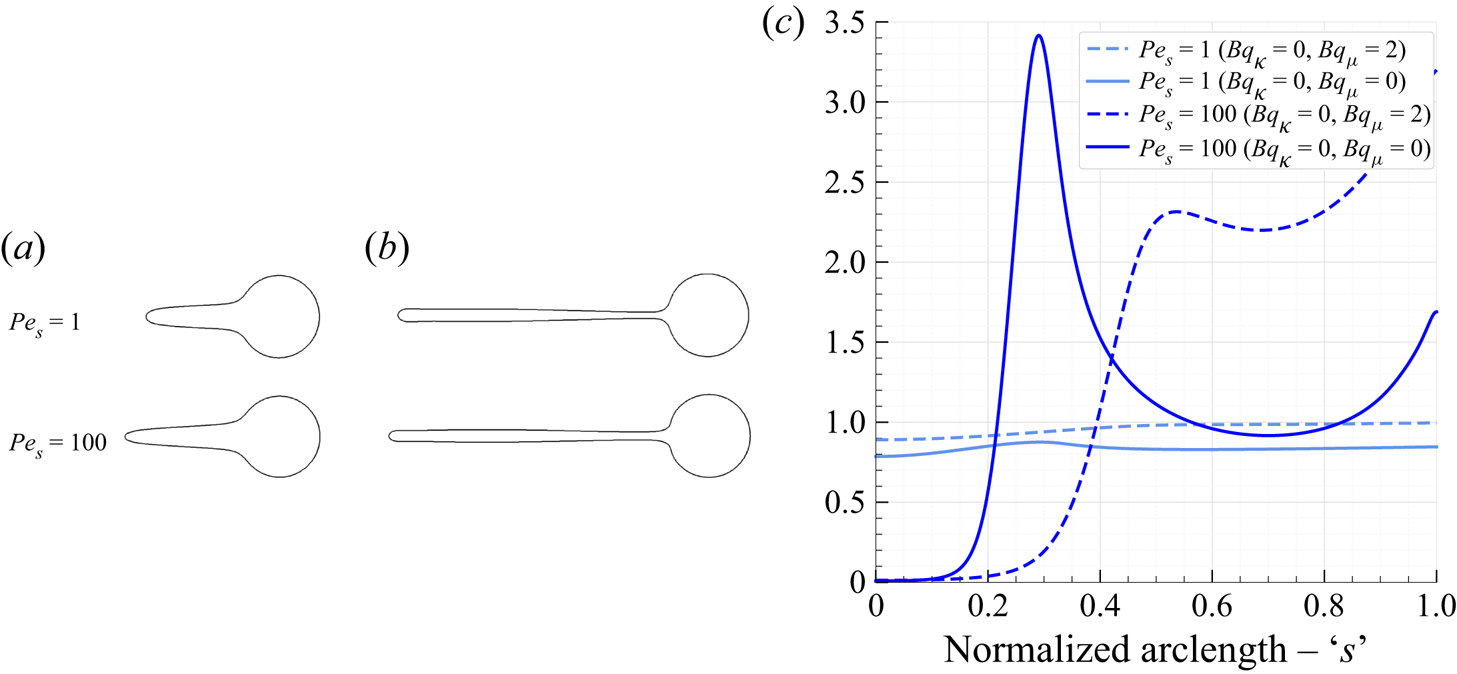
For the droplet shown in figures 23 $(a)$ and 23
 $(b)$ we increase
 $Pe_s$ from 1 to 100. The corresponding droplet shapes at time
 $t=13$ are shown in figure 24 alongside the plot of concentration variation
 $\varGamma$ vs normalized arclength
 $s$ for the same shapes. We note that increasing the
 $Pe_s$ increases the amount of surfactant swept towards the droplet's trailing end and increases the droplet deformation.
Plot of non-dimensional surfactant concentration  $\varGamma$ vs normalized arclength
 $s$ at
 $Pe_s=1$ and
 $Pe_s=100$ for a clean droplet (
 $Bq=0$,
 $\lambda _{ds}=0$) and droplet with surface shear viscosity (
 $Bq=1.0$,
 $\lambda _{ds}=0$) at time
 $t=13$. The dimensionless parameters are:
 $\lambda =1$,
 $\varDelta =0.4$,
 $\beta =0.2$ and
 $Ca^\ast =2.5$. The arclength is
 $s=0$ at the front tip and
 $s=1$ at the trailing tip of the translating droplet. The corresponding droplet shapes with
 $Pe_s=1$ and
 $Pe_s=100$ at time
 $t=13$ are shown alongside the plot;
 $(a)$
 $Bq_{\mu }= 2,\ Bq_{\kappa }= 0$,
 $(b)$
 $Bq_{\mu }= 0,\ Bq_{\kappa }= 0$.

3.3. Combined effects of surface pressure-dependent surface viscosity and surfactant transport
In this section, we incorporate the exponential dependence of surface viscosity on surface pressure and analyse the impact of  $\varPi$-thickening and
 $\varPi$-thinning surfactants on droplet translation.
First, we discuss the impact of  $\varPi$-thickening and
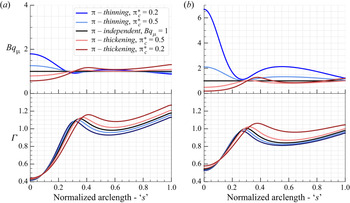
 $\varPi$-thinning surfactants on a droplet interface with only surface dilatational viscosity. In figure 25
 $(a)$, we plot the droplet elongation in the streamwise direction
 $d$ with non-dimensional time
 $t$ for three cases: (i)
 $\varPi$-thickening surfactant with dimensionless surface pressure scale
 $\varPi _c^\ast =0.2$, (ii)
 $\varPi$-independent surfactant, i.e. an interface with constant surface dilatational viscosity, and (iii)
 $\varPi$-thinning surfactant with
 $\varPi _c^\ast =0.2$. The initial droplet shape is prolate with
 $\varDelta =0.4$, and the initial Boussinesq parameter is
 $Bq_\kappa ^0=1$ and
 $Pe_s=10$,
 $\beta =0.2$,
 $\lambda =1$ and
 $Ca^\ast =2.5$. In the adjacent figure (figure 25
 $b$), for the three cases, we plot the variation of
 $Bq_\kappa$ and surface concentration
 $\varGamma$ along the normalized arclength
 $s$ at time
 $t=6.5$. For reference, the droplet shape at
 $t=6.5$ for a
 $\varPi$-independent surfactant is shown at the bottom of figure 25
 $(a)$. In the case of a
 $\varPi$-thinning surfactant, the value of
 $Bq_\kappa$ is higher than its initial value
 $Bq_\kappa ^0=1$ at the front spherical part of the droplet and is lower than
 $Bq_\kappa ^0$ in the tail region. Due to the lower value of surface dilatational viscosity in the trailing end, the dilatational traction acting in this region is reduced compared with the
 $\varPi$-independent case. As a result, the droplet deformation slightly decreases compared with the
 $\varPi$-independent case. In contrast, in the case of
 $\varPi$-thickening surfactant, the value of
 $Bq_\kappa$ is lower than
 $Bq_\kappa ^0$ at the front spherical part of the droplet and is higher than
 $Bq_\kappa ^0$ in the tail region. In this case, the droplet deformation is slightly higher than the
 $\varPi$-independent case as the surface dilatational traction acting on the rear end increases.
 $(a)$ Droplet elongation in the streamwise direction
 $d$ as a function of non-dimensional time
 $t$ for
 $\varPi$-thickening surfactant (shown as red curve),
 $\varPi$-independent surfactant (shown as black curve) and
 $\varPi$-thinning surfactant (shown as blue curve). The dimensionless parameters are
 $Pe_s=10$,
 $\beta =0.2$,
 $\lambda =1$,
 $\varDelta =0.4$,
 $Bq_\kappa ^0=1$,
 $Bq_\mu ^0=0$ and
 $Ca^\ast =2.5$. The droplet shape shown below the plot is at time
 $t=6.5$ for the
 $\varPi$-independent surfactant.
 $(b)$ Variation of
 $Bq_\kappa$ and surface concentration
 $\varGamma$ with the normalized arclength
 $s$ corresponding to the droplet shapes at time
 $t=6.5$.

Next, we discuss the impact of  $\varPi$-thickening and
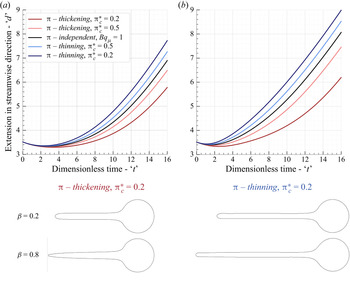
 $\varPi$-thinning surfactants on a droplet interface with only surface shear viscosity. We find that pressure thickening/thinning effects for surface shear viscosity have a more substantial influence on droplet dynamics than that for surface dilatational viscosity discussed above. Figure 26
 $(a)$ shows how the droplet's extension in the streamwise direction
 $d$ changes with time
 $t$ for five cases: (i)
 $\varPi$-thickening surfactant with
 $\varPi _c^\ast =0.2$, (ii)
 $\varPi$-thickening surfactant with
 $\varPi _c^\ast =0.5$, (iii)
 $\varPi$-independent surfactant,
 $(iv)$
 $\varPi$-thinning surfactant with
 $\varPi _c^\ast =0.5$ and (iv)
 $\varPi$-thinning surfactant with
 $\varPi _c^\ast =0.2$. The initial droplet shape is prolate with
 $\varDelta =0.4$, and the initial Boussinesq shear parameter is
 $Bq_\mu ^0=1$. The values of the other dimensionless parameters are:
 $Pe_s=10$,
 $\beta =0.2$,
 $Ca^\ast =2.5$ and
 $\lambda =1$. Here, we find that a
 $\varPi$-thickening surfactant decreases the deformation compared with the
 $\varPi$-independent surfactant and increases the critical capillary number
 $Ca_C$. By contrast, the
 $\varPi$-thinning surfactant has the opposite effect – i.e. it increases the deformation compared with the
 $\varPi$-independent surfactant and decreases
 $Ca_C$. Another observation that can be made is that reducing the magnitude of
 $\varPi _c^\ast$ (from 0.5 to 0.2) leads to a more significant decrease/increase in droplet deformation with a
 $\varPi$-thickening/thinning surfactant.
Droplet elongation in the streamwise direction  $d$ as a function of the non-dimensional time
 $t$ for
 $\varPi$-thickening surfactants (
 $\varPi _c^\ast =0.2$ and
 $\varPi _c^\ast =0.5$, shown as red curves),
 $\varPi$-independent surfactant (shown as black curve) and
 $\varPi$-thinning surfactants (
 $\varPi _c^\ast =0.2$ and
 $\varPi _c^\ast =0.5$, shown as blue curves) with
 $(a)$
 $\beta =0.2$ and
 $(b)$
 $\beta =0.8$. For both the plots
 $(a{,}b)$, the dimensionless parameters are
 $Pe_s=10$,
 $\lambda =1$,
 $\varDelta =0.4$,
 $Bq_\kappa ^0=0$,
 $Bq_\mu ^0=1$ and
 $Ca^\ast =2.5$. The droplet shapes shown below the plots are at time
 $t=16$ for
 $\varPi$-thinning surfactant (
 $\varPi _c^\ast =0.2$) and
 $\varPi$-thickening surfactant (
 $\varPi _c^\ast =0.2$) at
 $\beta$ values 0.2 and 0.8.

To understand the effect of surface elasticity  $\beta$, we keep all the parameters same as in figure 26
 $(a)$ but increase
 $\beta$ from 0.2 to 0.8. We then plot the droplet's extension in the streamwise direction
 $d$ with time
 $t$, shown in figure 26
 $(b)$. As can be seen from figure 26
 $(b)$, the instability grows faster than the droplet with
 $\beta =0.2$, and the droplet deformation increases for all five cases. Upon increasing the surface elasticity
 $\beta$, the sensitivity of the surface tension to surfactant concentration increases. Figures 27
 $(a)$ and 27
 $(b)$ show the variation of
 $Bq_\mu$ and surface concentration
 $\varGamma$ with normalized arclength
 $s$ for the droplet shapes with
 $\beta =0.2$ and
 $\beta =0.8$, respectively at time
 $t=16$. For reference, droplets shapes at time
 $t=16$ for
 $\beta =0.2$ and
 $\beta =0.8$ are shown below the plots in figure 26. For a
 $\varPi$-thickening surfactant the value of
 $Bq_\mu$ is lower than the initial value
 $Bq_\mu ^0$ in the front part of the droplet and the value is higher than
 $Bq_\mu ^0$ in the tail region. The higher value of
 $Bq_\mu$ in the tail region increases the surface shear traction acting in that region and lowers the droplet deformation compared with the
 $\varPi$-independent case. On the contrary, for a
 $\varPi$-thinning surfactant the value of
 $Bq_\mu$ is lower in the tail region which leads to reduced shear traction acting in that region and we see droplet is more deformed compared with the
 $\varPi$-independent case. Another observation is that at a higher value of
 $\beta$, the surface viscosity becomes more sensitive to surfactant concentration. The increase/decrease in
 $Bq_\mu$ for
 $\varPi$-thickening/thinning surfactant is more significant in case of
 $\beta =0.8$ (shown in figure 27
 $b$) compared with
 $\beta =0.2$ (shown in figure 27
 $a$).
Variation of  $Bq_\mu$ and surface concentration
 $\varGamma$ with normalized arclength
 $s$ for the droplet shapes at time
 $t=16$ for
 $\varPi$-thickening surfactants (
 $\varPi _c^\ast =0.2$ and
 $\varPi _c^\ast =0.5$, shown as red curves),
 $\varPi$-independent surfactant (shown as black curve) and
 $\varPi$-thinning surfactants (
 $\varPi _c^\ast =0.2$ and
 $\varPi _c^\ast =0.5$, shown as blue curves) with
 $(a)$
 $\beta =0.2$ and
 $(b)$
 $\beta =0.8$. For both the plots
 $(a{,}b)$, the dimensionless parameters are
 $Pe_s=10$,
 $\lambda =1$,
 $\varDelta =0.4$,
 $Bq_\kappa ^0=0$,
 $Bq_\mu ^0=1$ and
 $Ca^\ast =2.5$.

4. Conclusion
In this study, we performed a numerical analysis to investigate the role of interfacial viscosities on the stability of a droplet translating through an unbounded stagnant fluid. The viscous interface is modelled using the Boussinesq–Scriven constitutive relationship. The interfacial velocity is computed using the boundary-integral method. We examined how the interfacial viscosities alter critical capillary number  $Ca_C$ and the droplet shapes for different values of the droplet's viscosity ratio
 $\lambda$ (0.5, 1 and 5) and initial Taylor deformation parameter
 $\varDelta$ (ranging from
 $-0.6$ to 0.6). For a clean droplet with finite perturbations, the critical capillary numbers for the transition from stable to unstable droplet shapes compares well with the results reported by Koh & Leal (Reference Koh and Leal1989).
We observe that interfacial shear viscosity inhibits/delays the growth of the instability at the droplet's rear end. The surface shear tractions tend to oppose the flow of fluid entering the cavity/tail and suppress the thinning of these regions. As a result, the  $Ca_C$ increases compared with a clean droplet at the same viscosity ratio and initial perturbation. On the contrary, the interfacial dilatational viscosity reduces the
 $Ca_C$ compared with a clean droplet at the same viscosity ratio and initial perturbation. The surface dilatational tractions increase the rate at which instability grows at the droplet's rear end by increasing the flux of fluid penetrating the cavity/tail. In the zones of high curvature (i.e. the droplet's neck), the negative surface divergence of interfacial velocity lowers the effective surface tension which promotes the thinning of the neck region. Because of this, the tail/cavity becomes highly elongated before the droplet breaks into satellite droplets. For an initially perturbed droplet, both shear and dilatational viscosity appear to increase the time at which satellite droplets form compared with a clean droplet. Lastly, another interesting observation is that surface dilatational viscosity appears to promote droplet filamentation for oblate droplets at high capillary numbers, which is otherwise suppressed by surface tension in clean droplets (Pozrikidis Reference Pozrikidis1990).
To investigate the coupling between surface rheology and Marangoni stresses, we included surfactant transport in our models by assuming a linear dependence of surface tension on surfactant concentration, which is valid when the surfactant concentration is sufficiently dilute. For a droplet translating under the action of gravity, the flow around the droplet sweeps the surfactant towards the droplet's rear end. The high surfactant concentration lowers the surface tension in the tail/cavity region, which increases the deformation of the droplet. At high Péclet number, the convection effects become stronger and we find that the tail of the droplet becomes more elongated than at lower  $Pe_s$. The qualitative effect of surface viscosities on droplet deformation remains the same when Marangoni effects are considered. In several experimental studies, the interfacial viscosities have been shown to depend strongly on surface pressure (Kurtz et al. Reference Kurtz, Lange and Fuller2006; Kim et al. Reference Kim, Choi, Zasadzinski and Squires2011; Fuller & Vermant Reference Fuller and Vermant2012; Samaniuk & Vermant Reference Samaniuk and Vermant2014). We assume an exponential dependence of surface viscosity on surface pressure to investigate the influence of
 $\varPi$-thickening and
 $\varPi$-thinning surfactants on translating droplet dynamics. For a droplet with surface shear viscosity, we observe that a
 $\varPi$-thickening surfactant increases the
 $Ca_C$ compared with the
 $\varPi$-independent case, while the
 $\varPi$-thinning surfactant has the opposite effect (decreases
 $Ca_C$). We observe that the effects of
 $\varPi$-thinning and
 $\varPi$-thickening surfactants are not very pronounced for dilatational viscosities.
Overall, we hope this study provides the first step towards understanding how complex interfacial rheology alters droplet stability. Our work seems to suggest that the isolated effect of interfacial viscosity will increase  $Ca_C$ under the majority of experimental conditions reported (
 $\lambda _{ds} > O(1)$). In the future, it will be important to consider surface viscoelasticity and additional effects due to surface diffusion. For example, the surface diffusion coefficient in complex systems can vary with surface viscosity, and thus an increase/decrease in interfacial viscosity for pressure-dependent surface viscosity can lead to even weaker/stronger diffusion effects as the surface diffusion coefficient decreases with an increase in surface viscosity (Danov et al. Reference Danov, Aust, Durst and Lange1995). These additional effects can be incorporated in the convection–diffusion equation, and the surface Péclet number will no longer remain constant as the droplet deforms.
Declaration of interests
The authors report no conflict of interest.