Introduction
Nowadays, lanthanide-doped luminescence materials have become an important theme in materials science [Reference Zhou and Yan1]. As a result of the wide range of emission wavelength and excellent luminescence performance [Reference Liu, Xiong, Zhang, Leng, Li and Gan2], lanthanide ion (Ln3+)–activated phosphors have many potential applications in lighting [Reference Cho and Huh3], bio-labels, and optoelectronic displays [Reference Yan and Wu4, Reference Yu, Lan, Tang and Wang5]. The phosphors usually contain host matrix materials and incorporated dopants, in which the dopants play the role of luminescence centers and the host matrices determine the crystal fields. Thus, the properties of host matrices have prominent effects on the energy transfer process of luminescent materials [Reference Zhou and Yan1]. At present, a wide range of host matrices, such as phosphates, fluorides, oxides, and vanadates, have been utilized as efficient luminescence hosts. In particular, metal vanadates are an important optical host material, possessing many excellent physical characteristics, such as optical properties, electrical properties, optoelectronic properties, and magnetic properties. Particularly, the optical properties play an important role in lighting and display fields, such as fluorescence markers, biological detection, solar cells, laser crystals, and imaging [Reference Bonar, Vermelho, McLaughlin, Marques, Aitchison, Martins-Filho, Bezerra, Gomes and de Araujo6, Reference Li, Chao, Peng and Chen7, Reference Yang, Peng, Zhao and Yu8]. YVO4 single crystal as a typical vanadate has been extensively used as an excellent polarizer and laser host material. Additionally, laser-diode-pumped single-frequency Nd: YVO4 laser sources with low-intensity noise are used widely in the areas of high sensitivity measurements, high-precision interferometry, precision spectroscopy, and optical communications [Reference Liu, Xiong, Zhang, Leng, Li and Gan2, Reference Zhang, Ma, Xie and Peng9].
Due to the wide application of vanadates in ultraviolet absorbents, displays and lighting [Reference Cho and Huh10], solid-state lasers [Reference Pollnau, Gamelin, Lüthi and Güdel11], optical amplifiers [Reference Huignard, Gacoin and Boilot12], electrode materials, and biolabels [Reference Liu, Xiong, Zhang, Leng, Li and Gan2], the preparation of lanthanide ion–doped vanadates with controllable morphologies has attracted much attention [Reference Zhou, Yan and He13]. It is important to explore the preparation of uniform sized vanadates with controllable morphology. YVO4 is an important member in the metal vanadate family. So far, many synthetic methods of YVO4 have been reported. For example, Tang and Chen prepared micron size YVO4: Eu3+, Tm3+, Dy3+ particles by a solvothermal method [Reference Tang and Chen14, Reference Chen, Nguyen, Luu and Di Bartolo15]. Yu et al. fabricated YVO4: Ln3+ (Ln = Eu, Dy, Sm, Er) phosphors by using a sol–gel soft lithography [Reference Yu, Lin, Wang, Fu, Wang, Zhang and Han16]. YVO4 of different particle sizes and morphologies was generally prepared by some moderate synthetic methods, such as solvothermal method [Reference Yu, Li, Song, Sheng, Li, Wu and Chen17], hydrothermal methods [Reference Wang, Qin, Zhang, Wang, Wei, Zhu and Kim18], microwave method [Reference Zhu, Xu, Li, Zhang, Dong, Xu, Xu and Song19], and co-precipitation [Reference Riwotzki and Haase20]. In contrast with the above methods, the sol–gel auto-combustion method is an efficient liquid-phase method for synthesizing various lanthanide-doped luminescence materials [Reference Yu, Lan, Tang and Wang5, Reference Yi, Lu, Zhao, Ge, Yang, Chen and Guo21]. The sol–gel auto-combustion technique uses glycine as a reductant to prepare highly active, homogeneous, and stoichiometric YVO4: Ln3+ (Ln = Eu, Sm, Yb/Er, Yb/Tm) powders. The glycine as an inexpensive reductant candidate could lower the burning temperature of the precursor gel as a result of its stronger reductive ability compared with polyvinyl alcohol, hydrazine compounds, and citric acid. Furthermore, it is feasible to quantitatively incorporate trace elements to obtain homogeneous doping at the molecular level [Reference Buissette, Huignard, Gacoin, Boilot, Aschehoug and Vianaz22, Reference Wang, Lu, Wang, Guo and Guo23, Reference Gai, Li, Yang and Lin24].
In this study, YVO4: Ln3+ (Ln = Eu, Sm, Yb/Er, Yb/Tm) microcrystals with uniform shapes and sizes were prepared by a rapid sol–gel auto-combustion method in the presence of glycine. The influence of annealing temperature on the phase and morphology of samples was examined. The luminescent properties of YVO4: Ln3+ (Ln = Eu, Sm, Yb/Er, Yb/Tm) samples were investigated in detail, and the mechanisms of emission and energy transfer in YVO4: Ln3+ were proposed.
Results and discussion
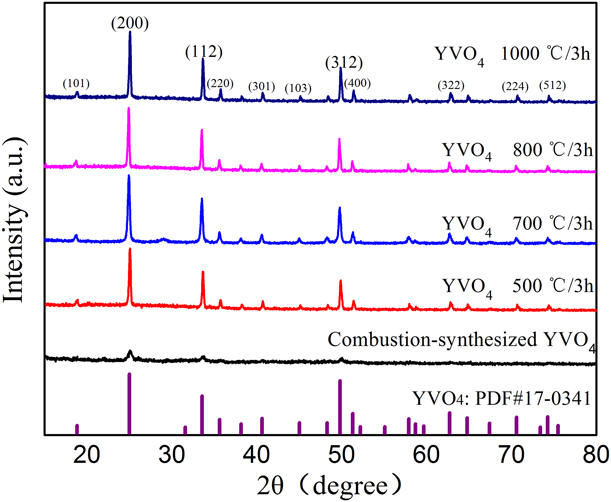
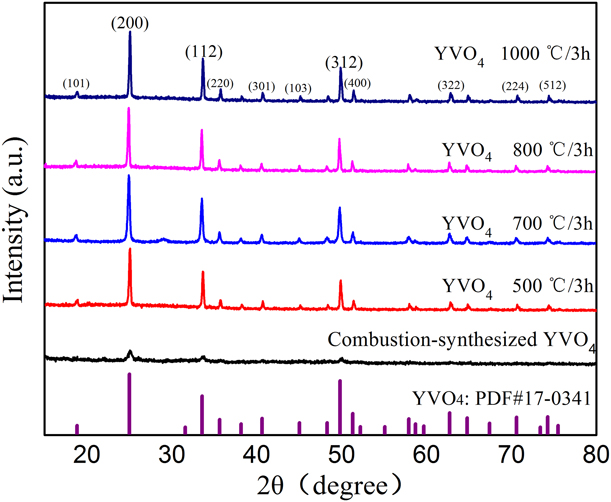
Figure 1 shows X-ray diffraction (XRD) patterns of combustion-synthesized and annealed YVO4 powders in the 2θ range of 10°–80°. From the XRD patterns of the as-synthesized YVO4 powders, it can be seen that the samples were X-ray amorphous, indicating that the combustion-synthesized YVO4 powders were not well crystallized during combustion process [Reference Erdei, Ainger, Ravichandran, White and Cross25]. As the combustion-synthesized powders were annealed at 500, 700, 800, or 1000 °C, the diffraction peaks of YVO4 samples were well matched with pure tetragonal YVO4 (PDF No. 17-0341) with the lattice parameters of a = b = 7.119 Å, c = 6.290 Å, and no second phase peaks were observed. Meanwhile, the intense XRD peaks demonstrated the annealed YVO4 samples were well synthesized at about 500 °C. The calculated crystallite sizes of combustion-synthesized YVO4 at (200) plane, (112) plane, and (312) plane are 166 nm, 180 nm, 225 nm, respectively. The average of above three values is the average grain size (190.3 nm). Meanwhile, the size of undoped YVO4 grains annealed at 500 °C, 700 °C, 800 °C, 1000 °C are calculated to be 360.3 nm, 515.3 nm, 520.0 nm, and 556.3 nm, respectively. The calculated crystallite sizes of undoped YVO4 become large as the temperature increases.
XRD patterns of combustion-synthesized and YVO4 powders annealed at different temperatures.
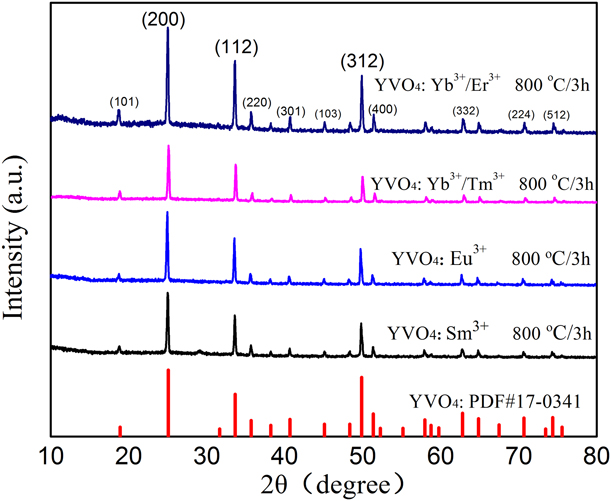
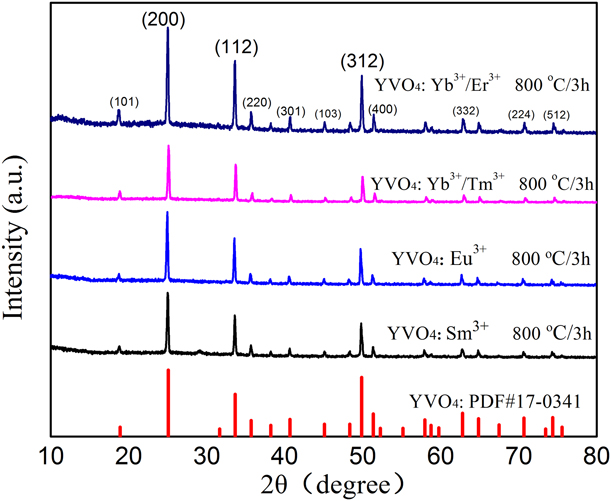
The XRD patterns of YVO4: Ln3+ (Ln = Yb/Er, Yb/Tm, Eu, Sm) samples annealed at 800 °C for 3 h are shown in Fig. 2. All the diffraction peaks can be well indexed to pure tetragonal YVO4 (PDF No. 17-0341) and no second phase peaks were seen, implying the lanthanide ions had not changed the host structure. Since the Ln3+ (Ln = Yb/Er, Yb/Tm, Eu, Sm) ions had the similar radii ( ${R_{{\rm{Y}}{{\rm{b}}^{3 + }}}} = 0.858$ Å,
 ${R_{{\rm{E}}{{\rm{r}}^{3 + }}}} = 0.881$ Å,
 ${R_{{\rm{T}}{{\rm{m}}^{3 + }}}} = 0.869$ Å,
 ${R_{{\rm{E}}{{\rm{u}}^{3 + }}}} = 0.947$ Å,
 ${R_{{\rm{S}}{{\rm{m}}^{3 + }}}} = 0.964$ Å,
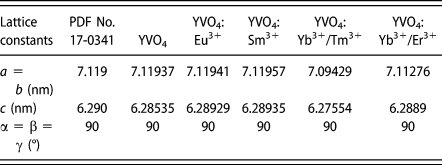
 ${R_{{{\rm{Y}}^{3 + }}}} = 0.900$ Å) and valence state with host Y3+ ions, the Ln3+ ions were estimated to well occupy the Y3+ sites in YVO4. Table I shows the lattice constants of YVO4 and YVO4: Ln3+ samples. The lattice constants of standard YVO4 based on the PDF No. 17-0341 were a = b = 7.119 Å and c = 6.290 Å, and the calculated lattice constants based on the Scherrer equation were a = b = 7.11937 Å and c = 6.28535 Å, which coincided well with the standard YVO4 data. The calculated lattice constants of doped YVO4: Ln3+ (Ln = Yb/Er, Yb/Tm, Eu, Sm) are shown in Table I. The distinction of lattice parameters between the samples may be due to the difference in ionic radii of doped rare-earth ions.
XRD patterns of annealed YVO4: Ln3+ (Ln = Yb/Er, Yb/Tm, Eu, Sm) samples.
Lattice constants of annealed (800 °C/3 h) samples.

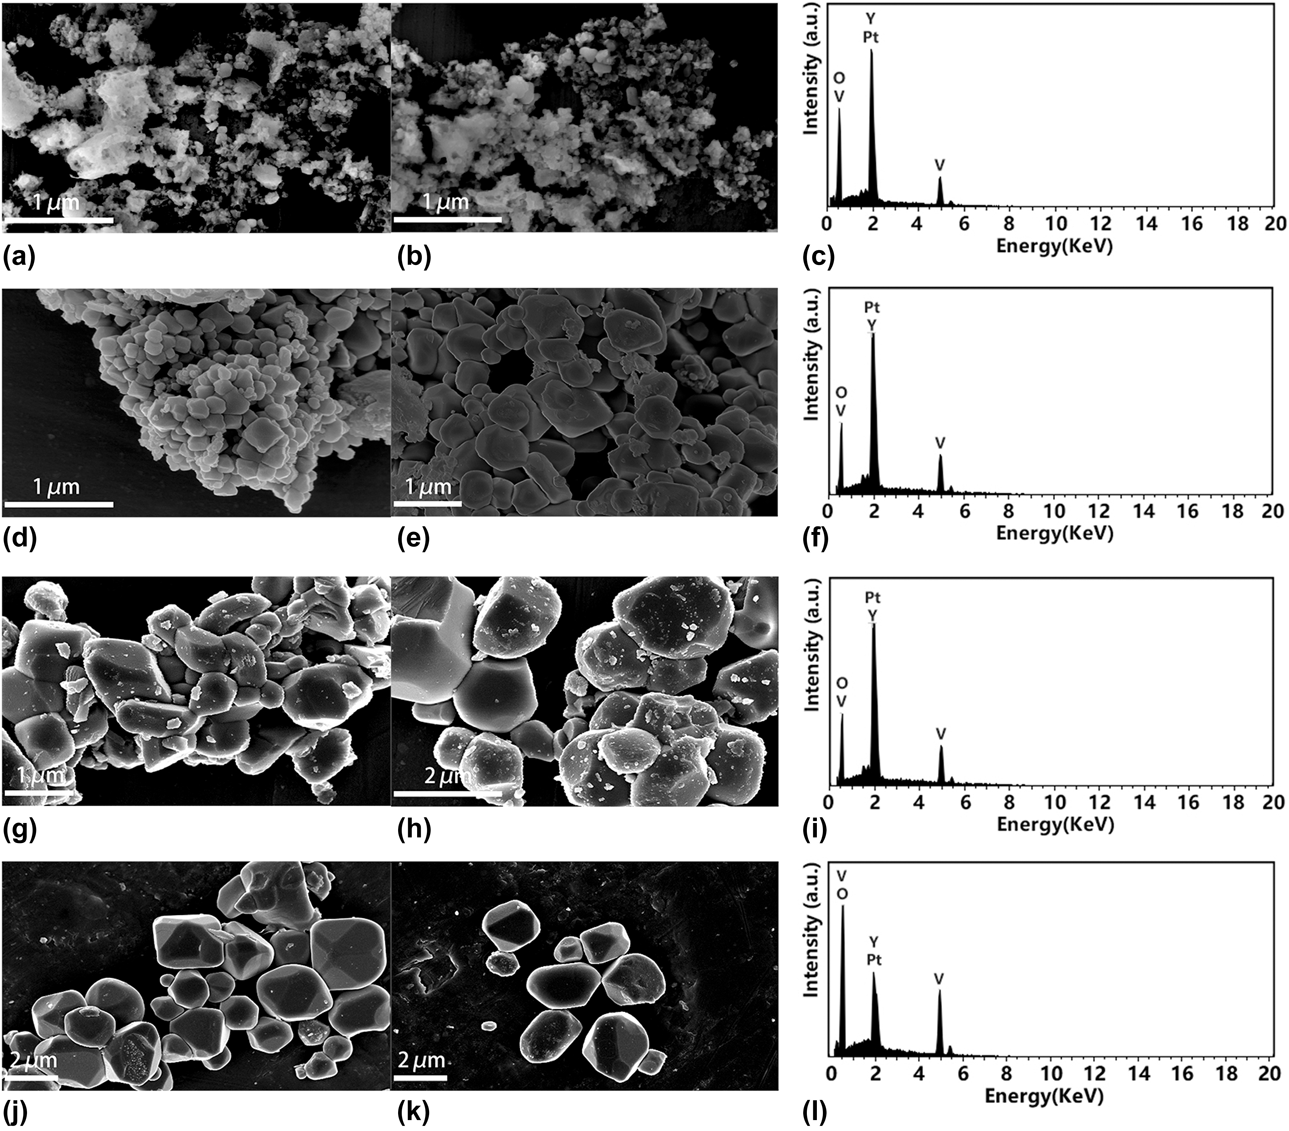
Scanning electronic microscope (SEM) images and energy dispersion spectra (EDS) of undoped YVO4 samples are shown in Figs. 3(a)–3(l). Figures 3(a) and 3(b) show the SEM images of combustion-synthesized YVO4 powders. The figures clearly show that the YVO4 powders were porous, which can be attributed to the releasing of a large amount of gases during combustion reaction process [Reference Jiang, Yang, Zheng, Wu and Chen26, Reference Jiang, Yang, Zheng, Wu and Chen27]. Figures 3(d) and 3(e) show the SEM images of annealed (500 °C) YVO4 samples. It is clearly observed that YVO4 microcrystals are slightly rhombus in shape. Figures 3(g) and 3(h) show that the particle sizes of annealed (800 °C) YVO4 samples are 0.2–2 μm. In contrast, the calculated crystallite sizes of undoped YVO4 annealed at 500 °C and 800 °C were 360.3 nm and 520.0 nm, respectively. The result indicates that the single YVO4 particle is composed of several small YVO4 crystalline grains. As the annealing temperature increased to 1000 °C, the size of YVO4 microcrystals became larger, and the polyhedral shape of grains became more prominent, as shown in Figs. 3(j) and 3(k). The EDS results demonstrate the presence of vanadium (V), yttrium (Y), oxygen (O), and platinum (Pt) in the YVO4, as shown in Figs. 3(c), 3(f), 3(i), and 3(l). The appearance of Pt element was due to the uniform spraying of Pt on the sample surface.
(a, b) SEM images of combustion-synthesized YVO4. (c) EDS spectra of combustion-synthesized YVO4. SEM images of YVO4 annealed at (d, e) 500 °C, (g, h) 800 °C, and (j, k) 1000 °C. EDS spectra of YVO4 annealed at (f) 500 °C, (i) 800 °C, and (l) 1000 °C.

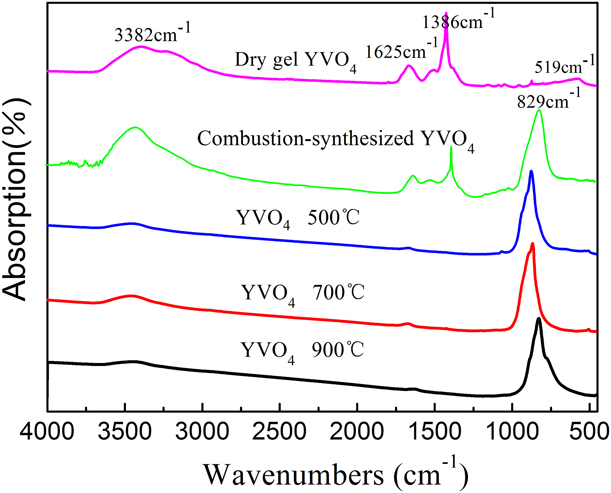
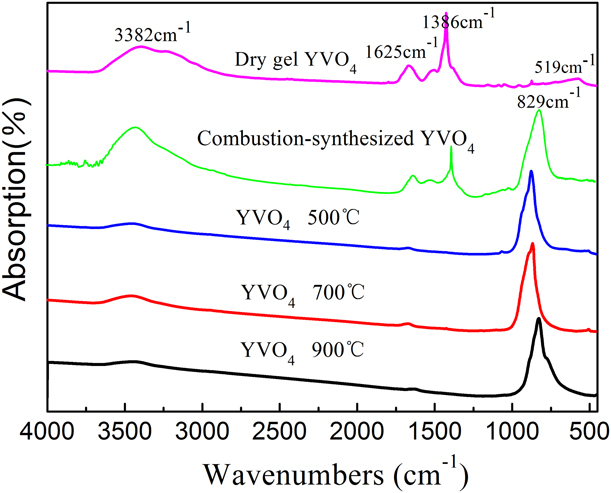
Figure 4 displays the FT-IR spectra of dry gel and YVO4 samples with different treatment. From the FT-IR spectra of dry gel, the peak at 3382 cm−1 can be observed, which corresponds to the stretching vibration and bending vibrations of the O–H [Reference Yu, Li, Song, Sheng, Li, Wu and Chen17, Reference Wang, Qin, Zhang, Wang, Wei, Zhu and Kim18, Reference Gai, Li, Yang and Lin24]. The peak at 1625 cm−1 is attributed to the stretching vibration and bending vibrations of O–H. This indicates that the dry gel contains a large amount of O–H groups on their surfaces. A sharp peak at 1386 cm−1 can be observed, which is caused by the characteristic absorption bands of NO3− [Reference Yu, Lin and Fang28, Reference Liu, Yang, Xiong, Zhang, Leng, Li and Gan29]. Meanwhile, the spectra of annealed YVO4 samples show that the characteristic bands of VO43− are located in the range of 500–1000 cm−1. A strong absorption band at 829 cm−1 and a weak band at 519 cm−1 can be observed, which are due to the absorption of V–O (from VO43− group) and Y–O bonds, respectively [Reference Yu, Li, Song, Sheng, Li, Wu and Chen17, Reference Yu, Lin and Fang28]. The FT-IR spectra of annealed YVO4 only present a strong absorption band at 829 cm−1 and no other peaks, indicating the sample has been crystallized after annealing at 500 °C, which is in excellent accord with the XRD results. In contrast with the FT-IR spectra of gel, it is clearly observed that the typical peaks of VO43− (829 cm−1) of annealed YVO4 samples are very strong and other absorption of organic functional groups is weak [Reference Zhang, Fu, Niu, Sun and Xin30, Reference Zhang, Fu, Niu and Xin31]. Here, the typical spectral characteristics of NO3− nearly had not been observed, suggesting the complete reaction of metal nitrates and the formation of YVO4 products [Reference Zhang, Fu, Niu and Xin31].
FT-IR spectra of the dry gel and the annealed YVO4 samples.
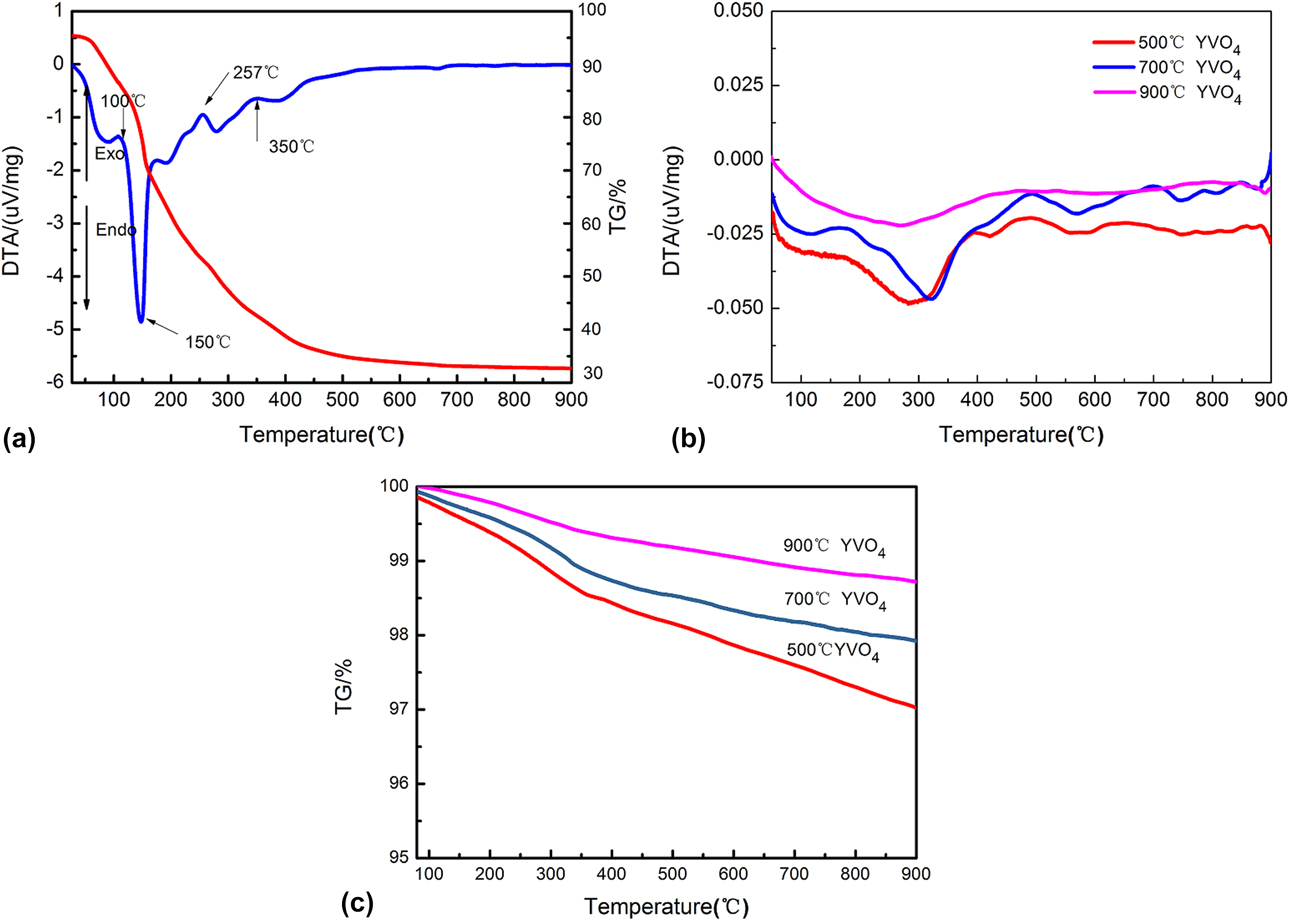
The physical and chemical changes of precursor gels in the combustion reaction process can be reflected by differential thermal analysis–thermogravimetry (DTA-TG) technique. Figure 5(a) displays the DTA-TG curves of the gel on heating at 8 °C/min. The thermal evolution of gel can be divided into three stages according to the DTA curves. A weak endothermic peak at about 100 °C was attributed to the evaporation of water in the gels. The strong exothermic behaviors at about 150 °C can be assigned to the redox reaction between vanadate acting as oxidant and glycine acting as reductant [Reference Yu, Li, Song, Sheng, Li, Wu and Chen17]. A large weight loss can be observed in the TG curve. The weak exothermic behaviors in the 500–900 °C region were a result from slow burning of residual organic matters [Reference Jiang, Yang, Zheng, Wu and Chen32, Reference Jiang, Liu, Xu, Liu, Wu, Luo and Zhang33]. Figures 5(b) and 5(c) show the DTA and TG curves of annealed YVO4 samples, respectively. From the DTA curve in Fig. 5(b), a weak exothermic peak at about 320 °C can be observed, which may be attributed to the slow oxidation of residual organic matters. Meanwhile, it can be noted from the TG curve in Fig. 5(c)that the weight loss of annealed samples was very slight (about 1–2%). The small amount of weight loss can be due to the evaporation of a small amount of physically adsorbed water and the oxidation of residual organic matters.
(a) The DTA-TG curves of gel of fabricating YVO4 powders. (b) DTA and (c) TG curves of annealed YVO4 samples at different temperatures.
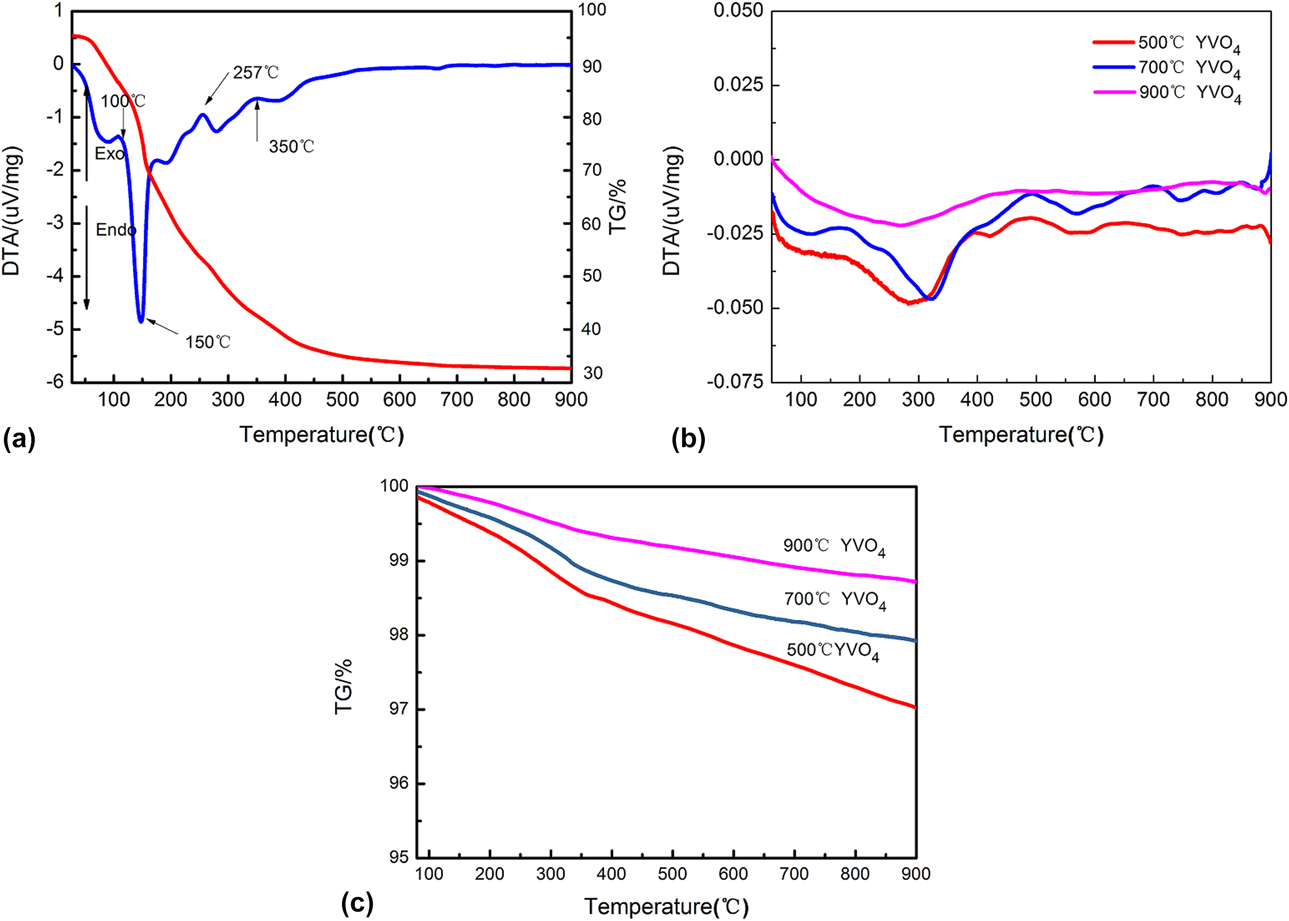
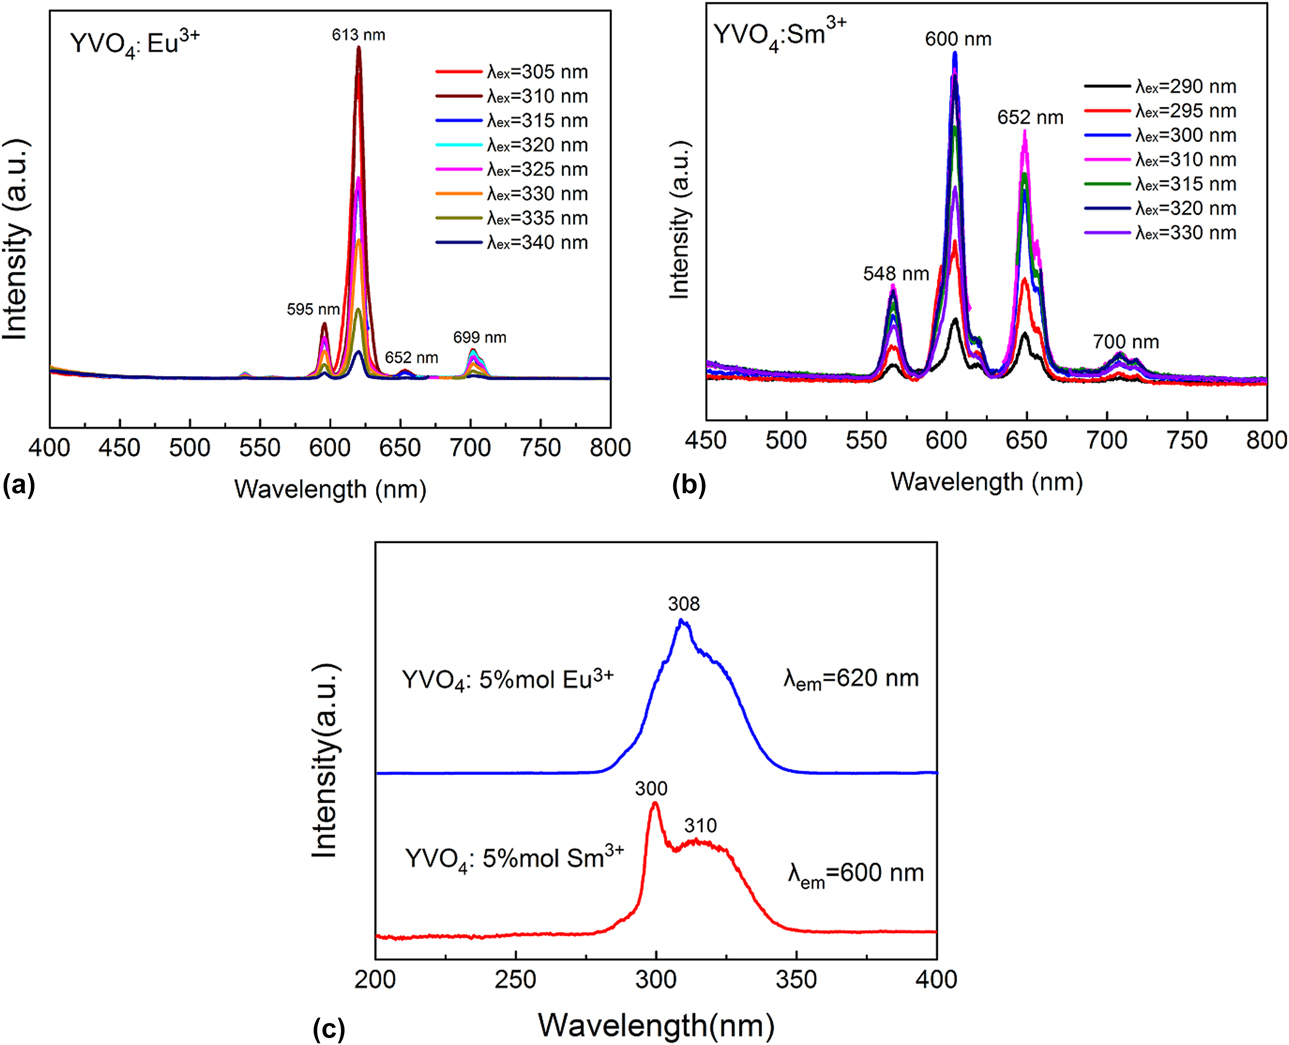
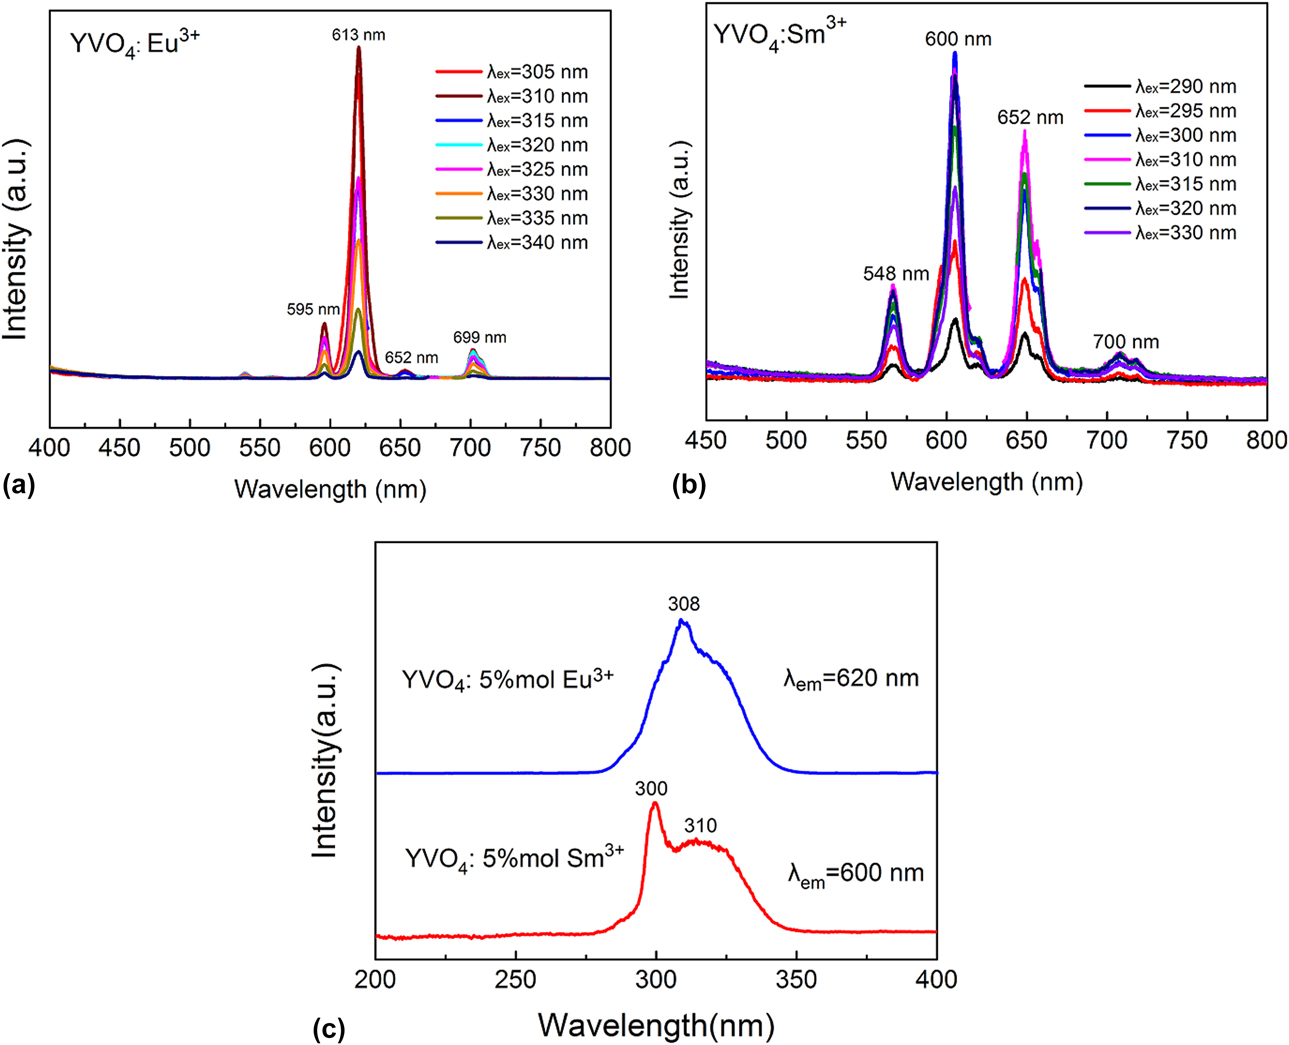
Figure 6(a) shows the emission spectra of annealed (800 °C, 3 h) YVO4: Eu3+ samples at different excitation wavelengths. It can be observed that four emission bands are located at about 596 nm, 620 nm (strongest), 653 nm, and 701 nm, which can be due to the characteristic emissions of Eu3+ ions, originating from the transitions of 5D0 → 7F1, 5D0 → 7F2, 5D0 → 7F3, 5D0 → 7F4, respectively [Reference Li, Chao, Peng and Chen7, Reference Tian and Mho34, Reference Zhou, Chen and Yan35, Reference Liang, Kuang and Li36]. Among those emissions, the red emission at 620 nm was the strongest. The high emission intensity was believed to be a result of the absence of an inversion symmetry at the Eu3+ lattice positions (D2d symmetry) [Reference Li, Chao, Peng and Chen7, Reference Fu, Jiu, Zhang, Sun and Wang37]. No emission from VO43− group was found, suggesting efficient energy transfer from VO43− to Eu3+ in the phosphor microcrystals. The positions of emission lines of YVO4: Sm3+ are assigned in Fig. 6(b). The characteristic transition positions of Sm3+ at 548 nm, 600 nm, 652 nm and 700 nm are due to 4G5/2 → 6H5/2, 4G5/2 → 6H7/2, 4G5/2 → 6H9/2 and 4G5/2 → 6H11/2, respectively [Reference Zhou, Yan and He13, Reference Yu, Lin, Wang, Fu, Wang, Zhang and Han16, Reference Wang, Qin, Zhang, Wang, Wei, Zhu and Kim18]. For the YVO4: Sm3+ sample, the strongest emission peak was centered at 600 nm, presenting the typical transition of Sm3+. No emission from the VO43− groups was observed, as well as the situations of YVO4: Eu3+, indicating efficient energy transfer also occurs from VO43− to Sm3+ [Reference Xu, Kang, Li, Hou, Zhang, Yang, Li and Lin38, Reference Cavalli, Angiuli, Belletti and Boutinaud39]. The excitation spectra of YVO4: Ln3+(5 mol%) (Ln = Eu, Sm) are depicted in Fig. 6(c). The excitation spectra were collected at the emission spectra of 620 and 600 nm. The strong and broad band around 308 nm of YVO4: Eu3+ can be attributed to charge transfer from the oxygen ligands to the central vanadium ions inside the VO43− groups. The excitation spectra of YVO4: Sm3+ consist of a strong band with a maximum at 310 nm and a sharp peak at 300 nm. The strong band around 310 nm was associated with the V → O charge transfer from the oxygen ligand to the central vanadium ions [Reference Cho and Huh3]. In addition, the excitation peak at 300 nm can be attributed to the Sm → O charge transfer.
(a) Emission spectra of the annealed (800°C/3 h) YVO4: Eu3+ (5 mol%) microcrystals at different excitation wavelengths. (b) Emission spectra of the annealed (800°C/3 h) YVO4: Sm3+ (5 mol%) microcrystals at different excitation wavelengths. (c) Excitation spectra of annealed (800°C/3 h) YVO4: Eu3+ (5 mol%) and YVO4: Sm3+ (5 mol%) microcrystals at different excitation wavelengths.
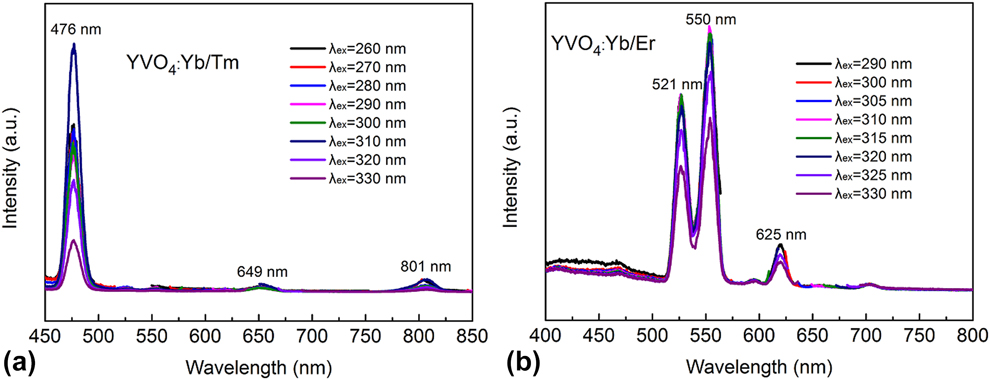
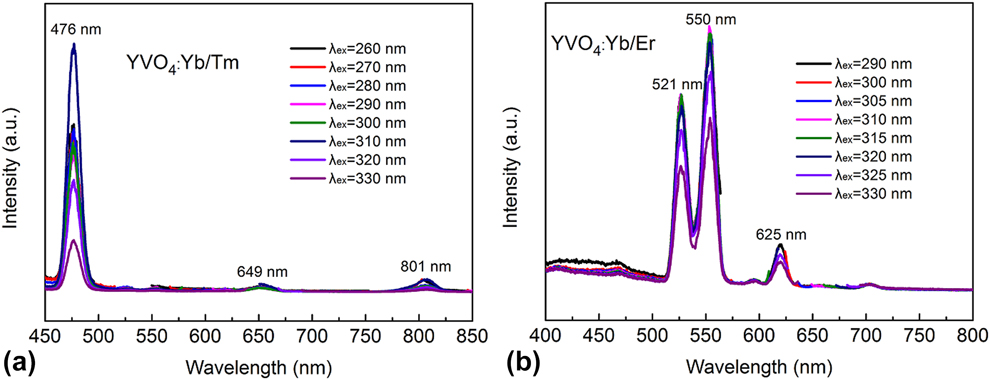
Yb3+ is an excellent sensitizing agent that can absorb excited energy and transfer to activators, thereby greatly enhancing the luminescence intensity. The luminescence properties of Yb3+/Tm3+ were detected in YVO4 host materials, as shown in Fig. 7(a). The emission peaks centered at about 476 nm (1G4 → 3H6), 649 nm (1G4 → 3H4), and 801 nm (3H4 → 3H6) corresponded to the characteristics emissions of Tm3+ ions [Reference Bonar, Vermelho, McLaughlin, Marques, Aitchison, Martins-Filho, Bezerra, Gomes and de Araujo6, Reference Tang and Chen14]. The electronic dipole transition (1G4 → 3H6, 476 nm) was the strongest emission band for the YVO4: Yb3+/Tm3+ samples. On the other hand, the 649 and 801 nm emissions were too weak to detect. Moreover, the emission band of YVO4 (about 500 nm, broad band) was not observed, suggesting that the host material can effectively transfer the absorbed energy to active ions. The emission spectra of YVO4: Yb3+/Tm3+ microcrystals at different excitation wavelengths consisted of the representative emissions of Er3+, as shown in Fig. 7(b). There are three emission peaks at about 521 nm, 550 nm and 625 nm, which originate from 2H11/2 → 4I15/2, 4S3/2 → 4I15/2 and 4F9/2 → 4I15/2 transitions of Er3+, respectively [Reference Chen, Nguyen, Luu and Di Bartolo15, Reference Buissette, Huignard, Gacoin, Boilot, Aschehoug and Vianaz22]. The emission bands at 521 and 550 nm were prominent among the three emission bands, and the 625 nm was relatively weak. No emission of VO43− was found, indicating that the energy transfer from VO43− to Er3+ was effective.
(a) Emission spectra of the annealed (800°C/3 h) YVO4: Yb/Tm microcrystals at different excitation wavelengths. (b) Emission spectra of the annealed (800°C/3 h) YVO4: Yb/Er microcrystals at different excitation wavelengths.
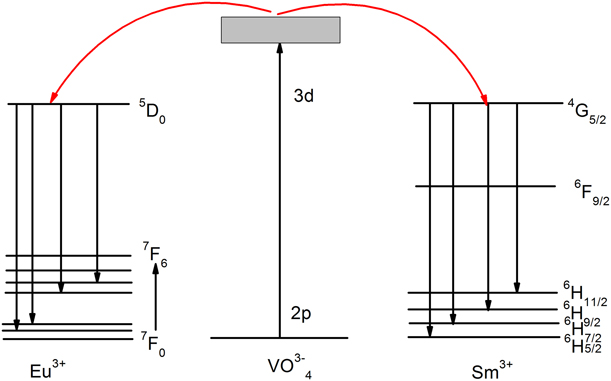
The vanadate-based material is a typical matrix-sensitized luminescence material. Here, the YVO4 has a strong absorption and can efficiently transmit energy to the active ions, thereby emitting the characteristic spectra of activated ions. Figure 8 shows the schematic diagram of energy transferred between VO43− and Ln3+ (Ln = Eu, Sm) in YVO4: Ln3+, which explained the mechanism of multi-color emission and the process of energy transfer under ultraviolet excitation [Reference Liu, Xiong, Zhang, Leng, Li and Gan2, Reference Yan and Wu4]. An ultraviolet photon can be absorbed in the VO43− group in the YVO4 matrix and an electron at the oxygen 2p level is excited to the vanadium 3d level. The electron at the excited state relaxed to a metastable state by the nonradiative transition and finally returned to the ground state by emitting photons [Reference Liu, Xiong, Zhang, Leng, Li and Gan2]. When Ln3+ ions (Ln = Eu, Sm) were incorporated into the host matrices of YVO4, the energy transferred from VO43− to Ln3+ (Ln = Eu, Sm). For the YVO4: Eu3+, the transferred energy promoted Eu3+ from ground state 5D0 to excited 7FJ (J = 1, 2, 3, 4) states and subsequently brought forth four emissions centered at 596 nm, 620 nm, 653 nm, and 701 nm, following a relaxation to the ground state 5D0. As for YVO4: Sm3+, after absorbing the transferred energy, Sm3+ electrons were promoted from ground state 6H5/2 to excited 4G5/2 states and subsequently brought forth four emissions centered at 548 nm, 600 nm, 652 nm, and 700 nm, following related transition 4G5/2 → 6H5/2, 4G5/2 → 6H7/2, 4G5/2 → 6H9/2, and 4G5/2 → 6H11/2.
Schematic diagram of energy transfer between VO43− and Ln3+ (Ln = Eu, Sm) in YVO4: Ln3+.

From the emission spectra of YVO4: Ln3+ (Ln = Eu, Sm, Yb/Tm, Yb/Er), it can be known that all the extraordinary typical emissions of Ln3+ spectra can be detected, suggesting that the doped Ln3+ ions can be excited through matrix absorption and the corresponding energy transfer process is extremely efficient [Reference Zhou, He and Yan40]. Totally speaking, YVO4 is an excellent host material for the luminescence of lanthanide ions.
Characterization
Powder X-ray diffraction (XRD) patterns were obtained with a Bruker D8 diffractometer (BRUKER AXS GMBH, Germany) using Cu Ka radiation with 40 mA and 40 kV at a scan rate of 8°/min from 10° to 80°. The emission spectra of the as-prepared samples were recorded with a fluorescence spectrometer (Hitachi F-4600, Japan) at the room temperature. The morphologies and sizes of samples were examined using scanning electron microscope (SEM; Sirion 200, America FEI). TG and DTA were carried out at a heating rate of 8 °C/min using a thermal comprehensive analyzer (HITACHI, Japan). FTIR spectra were performed in 400–4000 cm−1 range using Nicolet 6700 spectroscope (Thermo Fisher Ltd., USA) with KBr pellets.
Conclusions
In summary, YVO4: Ln3+ (Ln = Eu, Sm, Yb/Er, Yb/Tm) were synthesized via a simple sol–gel auto-combustion method. All the diffraction peaks of samples are well indexed to pure YVO4, and the doped lanthanide ions did not change the host structure. The combustion-synthesized YVO4 powders exhibited porous feature due to the release of a large amount of gases during auto-combustion process. The annealed YVO4 microcrystals had obvious polyhedral shape. As the annealing temperature increased to 1000 °C, the size of YVO4 microcrystals increased to 2 μm, and the polyhedral shape of grains became more prominent. The luminescence properties of YVO4: Ln3+ (Ln = Eu, Sm, Yb/Er, Yb/Tm) indicated that all the samples exhibited typical emission spectra of Ln3+ after incorporating Ln3+ ions, suggesting that the Ln3+ ions were well doped in the YVO4 host lattice and could be excited efficiently through matrix absorption. Overall, YVO4 is an excellent host material for the luminescence of lanthanide ions.
Experimental section
Chemicals
The following raw materials were used in this study: Y2O3 (99.99%), Eu2O3 (99.99%), Sm2O3 (99.99%), Yb2O3 (99.99%), Tm2O3 (99.99%), Er2O3 (99.99%), ammonium metavanadate (NH4VO3, AR), glycine (C2H5NO2, AR), and nitric acid (HNO3, 5 mol/L).
Synthesis
A typical experimental process to synthesize undoped YVO4 powder is described below: 1.13 g Y2O3 was dissolved in 5 mL dilute nitric acid (concentration 5 mol/L) to obtain an Y(NO3)3 solution by heating of 45 °C and stirring using a magnetic agitator. 1.17 g NH4VO3 was added into the above solution under vigorous magnetic stirring. Subsequently, 1.5 g glycine was added into the above solution. The molar ratio of Y2O3:NH4VO3:glycine is 1:2:3. The mixed solution was continuously stirred until a sticky gel formed. Some of the sticky gel was transferred to drying oven at 55 °C for 12 h to obtain the dry gel. The other sticky gel was shifted to a large alumina crucible. The sticky gel was ignited at a starting temperature of 300 °C in an open furnace. Finally, voluminous porous powders were obtained. The prepared powders were annealed at temperatures from 500 to 1000 °C for 3 h. The other YVO4: Ln3+ (Ln = Eu, Sm, Yb/Er, Yb/Tm) samples were synthesized by a similar process. The source of Ln3+ ions was metal oxides. The molar ratio of Y3+:Yb3+:Tm3+/Er3+ was 77:20:3. The molar ratio of Y3+:Sm3+/Eu3+ was 95:5.
Acknowledgments
This work was supported by Natural Science Foundation of China (No. 51701098) and General Administration of Quality Supervision, Inspection and Quarantine of the People’s Republic of China (No. 2017IK197). This work was also sponsored by the Opening Project of State Key Laboratory of Crystal Material in Shandong University (KF1706) and K.C. Wong Magna Foundation in Ningbo University.