I. INTRODUCTION
The quest for a novel electrolyte for solid oxide fuel cells (SOFCs) has been a prime concern for researchers over the past few decades.Reference Owens1, Reference Stambouli and Traversa2, Reference Yamamoto3, Reference Steele and Heinzel4 Ceramic oxides based on various crystal structures have been explored for their suitability as electrolytes in SOFCs.Reference Kharton, Marques and Atkinson5, Reference Kilner6, Reference Nakayama and Sakamoto7 Perovskite-type Sr- and Mg-doped lanthanum gallate (LSGM) is a new electrolyte material with high conductivity suitable for intermediate temperature solid oxide fuel cells.Reference Feng and Goodenough8 Divalent cation-doped LaGaO3 composition exhibits a conductivity of about 0.16 S/cm at 800 °C. This value is higher relative to the conductivity of yttria-stabilized zirconia, which is about 0.034 S/cm at 800 °C.Reference Huang and Goodenough9 Compared to CeO2-based electrolytes, the electrolytic domain of doped LaGaO3 extends to substantially lower oxygen chemical potentials. However, doped LaGaO3 system suffers from several disadvantages, namely, the high cost of gallium, reduction of gallium to lower valance states, vaporization of gallium, formation of secondary phases, lower mechanical strength, and significantly high reactivity with other components of the cell.Reference Fergus10, Reference Djurado and Labeau11, Reference Sammes, Keppeler, Näfe and Aldinger12, Reference Yamaji, Negishi, Horita, Sakai and Yokokawa13.
In search of alternate electrolyte materials with relatively low cost, moderate thermal expansion, and higher stability with respect to reduction and volatilization compared to doped CeO2−δ and LSGM, doped perovskite-based aluminates such as LnAlO3 have been investigated.Reference Geller and Bala14 In particular, the electrical properties of LaAlO3 have been investigated by several researchers, and the material is a potential candidate to overcome these limitations due to its stability and cost-effectiveness.Reference Lybye, Poulsen and Mogensen15, Reference Alcock, Fergus and Wang16 The electrolyte, with different kinds of dopants either on the A- or on the B-site, is a mixed ionic and p-type electronic conductor at high oxygen partial pressures and ionic conductor at low partial pressures.Reference Kilner, Barrow, Brook and Norgett17 It has been reported that Nd0.9Ca0.1AlO2.95 exhibits a rather high oxygen ion conduction and high transference number of oxide ions over a wide range of oxygen partial pressures.Reference Ishihara, Matsuda, Mizuhara and Takita18 Electrical conductivity of SmAlO3 substituted by Ni, Mg, or Zn ions on Al site has been measured as a function of temperature and oxygen partial pressure. From the oxygen partial pressure dependence of electrical conductivity, SmAl0.95Zn0.05O3−δ is a mixed conductor of oxide ion and hole from 700 to 1000 °C.Reference Tsuji, Ohashi and Yamamura19 A new family of perovskite fast ion conductor, GdAlO3, in the absence of any dopant exhibits a total conductivity of 1.32 × 10⁻³ S/cm at 1000 °C. The electrical conductivity of 15% calcium substitution at A-site is reported to be 0.057 S/cm at 1000 °C.Reference Sinha, Sharma and Gopalan20
Another potential orthoaluminate family suitable for solid electrolyte applications is the ABO3-type perovskite YAlO3, with Y3+ cation on the A-site and Al3+ cation on the B-site.Reference Medraj, Hammond, Parvez, Drew and Thompson21, Reference Yasuda, Ohnaka, Mizutani and Waku22 We have reported the total conductivity of the undoped and Ca-substituted YAlO3 synthesized by the solid-state and citrate gel route.Reference Hariharan, Venkatasubramanian and Gopalan23, Reference Hariharan and Gopalan24 The total conductivity of undoped YAlO3 has been reported to be about 2.5 × 10⁻⁶ S/cm at 800 °C. When a divalent cation is doped on to the Y3+ site, a drastic three-order improvement in conductivity is noticed. The total conductivity of 2.5 mS/cm at 800 °C has been recorded for x = 0.1 composition of Ca-doped YAlO3 prepared by the citrate gel route.
The effect on electrical properties of YAlO3 system by using other suitable A-site dopant cations is worth an investigation so as to obtain clarity on the optimal divalent dopant cation on the A-site, suited for this system. The present work aims in the synthesis and electrical conductivity measurements of Sr-substituted YAlO3, thereby to draw a comparative study of the influence of A-site dopant cations on the electrical conductivity of the yttrium aluminate system.
II. EXPERIMENTAL
A. Synthesis
Synthesis of doped yttrium aluminate powders of compositions Y1−xSrxAlO3−δ (x = 0.02–0.1) was attempted by the traditional solid-state route. The starting materials taken were Y2O3 (99.99% pure; Alfa Aesar, Ward Hill, MA), Al2O3 (99.99+% pure; Aldrich, St. Louis, MO), and SrCO3 (99.5% pure; Cerac, Albuquerque, NM). The pressed pellets were sintered at different temperatures from 1525 to 1600 °C for 12 h. But the sintered density of the pellets was very poor and so chemical route of synthesis was sought to prepare denser samples. Similar to Anderson et al.,Reference Anderson, Mather, Marques, Sinclair and West25 Sr-doped yttrium aluminate powders were prepared by a chemical route, namely, the citrate gel route to improve the density of the samples. The starting material taken were Y (NO3)3·6H2O (99.9% pure; Alfa Aesar), Al (NO3)3·9H2O (99.99+% pure; Aldrich), Sr (NO3)2 (99.99+% pure; Alfa Aesar), and citric acid. The methodology, discussed elsewhere,Reference Hariharan and Gopalan24 was used in the synthesis of the sample. The calcined powders were uniaxially cold pressed at 30 kg/cm2 for 60 s into 10-mm diameter pellets. The pressed pellets were sintered at 1600 °C for 10 h. To compare the effect of dopant on the A-site, undoped and Ca-doped YAlO3 samples were synthesized by the citrate gel route, an elaborate description of the starting materials used and the route of synthesis mentioned elsewhere.Reference Hariharan and Gopalan24
B. Characterization
X-ray diffraction (XRD) analysis of the powders was carried out using CuKα radiation with 40 kV acceleration voltage and 30 mA filament current (X’Pert Pro; PANalytical, Westborough, MA). The patterns were recorded between 20 and 100° with a slow scanning rate of 0.01°/s.
Density was calculated for the pellets from their geometry and lattice parameters. The relative densities with respect to the theoretical density were estimated. The theoretical density was calculated to be about 5.35 g/cm3 from the crystallographic data and was matched with the data reported in the literature.Reference Diehl and Brandt26
Electrical conductivity measurements of the sintered pellets were conducted in air (p O2 = 0.21 atm) using a HP-4192A impedance analyzer (5–15 MHz; Santa Clara, CA) in the cooling cycle. The initial and final temperatures of measurement were 300 and 800 °C, respectively, with intervals of 25 °C each and a voltage of 1 V was applied. The samples were mounted on PROBOSTAT™ sample holder (Norwegian Ceramic Society, Trondheim, Norway). All the measurements were conducted 30 min after the final temperature had reached so as to ensure that the sample and the surrounding atmosphere were in thermal equilibrium when the experiment was conducted. Sample preparation involved polishing both the surfaces of the sintered pellets with a series of increasing finer grade of SiC grinding papers and a uniform coating with platinum paste (Alfa Aesar, Ward Hill, MA) on both sides. The organic content in the paste was removed by firing the platinum coated pellets at 1100 °C for 2 h under controlled heating and cooling conditions. The resistance and capacitance values pertaining to the different regions of the sample were extracted from the Nyquist plot plotted using commercial software.
The microstructure of the sintered pellets was examined by scanning electron microscopy (SEM) in a Hitachi S-3400N SEM equipment (Pleasanton, CA). The composition analysis of selected samples was conducted using energy dispersive spectrum (EDS) in a Thermo Noran EDS analyzer (West Palm Beach, FL). Sample preparation involved polishing the sintered pellets with various grits of silicon carbide sheets followed by thermal etching at 1400 °C for 6 h. Due to the ceramic nature of the samples, a conducting coating was required. All the samples were carbon coated using a Hummer VI A (Union City, CA) sputtering system before the analysis.
III. RESULTS AND DISCUSSION
A. Diffraction studies of Sr-doped yttrium aluminate system
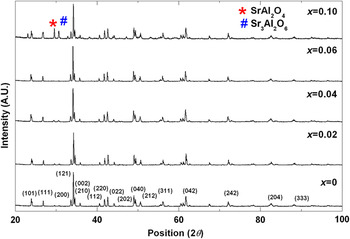
The results of the XRD measurements for the Sr2+-doped yttrium aluminate compositions synthesized by the citrate gel route are summarized. The diffraction pattern of undoped yttrium aluminate composition prepared by the same route is also included in Fig. 1 for comparison. Second phases besides the required orthorhombic perovskite phase have been observed for x > 0.06 compositions. The compositions x= 0–0.06 are considered to reveal a single phase. The addition of SrO is tolerated in LaAlO3 due to the higher interatomic distance of about 2.68 Å between La and Al ions, which can be accounted for lesser electrostatic repulsion between the cations. A similar comparison can be drawn with YAlO3 where the Al–Y interatomic distance is about 3.1–3.4 Å.Reference Chen, Zhao, Cao, Dong, Ding and Zhou27, Reference Stevenson, Armstrong, McGready, Pederson and Weber28 Beyond x = 0.06, presence of a minor phase is observed. Since single phase is observed up to x = 0.06 composition, the solubility limit of Sr2+ ion in Y3+ site appears limited to 6%. The additional peaks map with the Sr3Al2O6 or SrAl2O4 phase as shown in the registers of ICDD database (ICDD No. 24-1187) and (ICDD No. 34-0379), respectively.
XRD patterns of selective compositions of Y1−xSrxAlO3−δ system (x = 0–0.1).

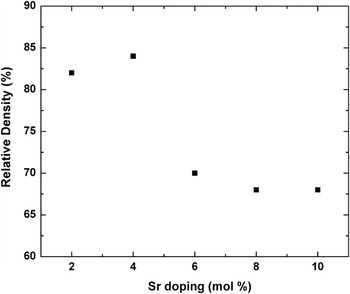
The variation of sintered density of Y1−xSrxAlO3−δ system with respect to increasing dopant cation levels has been illustrated in Fig. 2. It is observed that after sintering at 1600 °C for 10 h, the density of the system decreases with increasing Sr doping levels. The sintered density decreases from about 82% for x = 0.02 to 64% for x = 0.1 composition. Within the solid solubility limit, initially, a slight improvement in density has been observed when other factors such as powder processing parameters, calcination, and sintering conditions remain constant. Around the dissolution limit, a steep drop in density has been noted. In the two-phase region, the decrease in sintered density has been marginal when the strontium content is increased from 8 to 10 mol%. Such a systematic decrease in the sintered density with increase in strontium doping level in other rare earth aluminates has already been observed and reported.Reference Anderson, Mather, Marques, Sinclair and West25, Reference Nguyen, Dokiya, Wang, Tagawa and Hashimoto29
The variation of sintered density of Y1−xSrxAlO3−δ samples as a function of Sr doping.

Among the dopant systems, Ca-doped YAlO3 reveals higher density values (>90%) than Sr-doped YAlO3 (∼70%). Also, it has been observed that the dissolution limit for Sr2+ is smaller as compared with the solubility limit of about 12% for Ca2+ in the Y3+ sites.Reference Hariharan and Gopalan24 The fall in density and solubility in Sr2+ as compared to Ca2+ may be an effect of the ionic size. The ionic radius of Sr2+ (1.31 Å, in 8-fold coordination) is larger than Ca2+ (1.18 Å, in 8-fold coordination). Hence, Sr2+ is not easier to be substituted for Y3+ (1.08 Å, in 8-fold coordination) site than Ca2+.Reference Shannon30
B. AC impedance spectroscopic studies
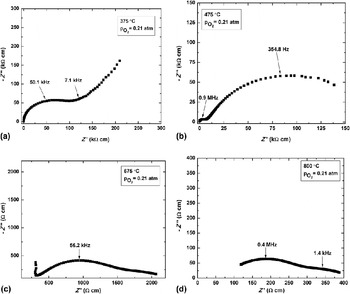
Impedance measurements in this study have been performed between 300 and 800 °C in air. The purpose of the measurements conducted between 300 and 500 °C has been primarily to distinguish the contributions of the grain interior and grain boundary to the total conductivity of the electrolyte. Figures 3(a)–3(d) show the Nyquist plots of Y0.96Sr0.04AlO3−δ composition at different temperatures in air. All the plots have been normalized for the sample geometry and are therefore comparable. Since these materials are polycrystalline in nature, arcs instead of semicircles are observed. At 375 °C [Fig. 3(a)], the semicircle corresponding to the grain interior of the electrolyte is visible (associated with a capacitance value of about 10−12 F). In Fig. 3(b), at 475 °C, two distinct arcs are seen: a smaller arc corresponding to the bulk and a larger arc to the grain boundary components of the electrolyte as manifested in the capacitance values. A capacitance value in the 10−12 F range corresponds to the bulk region, and a capacitance in the 10−10 F range corresponds to the grain boundary region of the electrolyte. As electrode reaction kinetics are sluggish, arc corresponding to electrode reaction is not visible at this temperature. As the temperature increases, in Fig. 3(c), relaxation frequency of bulk increases beyond the upper frequency limit of impedance analyzer, and hence, it occurs as a spike. As the temperature increases, electrode reaction rate increases, as seen from Fig. 3(d), and this process falls in the detectable limit of impedance analyzer with a capacitance value of about 10−8 F.Reference Bauerle31
Nyquist plots of Y0.96Sr0.04AlO3−δ composition at different temperatures in air.

C. Electrical conductivity studies
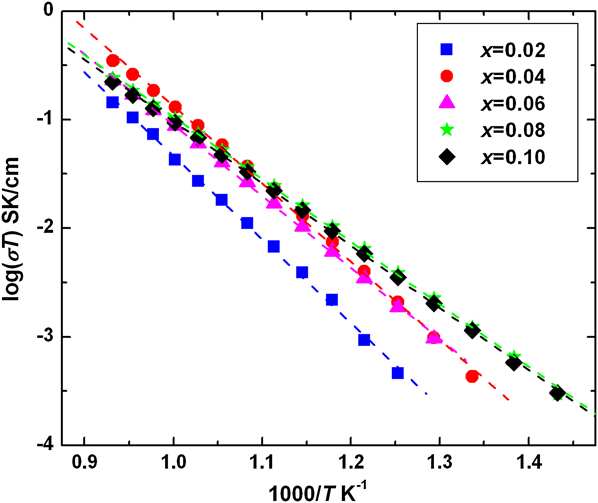
Arcs have been fitted for the experimental data and real axis value of the fit gives the resistance. Total resistance, the sum of grain boundary and bulk resistance, has been extracted. In pure YAlO3, lattice defects may arise from intrinsic defects. These thermodynamic defects are distributed randomly, and the concentration is not sufficient to acquire high electrical conductivity. It is known that aliovalent cations play an important role in altering the structure and electrical properties of oxide. In this study, CaO and SrO have been the sources of aliovalent cations for YAlO3 system. Figure 4 shows the plot comparing the total conductivity of the various compositions of the Sr-doped YAlO3 system. There is an increase in conductivity up to x = 0.04 composition. The conductivity of the system is about 3.3 × 10⁻⁴ S/cm for x = 0.04 composition at 800 °C. The defect reaction for Sr2+ doping is written as:

Plot of total conductivity as a function of inverse of temperature for Y1−xSrxAlO3−δ system (x = 0.02–0.1).
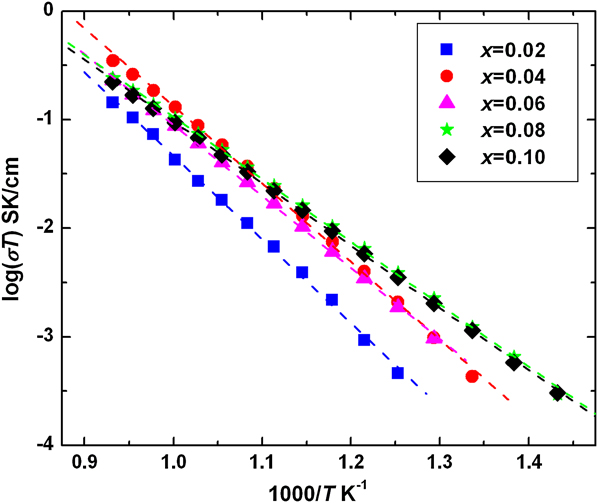
The increase in conductivity on doping may be attributed to the creation of oxygen vacancies when Sr2+ ion substitutionally replaces Y3+ ions. The increase in conductivity may also be attributed to an extent to the increase in cell volume. Beyond x = 0.04 composition, the conductivity gradually falls, which may be due to multiple reasons. The fall may be due to the formation of secondary phases, which hinder the movement of oxygen ions. The decrease in conductivity has been observed to occur at higher dopant concentrations. The higher level of aliovalent cation should theoretically create more oxide ion vacancies. Since a fall in conductivity is noticed, this behavior may be attributed to the association of defects or the vacancy clustering phenomena. The oxide ion vacancies, which are effective positive charges, are attracted toward the dopant sites or the vacancies, which carry an effective negative charge. The formation of oxygen ion vacancy clusters decreases the number of mobile oxygen ions and so a decrease in conductivity. In addition to the contribution from the defect clusters and secondary phases, the decrement in the relative density also plays a critical role toward the decrease in electrical conductivity.
D. Comparison of conductivities of A-site-doped YAlO3
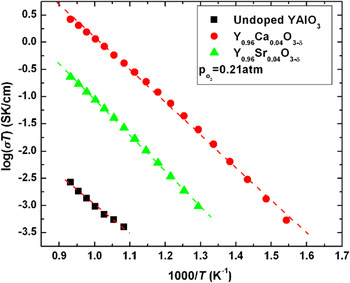
Figure 5 shows the Arrhenius plot of the x = 0.06 composition of Ca- and Sr-doped YAlO3 as compared with the undoped YAlO3 data. The undoped and Ca-doped data have been obtained from our previous work to draw a comparison.Reference Hariharan and Gopalan24 For the same dopant concentration in both the systems, Ca-doped YAlO3 system exhibits higher conductivity values and lower activation energies as compared to Sr-doped YAlO3 system. However, when compared with pure YAlO3, both Ca- and Sr-doped YAlO3 systems reveal a two- to three-order improvement in conductivity. This increase in conductivity is due to the creation of oxygen ion vacancies. The variation in conductivity among the doped YAlO3 systems is clearly a function of the ionic radius of the aliovalent cations.Reference Tsuji, Ohashi and Yamamura19 Due to the larger size of the Sr2+ ion as compared to the Ca2+ ion, its solubility limit in YAlO3 is lesser. The formation of secondary phases in Sr-doped YAlO3 therefore occurs at lower doping levels. This may be the reason for the fall in conductivity of the Sr-doped system as compared to the Ca-doped system.
Comparison of total conductivities of undoped and A-site-doped YAlO3 for x = 0.1 composition.

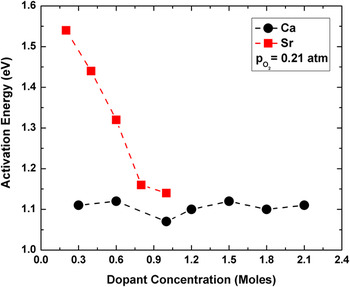
The activation energy calculated from the Arrhenius equation for the Ca-doped (earlier workReference Hariharan and Gopalan24) and Sr-doped YAlO3 systems is shown as a function of dopant concentration in Fig. 6. An increase in activation energy has been noticed with a corresponding increase in the r dopant/r host ratio, where r stands for the ionic radius. A high conductivity and low activation energy has been reported for Ca-doped YAlO3 system, which has a smaller dopant–host size mismatch as compared to the Sr-doped YAlO3 system. The lower conductivity values of Y1−xSrxAlO3−δ system as compared to that of Ca-doped YAlO3 system may also be attributed to greater values of activation energy for conduction.
Activation energy as a function of A-site dopant concentration.

E. Electron microscopy studies
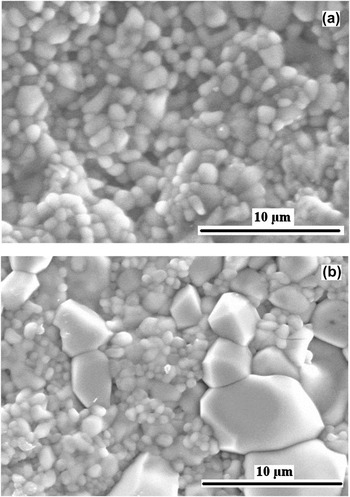
The effect of microstructure on electrical conductivity has been evaluated by performing SEM studies on x = 0.1 compositions of Ca- and Sr-doped YAlO3 systems as recorded in Fig. 7. Figure 7(a) recorded in the secondary electron mode shows a uniform grain size distribution. The average grain size of the host phase in this composition is about 1–3 μm. Figure 7(b) reveals two regions clearly differentiable based on their grain sizes. One region with grains of size about 1–3 μm and the other with a relatively larger grain size of about 3–8 μm are vividly observed. The smaller grain-sized region corresponds to the native YAlO3 phase. The larger grain-sized region may be the secondary phase corresponding to Sr3Al2O6 or SrAl2O4. The appearance of the minor nonconducting phase of large grain size may be cited as a reason for the fall in conductivity.
SEM micrograph in secondary electron mode of (a) Y0.9Ca0.1AlO3−δ and (b) Y0.9Sr0.1AlO3−δ compositions.

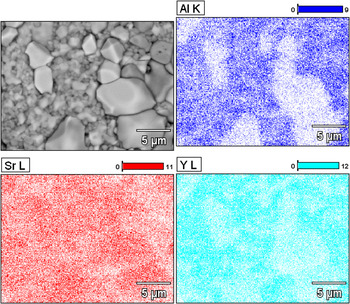
A qualitative evaluation on the phase composition of the Y0.9Sr0.1AlO3−δ sample has been performed using EDS mapping technique and the composition maps are revealed in Fig. 8. The analysis reveals regions rich in Sr2+ content and depleted in Al3+ or Y3+ content. These regions correspond to the larger grain-sized phases in Fig. 7(b). It is evident from the image that the secondary phases have emerged due to the excess Sr2+ levels in the sample. The other phase, which corresponds to the matrix phase, reveals a uniform distribution of all the constituent elements.
Qualitative compositional analysis of Y0.9Sr0.1AlO3−δ using EDS mapping.

IV. CONCLUSIONS
An evaluation of the effect on electrical conductivity of different A-site cation substitution on YAlO3 has been performed. Since the solid-state route of synthesis failed to yield the required phase and good density, Sr-doped YAlO3 samples have been prepared by the citrate gel route. The dissolution limit of Sr2+ on Y3+ site has been observed to be x < 0.06. The electrical conductivity measurements reveal a two-order improvement in conductivity of YAlO3 upon doping with Sr2+. A maximum total conductivity of about 3.3 × 10⁻⁴ S/cm at 800 °C has been recorded for the x = 0.04 composition. A gradual decrease in conductivity beyond this composition may be attributed to the evolution of secondary phases. A comparison between the electrical conductivity data of Ca- and Sr-substituted YAlO3 system has been drawn. The former system yields better dopant solubility and total conductivity than the latter. The proximity of the ionic radius of Ca2+ to Y3+ than Sr2+ may be attributed for the observation.