





1 Introduction
Fusion ignition has achieved significant milestones in recent years[ Reference Danson and Gizzi 1 , Reference Clery 2 ]. Most notably, the National Ignition Facility (NIF) has achieved ignition multiple times since 2022, with a maximum target gain exceeding 4[ Reference Danson and Gizzi 1 ]. Reaching higher gain for practical fusion energy requires persistent efforts to suppress fuel mixing and maintain a clean hot spot, in both direct-drive[ Reference Lindl 3 ] and indirect-drive[ Reference Betti and Hurricane 4 ] schemes. In inertial confinement fusion (ICF) implosions, high-Z material mixing into the deuterium–tritium fuel strongly enhances bremsstrahlung radiative cooling during stagnation, elevates the Lawson ignition criterion and increases laser drive energy requirements. Fuel mixing is therefore a primary contributor to performance degradation in fusion experiments[ Reference Zylstra, Kritcher, Hurricane, Callahan, Ralph, Casey, Pak, Landen, Bachmann, Baker, Hopkins, Bhandarkar, Biener, Bionta, Birge, Braun, Briggs, Celliers, Chen, Choate, Clark, Divol, Doppner, Fittinghoff, Edwards, Johnson, Gharibyan, Haan, Hahn, Hartouni, Hinkel, Ho, Hohenberger, Holder, Huang, Izumi, Jeet, Jones, Kerr, Khan, Geppert-Kleinrath, Geppert-Kleinrath, Kong, Lamb, Le Pape, Lemos, Lindl, MacGowan, Mackinnon, MacPhee, Marley, Meaney, Millot, Moore, Newman, Di Nicola, Nikroo, Nora, Patel, Rice, Rubery, Sater, Schlossberg, Sepke, Sequoia, Shin, Stadermann, Stoupin, Strozzi, Thomas, Tommasini, Trosseille, Tubman, Volegov, Weber, Wild, Woods, Yang and Young 5 – Reference Liu, Li, Yan, Dong, Fang, Chen, Li, Wu, Wang, Wang, Huang and Zhang 8 ]. In cone-in-shell fast ignition, hydrodynamic coupling between high-Z gold cones and the imploding CH fuel shell can trigger severe material mixing at the fuel–cone interface, which has been identified as a key mechanism limiting ignition performance[ Reference Tanaka, Kodama, Mima, Kitagawa, Fujita, Miyanaga, Nagai, Norimatsu, Sato, Sentoku, Shigemori, Sunahara, Shozaki, Tanpo, Tohyama, Yabuuchi, Zheng, Yamanaka, Norreys, Evanse, Zepf, Krushelnic, Dangor, Stephens, Hatchett, Tabak and Turner 9 ]. Indirect-drive fast-ignition experiments on the OMEGA laser facility revealed substantial mixing of gold-cone material with the compressed fuel core, leading to increased ignition-energy requirements[ Reference Stephens, Hatchett, Turner, Tanaka and Kodama 10 ]. In direct-drive cone-in-shell schemes, by contrast, simulations and experiments confirm negligible gold–fuel mixing[ Reference Stoeckl, Boehly, Delettrez, Hatchett, Frenje, Glebov, Li, Miller, Petrasso, Séguin, Smalyuk, Stephens, Theobald, Yaakobi and Sangster 11 , Reference Stoeckl, Boehly, Delettrez, Hatchett, Frenje, Glebov, Li, Miller, Petrasso, Séguin, Smalyuk, Stephens, Theobald, Yaakobi and Sangster 12 ].
Among existing ignition approaches, the double-cone ignition (DCI) scheme[ Reference Zhang, Wang, Yang, Wu, Ma, Jiao, Zhang, Wu, Yuan, Li and Zhu 13 ] presents a promising alternative that imposes significantly lower laser energy requirements while enabling higher energy gain. In DCI, two opposing gold cones quasi-isentropically compress a CH fuel shell via high-power laser pulses[ Reference Zhao, Yuan, Dong, Glize, Zhang, Zheng, Xing, Gu, Zhang, Dai, Fang, Zhang, Yan, Wu and Zhang 14 – Reference Li, Yuan, Gao, Liu, Wu, Yuan, Zhang, Zhang, Li and Zheng 16 ]. The fuel is accelerated within the cones and ejected at high velocity from their tips, initiating a head-on collision that dramatically increases fuel density[ Reference Zhang, Yuan, Zhang, Liu, Fang, Zhang, Liu, Zhao, Dong, Liu, Dai, Gu, Li, Zheng, Zhong and Zhang 17 , Reference Liu, Wu, Zhang, Yuan, Zhang, Xu, Xue, Tian, Zhong and Zhang 18 ]. This collision converts kinetic energy into internal energy, raising the fuel temperature. Thermonuclear ignition is then triggered by directing fast electrons, guided by a strong magnetic field, into the compressed fuel to deposit the final heating energy[ Reference Dai, Gu, Fang, Zhang, Zhang, Dong, Zhang, Yuan, Li and Zhang 19 ]. The hydrodynamic evolution at the gold cone–CH fuel interface governs the plasma state after collision and the efficiency of fast-electron energy deposition, making it indispensable for understanding and optimizing DCI performance.
However, the interfacial hydrodynamic stability and associated material mixing in DCI have not been fully elucidated. The Kelvin–Helmholtz instability (KHI), driven by strong tangential velocity shear at the fuel–cone boundary, can entrain high-Z gold into the fuel and cause severe radiative cooling that degrades ignition conditions. Besides the KHI, common hydrodynamic instabilities at the interfaces during ICF implosion include the acceleration-driven Rayleigh–Taylor instability (RTI), flow perturbations induced by target surface defects and laser/X-ray ablation effects. In conventional spherically symmetric implosion configurations, the normal acceleration generated by radial compression significantly amplifies the RTI on the target surface. This instability continuously exacerbates interfacial mixing between the ablator and fuel layers, acting as the primary cause of fuel contamination. In addition, plasma jets originating from target surface defects and laser/X-ray ablation also lead to fuel mixing. Benefiting from structural optimization, the DCI scheme adopted in this study effectively suppresses the dominance of the RTI. On one hand, the reduced implosion velocity and thickened fuel shell greatly restrain the growth of the RTI on the outer surface of the shell. On the other hand, no fill gas exists inside the fuel shell, which fundamentally inhibits the evolution of the RTI on the inner surface of deuterium–tritium fuel. Meanwhile, the DCI configuration exhibits distinctive hydrodynamic evolution features, where tangential motion dominates the interfacial dynamics. The CH ablator flows at high speed along the inner wall of the gold cone, forming a pronounced tangential velocity gradient at the interface between the gold cone and fuel. This provides the essential dynamic conditions for the initiation and growth of the KHI. As for initial perturbations caused by target surface roughness, inherent defects on the gold-cone inner wall only produce weak perturbation amplitudes. Without strong shear flow, such tiny perturbations decay rapidly and fail to trigger large-scale interfacial distortion and material mixing, thus contributing negligibly to overall interfacial instability. Consequently, KHI is the principal physical mechanism responsible for cross-interface mixing between the gold cone and fuel plasmas. To date, no experimental study has directly observed, quantified and mitigated KHI-driven gold–fuel mixing in DCI implosions.
In this work, we report a combined experimental and three-dimensional (3D) radiation-hydrodynamic investigation of KHI and gold mixing in DCI, conducted at the ShenGuang-II Upgrade (SG-II UP) laser facility using picosecond-resolved Cu Kα X-ray radiography. We show that X-ray pre-ablation of the gold-cone inner wall generates a slow gold pre-plasma, and that the velocity shear between this plasma and the high-speed CH fuel flow triggers strong KHI, forming characteristic spike structures and driving severe gold–fuel mixing. We propose and experimentally validate a CH inner-wall coating for the gold cone. The coating suppresses gold pre-plasma formation, reduces the KHI growth rate and substantially lowers the gold mass fraction in the colliding plasma. Cu Kα transmittance measurements show excellent agreement with 3D simulations, confirming the effectiveness of the coating strategy. These findings provide a practical method to improve DCI implosion quality and offer new insights into KHI dynamics in high-energy-density interfacial flows.
2 Experimental setup and results
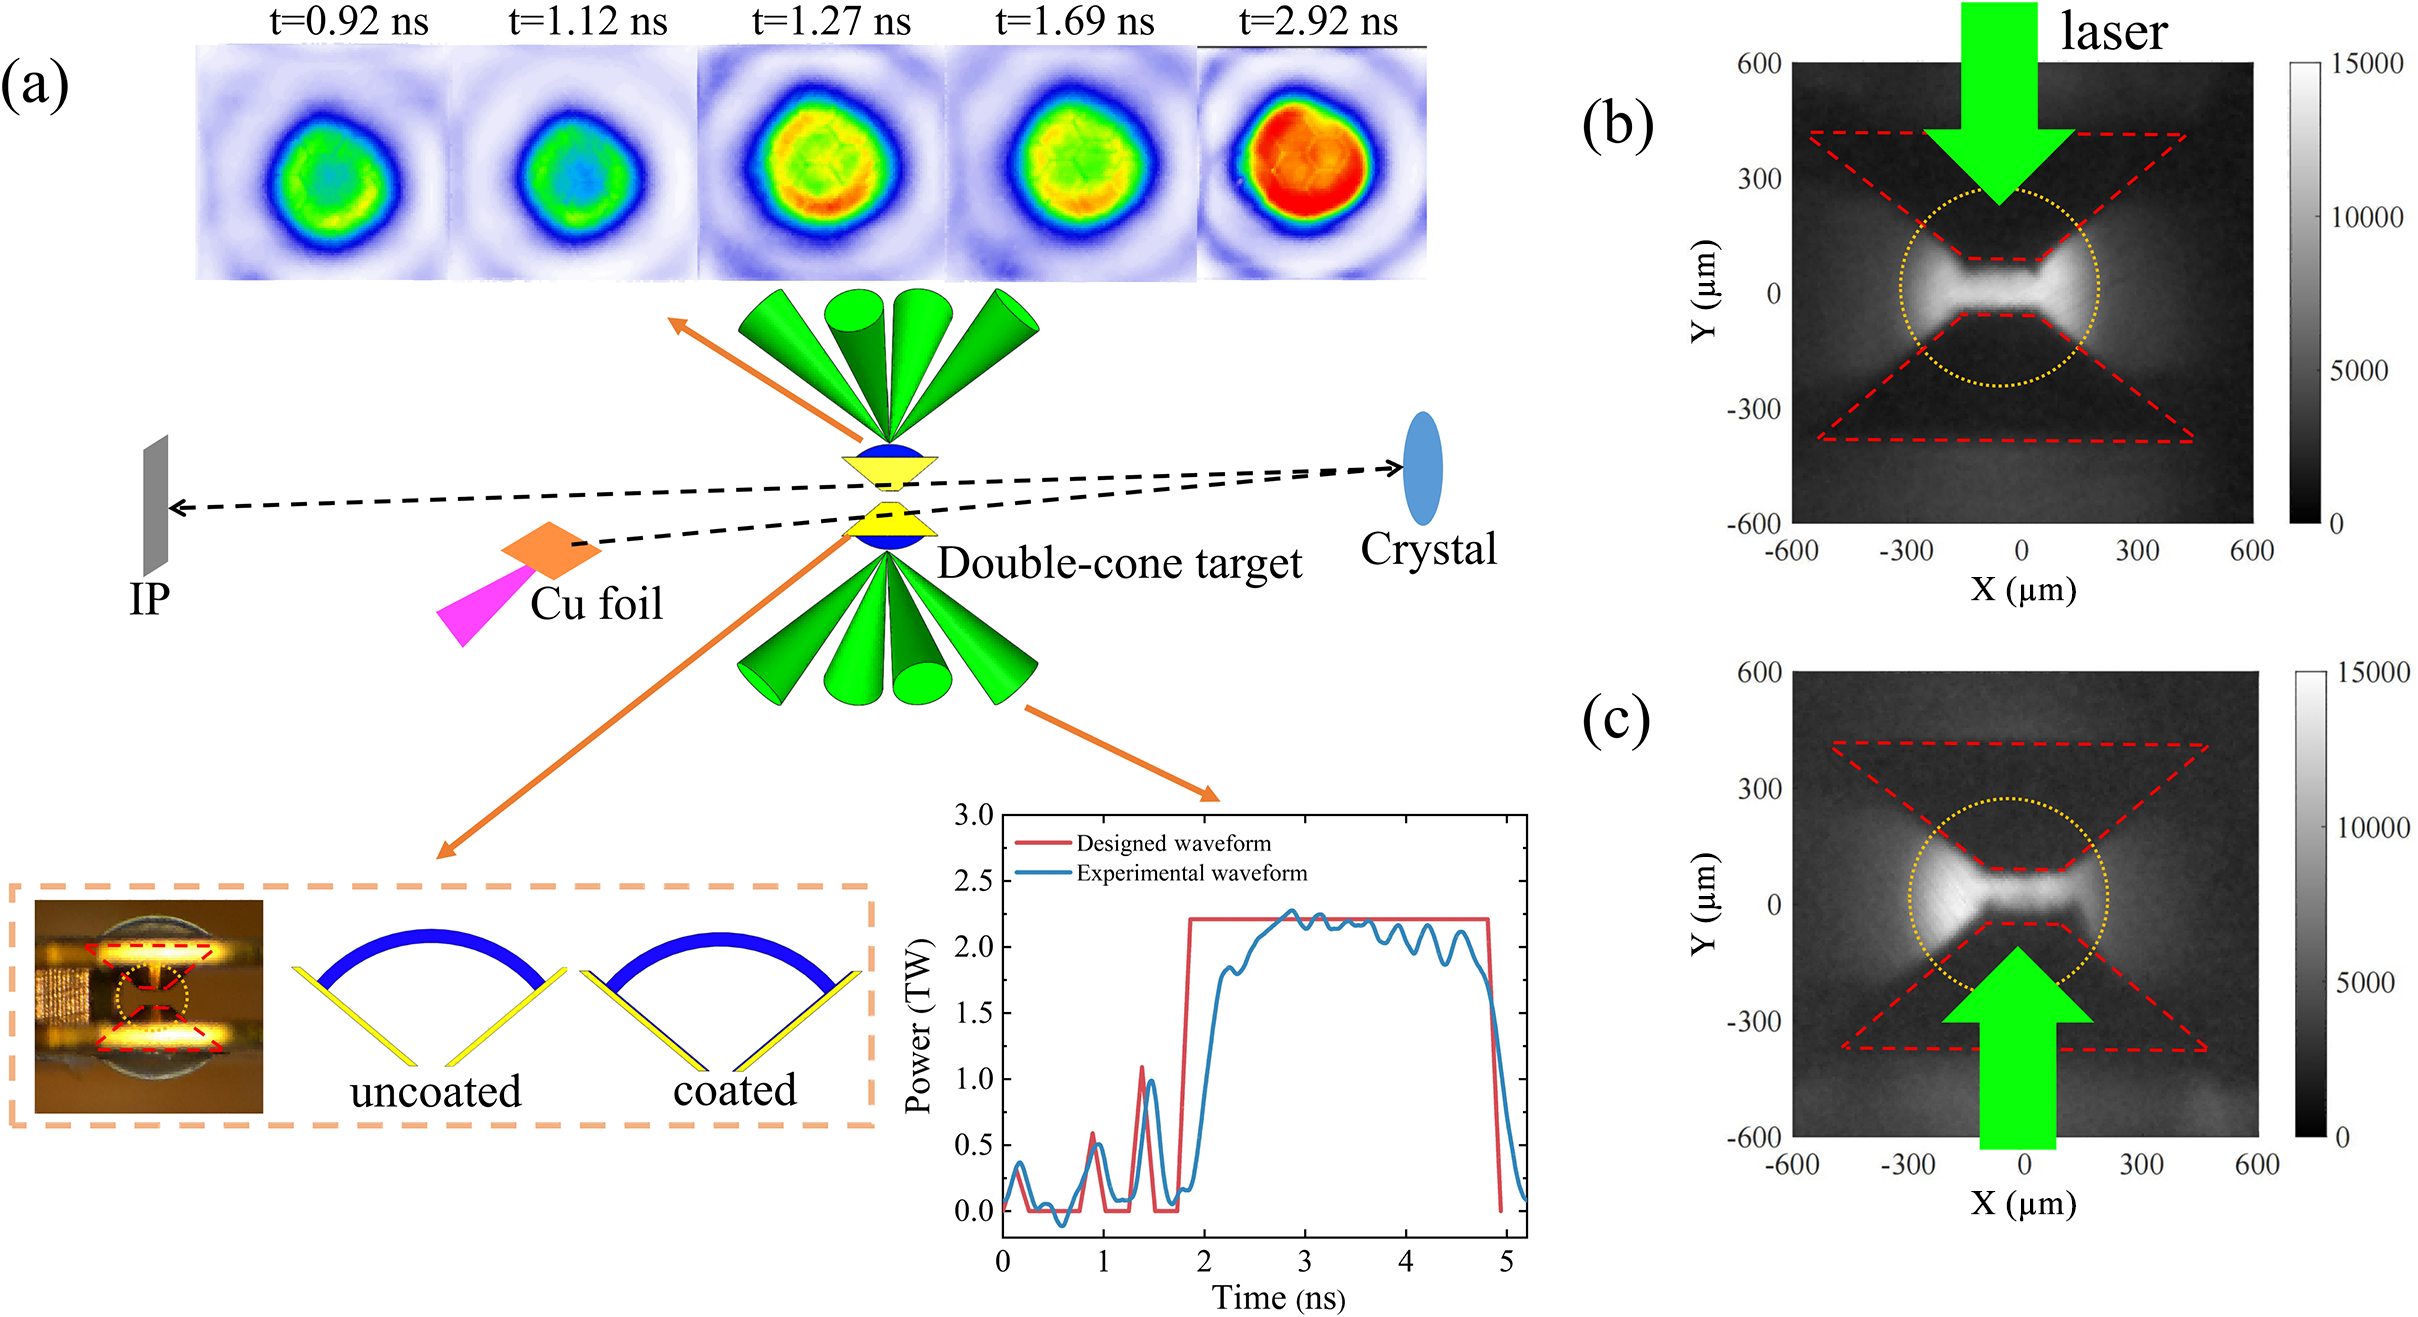
The experiments were performed at the SG-II UP laser facility[ Reference Zhu, Zhu, Li, Zhu, Ma, Lu, Fan, Liu, Zhou, Xu, Zhang, Xie, Yang, Wang, Ouyang, Wang, Li, Yang, Fan, Sun, Liu, Liu, Zhang, Tao, Sun, Zhu, Wang, Jiao, Ren, Liu, Jiao, Huang and Lin 20 ]; the configuration is schematically depicted in Figure 1(a). Two gold cones with 20-μm-thick walls, 100° opening angles and a 100-μm separation between them were used to confine the target shells. The shells consisted of parylene C16H16 (CH), with an inner radius of 500 μm, a shell thickness of 50 μm and an initial density of 1.1 g/cm3. The compression drive utilized eight Nd:glass laser beams operating at the third harmonic (λ = 351 nm). These beams were distributed across four upper and four lower quadrants, delivering a total energy of 14 kJ. The duration of each beam was 4.94 ns, preceded by three pickets to adjust the entropy of the shell[ Reference Fang, Gu, Zhang, Dong, Zhang, Dai, Zhao, Zhang, Yuan, Li and Zhang 21 ]. Laser beam homogenization was achieved with 700-μm-diameter continuous phase plates (CPPs), ensuring uniform irradiation of the target shells of surfaces. In the experiment, a multi-pinhole coupled framing camera was employed to detect the overlapping focal spots of the four upper laser beams, and the temporal evolution of laser intensity distribution was acquired, as shown in Figure 1(a). The X-ray images generated by laser irradiation on the CH shell indicate that the four combined laser beams possess excellent overall irradiation uniformity, which can effectively suppress ablation perturbations induced by laser inhomogeneity. Plasma dynamics at the cone tip were imaged using a monochromatic backlight diagnostic system[ Reference Theobald, Solodov, Stoeckl, Anderson, Beg, Epstein, Fiksel, Giraldez, Glebov, Habara, Ivancic, Jarrott, Marshall, McKiernan, McLean, Mileham, Nilson, Patel, Perez, Sangster, Santos, Sawada, Shvydky, Stephens and Wei 22 , Reference Stoeckl, Epstein, Betti, Bittle, Delettrez, Forrest, Glebov, Goncharov, Harding, Igumenshchev, Jacobs-Perkins, Janezic, Kelly, Kosc, McCrory, Michel, Mileham, McKenty, Marshall, Morse, Regan, Radha, Rice, Sangster, Shoup, Shmayda, Sorce, Theobald, Ulreich, Wittman, Meyerhofer, Frenje, Johnson and Petrasso 23 ]. The X-ray probe was generated by irradiating a copper foil with a 500 J, 10 ps petawatt-class laser, generating a Cu Kα X-ray source with a duration of approximately 50 ps. A quartz (2131) crystal configured in secondary diffraction geometry (Bragg angle: 88.13°) provided a magnification of 8.02× with approximately 20 μm spatial resolution[ Reference Zhang, Zhang, Yuan, Zhang, Xu, Dai, Dong, Gu, Liu, Zhao, Li, Li, Zhu and Zhang 24 ].
(a) Schematic of the experimental setup of DCI. (b), (c) Radiographs of the cone tip at 7.0 ns post-irradiation with upper four-laser-beam and lower four-laser-beam driving conditions, respectively, on the double-cone target.

Figure 1. Long description
Panel a contains a central schematic of a double-cone target being irradiated by two sets of four green laser beams from the top and bottom. Above this, a sequence of five circular heat maps shows plasma evolution from t = 0.92 n s to t = 2.92 n s, transitioning from blue-green to a solid red core. To the left, a dashed line connects an I P detector to a Cu foil and the target. To the right, a dashed line connects the target to a blue Crystal. Below the schematic, a line graph plots Power in T W against Time in n s from 0 to 5. A red line represents the Designed Waveform and a blue line represents the Experimental waveform, showing a plateau at 2.2 T W between 2 and 5 n s. A small inset shows a photo and diagrams of uncoated versus coated cone tips. Panels b and c are grayscale radiographs with X and Y axes ranging from minus 600 to 600 micrometers. Panel b shows a large green arrow pointing down at the top cone tip. Panel c shows a large green arrow pointing up at the bottom cone tip. Both radiographs feature red dashed outlines of the cones and a yellow dotted circle around the central interaction region.
To examine the structure of the ejected plasma, the double-cone target was initially irradiated from a single side. Figures 1(b) and 1(c) present the imaging results of the cone tip at 7.0 ns under upper four-laser-beam and lower four-laser-beam driving conditions, respectively. The central bright feature (outlined by yellow dashed lines) corresponds to the conical opening region imaged by Cu Kα backlight emission, generated by a picosecond laser-driven Cu foil. Red dashed contours indicate the boundaries of the gold cones in the double-cone target. The cone tip on the non-laser-driven side remains smooth and intact, with no observable expansion. In contrast, the laser-driven conical opening exhibits pronounced expansion, with spike-like structures emerging on the cone-tip edge. The inter-spike separation (~160 μm) closely matches the spacing along the outer wall of the cone tip. Under the influence of the KHI[ Reference Hurricane, Smalyuk, Raman, Schilling, Hansen, Langstaff, Martinez, Park, Remington, Robey, Greenough, Wallace, Di Stefano, Drake, Marion, Krauland and Kuranz 25 , Reference Harding, Hansen, Hurricane, Drake, Robey, Kuranz, Remington, Bono, Grosskopf and Gillespie 26 ], the gold plasma on the inner wall of the gold cone is rolled and transported to the cone aperture, where it continuously accumulates. Compared with other regions, the path integral of X-rays passing through the gold plasma on both sides of the cone aperture is longer, leading to more significant X-ray attenuation. This corresponds to the typical spike features observed in the imaging results shown in Figures 1(b) and 1(c).
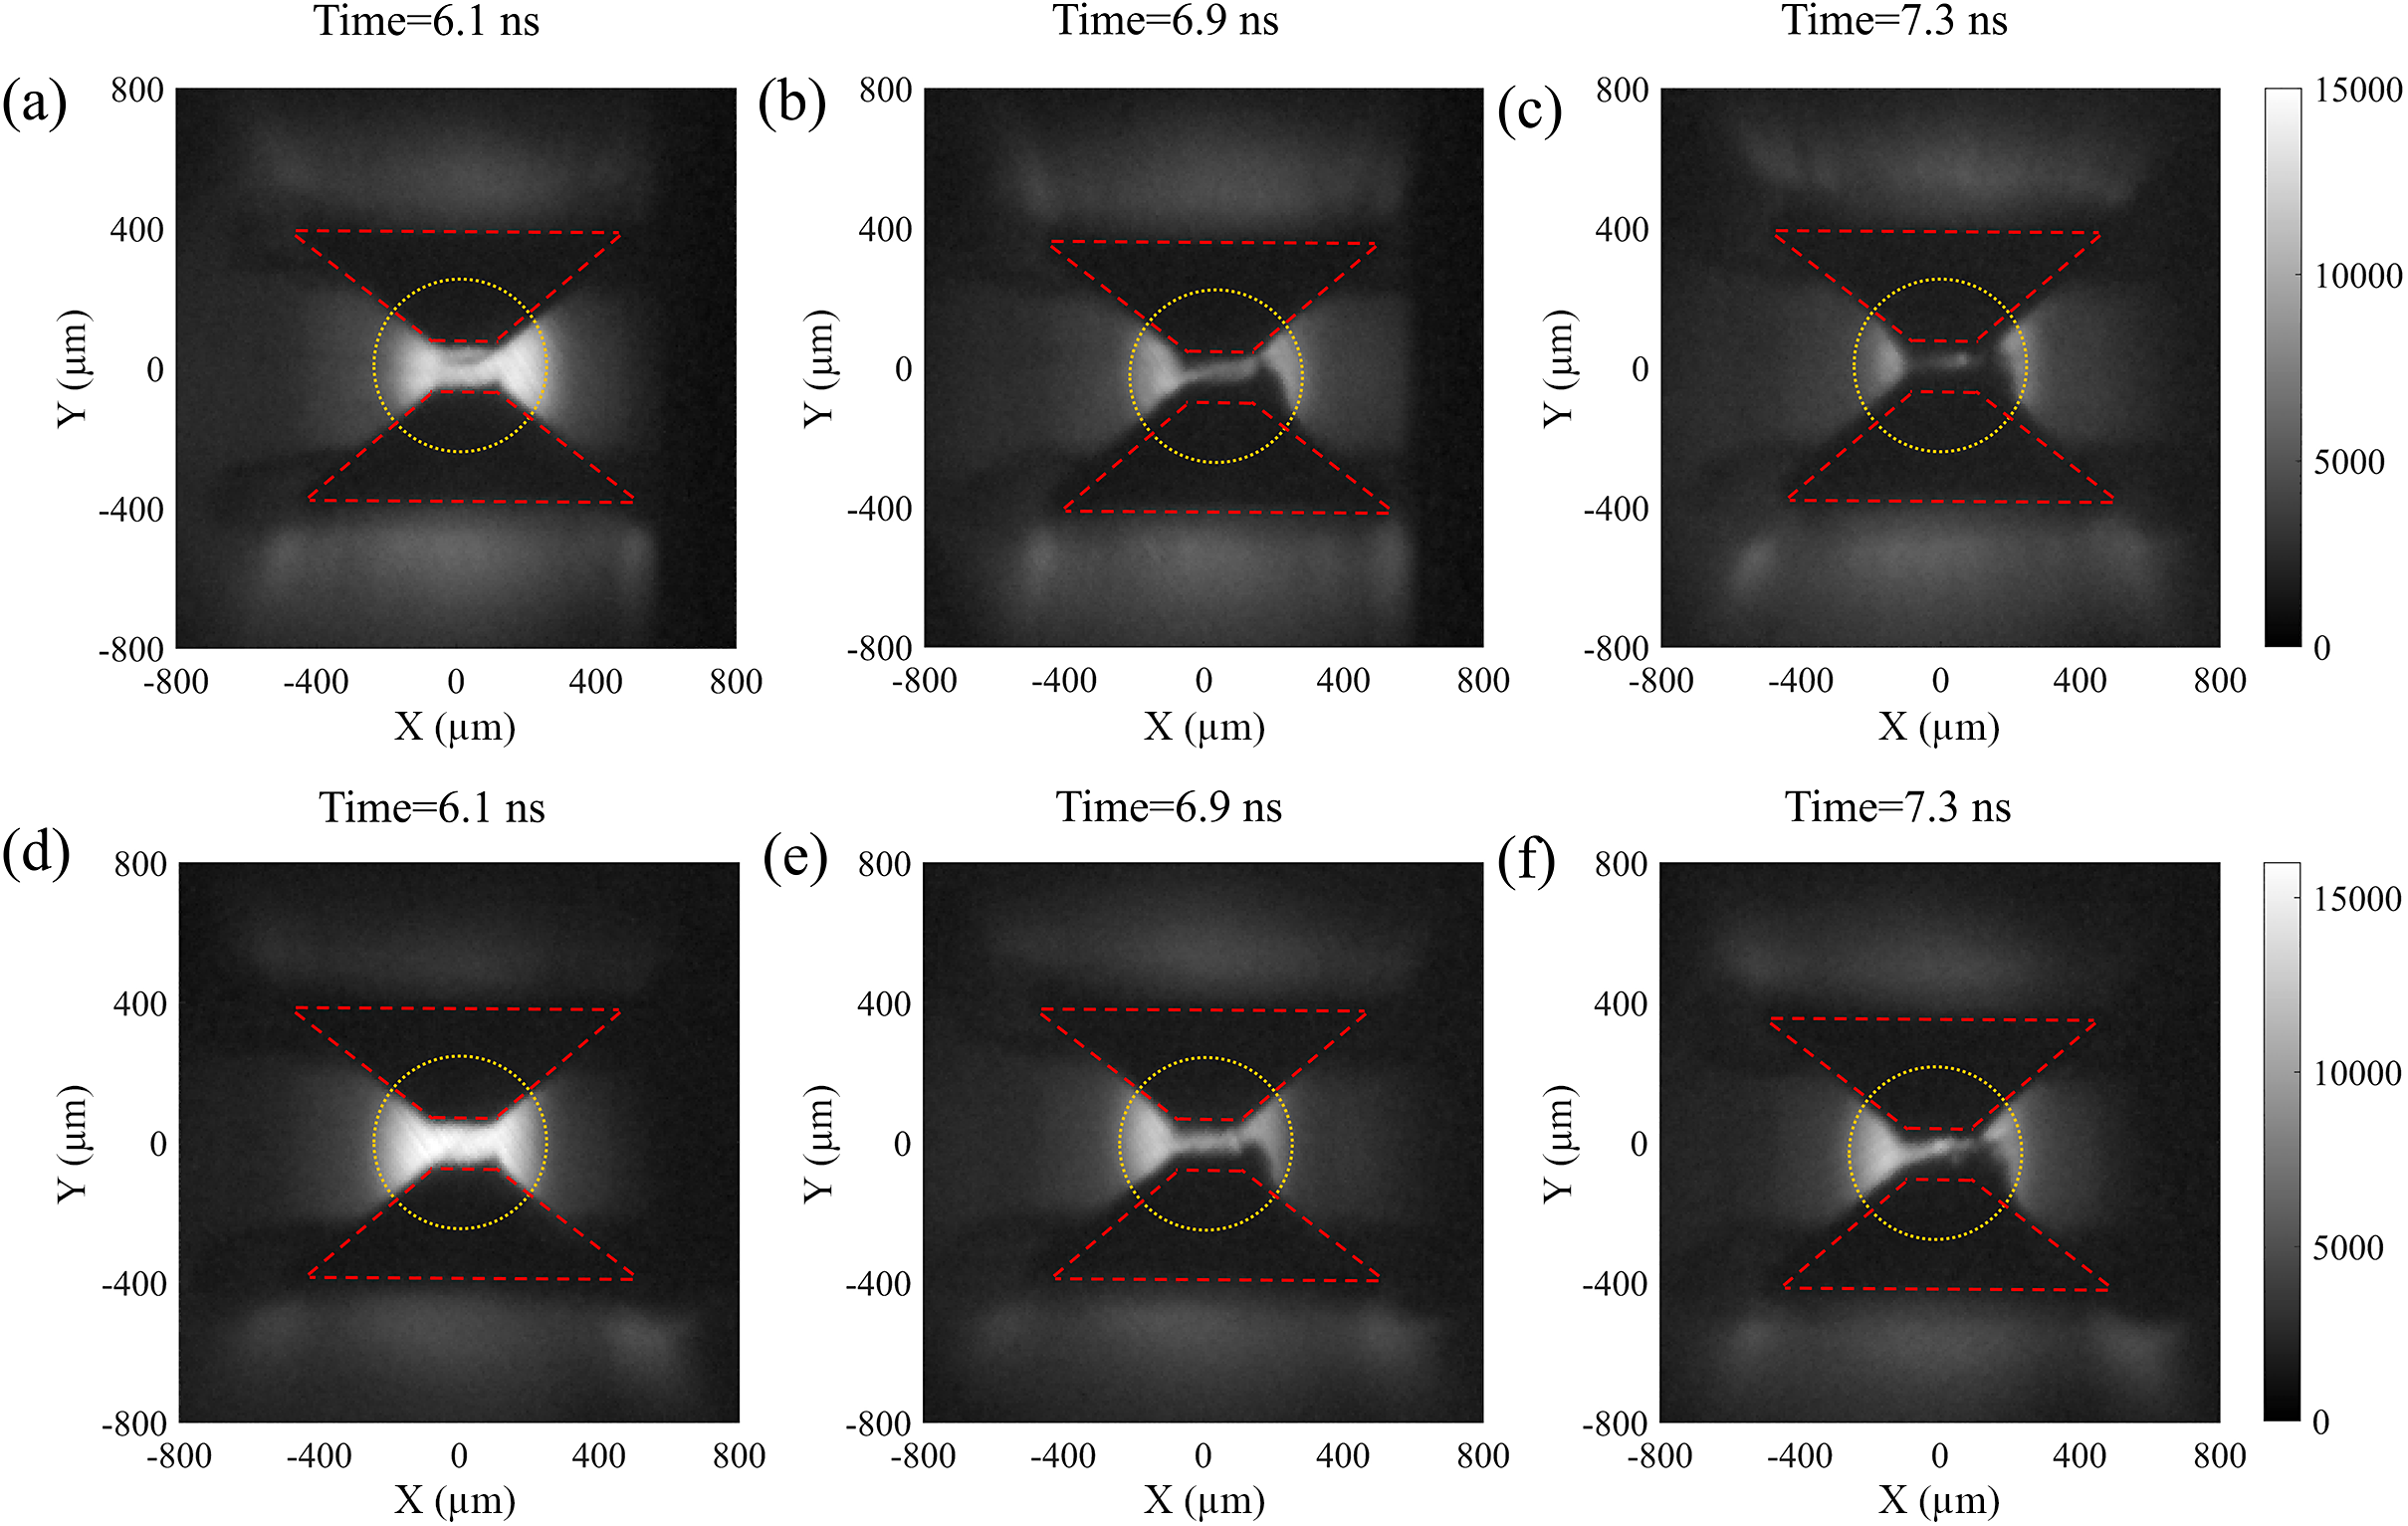
The mixing of gold into the fuel plasma poses a significant risk to ignition, as it introduces substantial radiative cooling through bremsstrahlung losses from the high-Z gold electrons[ Reference Hurricane, Springer, Patel, Callahan, Baker, Casey, Divol, Döppner, Hinkel, Hohenberger, Hopkins, Jarrott, Kritcher, Le Pape, Maclaren, Masse, Pak, Ralph, Thomas, Volegov and Zylstra 27 ]. To ensure the colliding plasma remains free of cone material, we apply a CH coating to the inner wall of the gold cone, as illustrated in Figure 1(a). Although KHI still develops at the coating–fuel interface owing to the tangential velocity difference, the resulting mixing involves only CH-on-CH – materials of identical atomic composition. Consequently, X-ray backlight transmittance through the ejected plasma is expected to increase. This is confirmed by the radiographic images in Figure 2. Figures 2(a)–2(c) correspond to an uncoated target and Figures 2(d)–2(f) to a 2-μm-coated target, both irradiated from both sides. In both cases the cone-tip separation decreases over time and transmittance diminishes as plasma is ejected; however, the coating significantly improves X-ray transmission through the cone-tip region throughout the implosion. As the plasma evolves, the expansion velocity at the right-hand edge increases significantly in the late stage (Figures 2(b), 2(c), 2(e) and 2(f)). This asymmetry primarily originates from nonuniform laser energy distribution: the target’s right-hand side receives higher laser energy. Enhanced local ablation under higher laser loading eventually causes obvious discrepancies in plasma evolution on both sides.
Radiographic images of double-cone target implosion: (a)–(c) radiographs at successive times for an uncoated target; (d)–(f) corresponding radiographs for a 2-μm-coated target.

Figure 2. Long description
A six-panel set of radiographs arranged in two rows. The top row, labeled a, b, and c, shows an uncoated target at 6.1 n s, 6.9 n s, and 7.3 n s. The bottom row, labeled d, e, and f, shows a 2-mu m-coated target at the same time intervals.
Each panel features a central bright region representing the plasma implosion, bounded by a yellow dotted circle at the center. Red dashed lines outline the double-cone geometry, forming an hourglass shape.
* Panel a (6.1 n s, uncoated): Shows a wide, bright plasma bridge between the cones.
* Panel b (6.9 n s, uncoated): The plasma bridge narrows and dims.
* Panel c (7.3 n s, uncoated): The central plasma is significantly fainter and more compressed.
* Panel d (6.1 n s, coated): Shows a bright, dense plasma bridge similar to panel a but with more defined edges.
* Panel e (6.9 n s, coated): The plasma remains brighter and more structured than the uncoated counterpart in panel b.
* Panel f (7.3 n s, coated): The plasma core remains visible and more concentrated compared to panel c.
All panels use a coordinate system with X (mu m) and Y (mu m) axes ranging from negative 800 to 800. A vertical grayscale intensity bar on the right of each row indicates values from 0 to 15000.
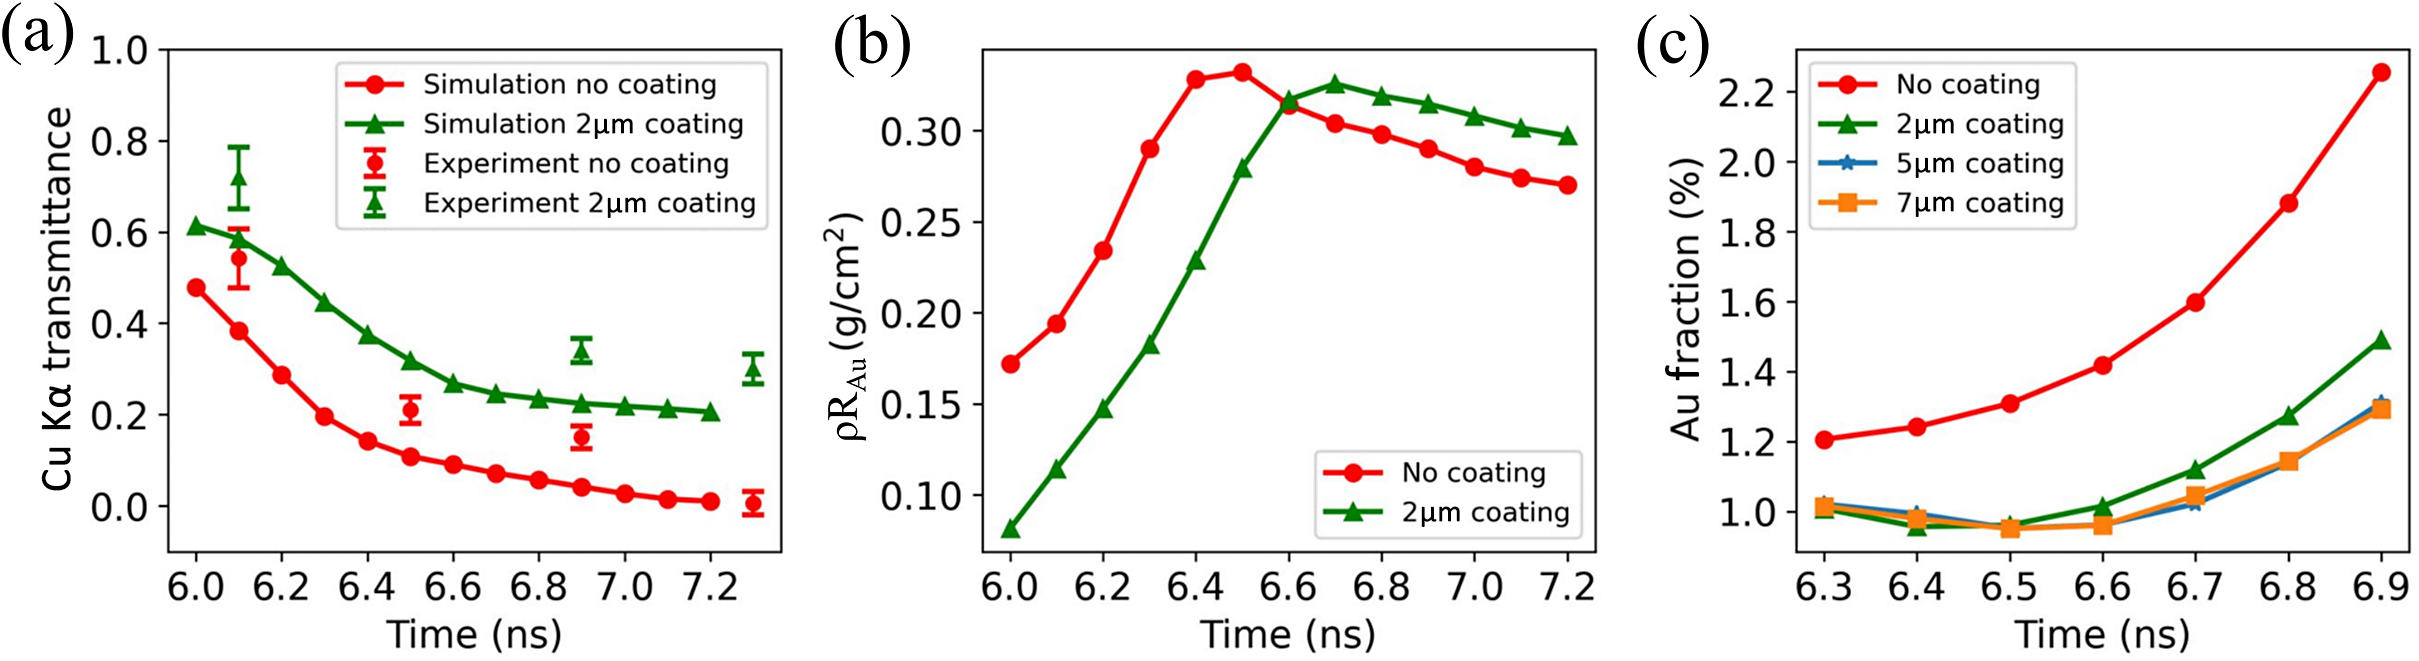
Figure 3(a) quantifies the transmittance comparison. The transmittance is defined as the ratio of measured Cu Kα intensity to the initial intensity, with the latter obtained by fitting the intensity distribution at the collision center. Two trends are evident: transmittance decreases over time as plasma density builds at the cone exit, and the coating consistently enhances transmission. As established by the simulations below, this enhancement arises from gold suppression rather than any change in CH plasma density.
(a) Temporal evolution of Cu Kα transmittance for uncoated and 2-μm-coated targets: symbols are experimental measurements and curves are simulation results. (b) Simulated CH plasma density at the collision center (y = 0) for coated and uncoated cases. (c) Simulated gold mass fraction at the cone tip for various coating thicknesses.

Figure 3. Long description
The figure consists of three panels labeled a, b, and c.
Panel a: A line graph with X-axis Time in n s from 6.0 to 7.2 and Y-axis C u - k alpha transmittance from 0.0 to 1.0. It compares simulation and experimental data for no coating (red circles) and 2 mu m coating (green triangles). The no coating simulation shows a steady decay from 0.5 to 0.0. The 2 mu m coating simulation decays from 0.6 to a plateau around 0.2. Experimental data points with error bars generally follow these trends.
Panel b: A line graph with X-axis Time in n s from 6.0 to 7.2 and Y-axis rho R sub A u in grams per centimeter-squared from 0.10 to 0.30. The no coating curve (red circles) peaks at 0.33 around 6.5 n s before declining. The 2 mu m coating curve (green triangles) peaks later at 0.33 around 6.7 n s.
Panel c: A line graph with X-axis Time in n s from 6.3 to 6.9 and Y-axis A u Fraction percentage from 1.0 to 2.2. It shows four curves: No coating (red circles) rises sharply from 1.2 to 2.3; 2 mu m coating (green triangles) rises from 1.0 to 1.5; 5 mu m coating (blue stars) and 7 mu m coating (orange squares) both remain lower, rising from 1.0 to approximately 1.3.
3 Simulation results and analysis
Three-dimensional hydrodynamic simulations were performed using the FLASH code[ Reference Fryxell, Olson, Ricker and Ebbers 28 – Reference Zhang, Shi, Wang, Xu, Wang, Han, Jiang, Wu and Li 30 ] to investigate the development of the KHI and the resulting gold contamination in the ejected CH plasma. The simulation domain spans 750 μm (x) × 750 μm (z) × 900 μm (y), with y representing the axial direction. Laser boundary conditions were configured to prevent direct laser penetration into the cone interior, ruling out laser ablation as a source of gold pre-plasma. In this simulation, an equivalent lens structure is placed along the axial direction. The lens parameters and laser focal position are strictly configured to match the geometry of the gold cone with a 100° opening angle. Meanwhile, transverse shielding structures are arranged outside the gold cone to prevent direct laser irradiation on its outer surface.
The Cu Kα transmittance is calculated from simulation outputs as follows:

where κ
Au and κ
CH are the mass opacities of Cu Kα photons (8048 eV) in Au and CH plasma, respectively, and ρR
Au, ρR
CH are their areal densities integrated along the diagnostic line of sight. Opacities were computed under steady-state non-local thermal equilibrium conditions using the PROSPACEOS code[
Reference MacFarlane, Golovkin, Woodruff and Quant
31
]. The plasma evolves on a nanosecond timescale via expansion and collision, while the effective imaging window of the picosecond backlight is merely tens of picoseconds. Within this short period, macroscopic plasma parameters hardly change, so the steady-state assumption for atomic kinetics is physically reasonable. The local gold number fraction f
Au in each simulation cell is derived from the cell-averaged atomic mass
$\overline{M}$
 ,

which partitions the total areal density into its Au and CH contributions. The calculated Cu Kα transmittances from simulation are presented as curves in Figure 3(a) and agree well with experiment. Figure 3(b) confirms that the CH plasma density at the collision center is unaffected by the coating. Together, Figures 3(a) and 3(b) establish that the transmittance improvement arises solely from gold suppression. Figure 3(c) quantifies the gold mass fraction at the cone tip for various coating thicknesses. Without coating the fraction substantially exceeds that of the coated cases, while all coating configurations reduce it to a significantly lower level.
The physical significance of this reduction is substantial. The ratio of gold to fuel bremsstrahlung power scales as P brem,Au / P brem,DT ≈ f Au · Z 2 Au, where Z Au ≈ 60 at keV plasma temperatures. Even a gold number fraction of approximately 0.1% therefore increases total bremsstrahlung losses by a factor of approximately 3.6, raising the ignition threshold significantly. The uncoated case, with a gold fraction substantially exceeding this level, would impose severe radiative losses that degrade ignition conditions[ Reference Hurricane, Springer, Patel, Callahan, Baker, Casey, Divol, Döppner, Hinkel, Hohenberger, Hopkins, Jarrott, Kritcher, Le Pape, Maclaren, Masse, Pak, Ralph, Thomas, Volegov and Zylstra 27 ]. The coating reduces the gold fraction to a level where the gold bremsstrahlung contribution is significantly reduced relative to the uncoated case, representing a meaningful step toward achieving the plasma purity required for DCI ignition.
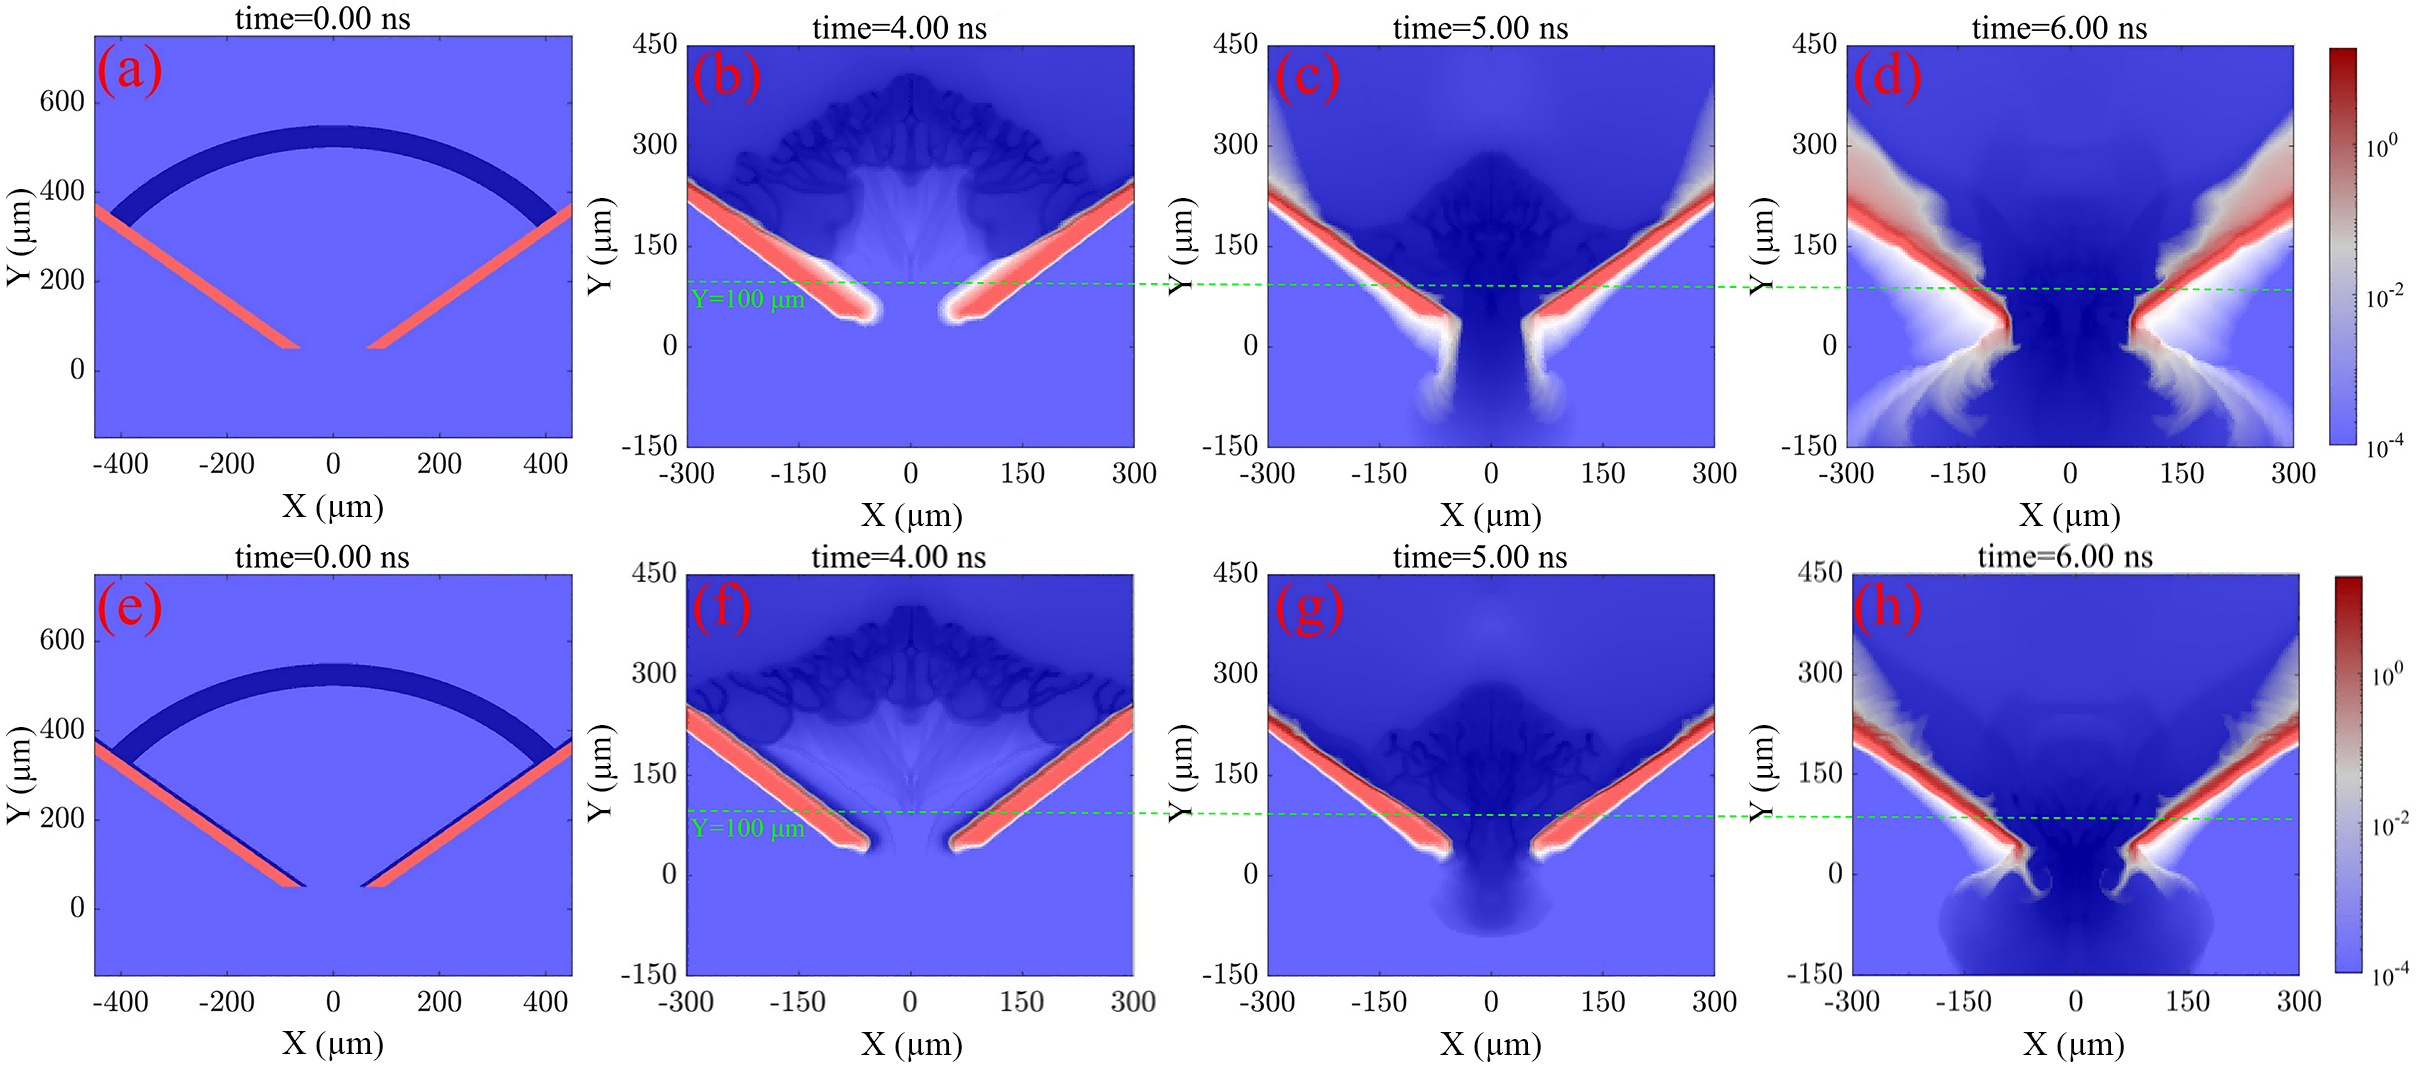
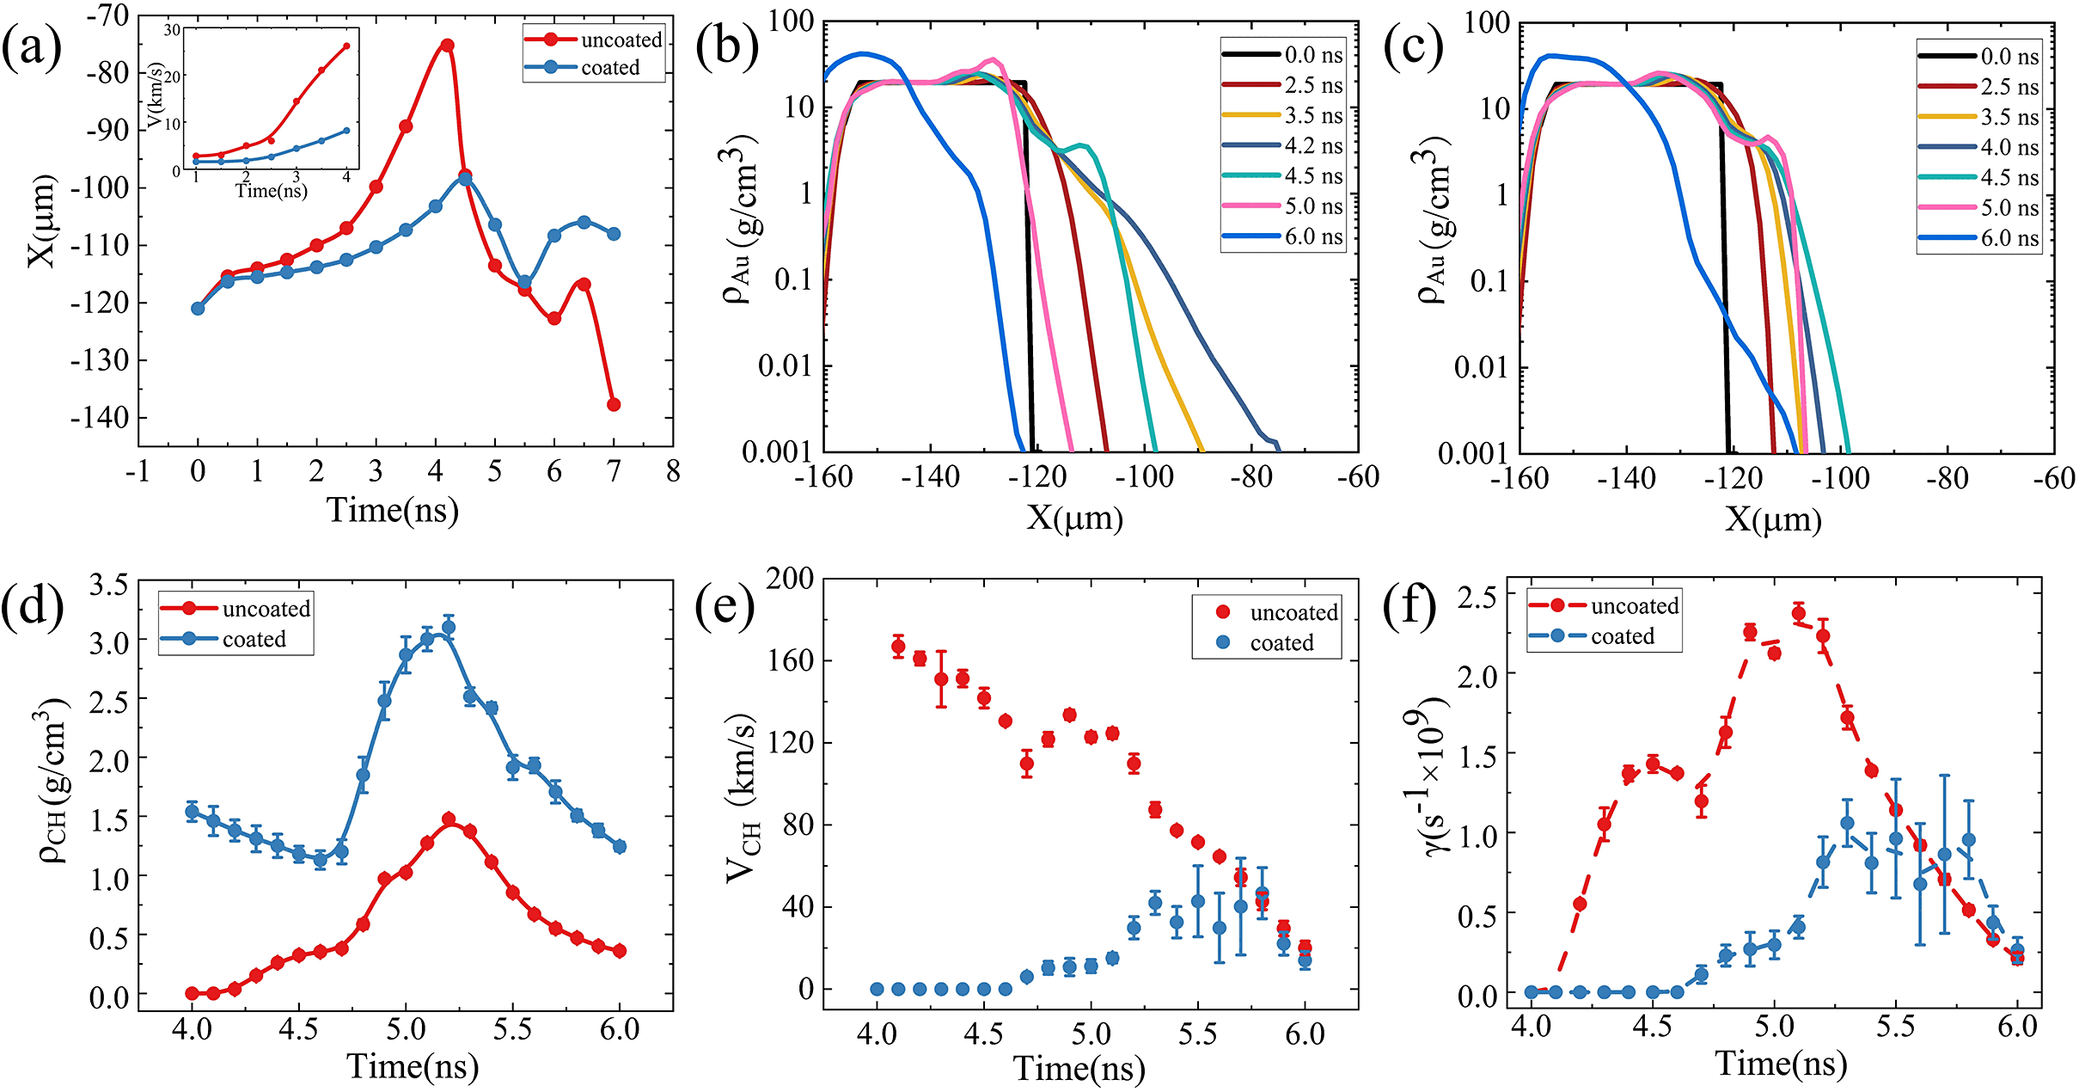
We then investigate how the gold is entrained during the process of the KHI and how coating influences the development of the KHI. The simulated density evolution in Figure 4 reveals two sequential physical processes that together govern the gold contamination. In the first stage (t < 4.0 ns), X-rays generated by laser irradiation of the CH shell ablate the inner gold-cone wall[ Reference Hammer and Rosen 32 – Reference Xu, Yang, Li, Zeng, Chen, Li, Cui, Zhang, Ma and Zhang 34 ], producing a gold pre-plasma that expands perpendicular to the cone surface, as shown in Figure 4(b). In the FLASH simulations presented in this work, calculations are performed within the three-temperature framework, and the X-ray radiation transport is modeled using a six-group radiation diffusion model. The simulation results reveal that the hard X-rays emitted from the gold cone are dominated by gold M-band radiation, with photon energies ranging from 2.4 to 2.8 keV[ Reference Xu, Yang, Li, Zeng, Chen, Li, Cui, Zhang, Ma and Zhang 34 ]. Post-processing diagnostics of the simulation data show that at approximately 5.0 ns, the equivalent radiation temperature on the inner wall of the gold cone at Y = 100 μm is about 68 eV. The temporal evolution of the expansion distance at Y = 100 μm is presented in Figure 5(a). The inset compares the expansion velocity of gold plasma near the inner wall of the gold cone with and without the coating. The results indicate that the coating not only reduces the expansion distance of gold plasma but also evidently suppresses its expansion velocity. The gold layer expands slowly during the picket phase, and then accelerates after t = 2.0 ns as the laser transitions to the main drive. It reaches its maximum extent at t ≈ 4.2 ns when the converging CH plasma arrives at Y = 100 μm. Figure 5(b) shows transverse density profiles of the Au pre-plasma at Y = 100 μm at different instants for the uncoated case. Although the morphological profiles of gold plasma density at 2.5 and 4.5 ns look nearly identical in Figures 5(b) and 5(c), the plasma evolution states are essentially different. At 2.5 ns, the gold plasma of the uncoated target exhibits a larger expansion range. After reaching the maximum expansion distance at 4.2 ns, the uncoated plasma begins to retreat under the compression of CH fuel plasma. In contrast, the coated plasma only reaches its farthest expansion position at 4.5 ns, which accounts for the similar density distributions at the two moments. Notably, 4.0 ns falls within the intersection region of the two expansion curves, resulting in distinct density characteristics at this time. The gold pre-plasma extends across approximately 40 μm (from X = −120 to −80 μm) with an exponential density profile. Its gradient scale length is comparable to the dominant KHI wavelength, a condition favorable for rapid instability growth.
(a)–(d) Simulated evolution of plasma density distribution during the implosion of an uncoated single-cone target. (e)–(h) Corresponding simulated plasma density distribution evolution for a 2-μm-thick coated single-cone target.

Figure 4. Long description
A grid of eight heat maps labeled a through h. The top row (a, b, c, d) represents the uncoated target, and the bottom row (e, f, g, h) represents the 2 mu m coated target.
* Axes: The horizontal X-axis ranges from minus 400 to 400 mu m in the first column and minus 300 to 300 mu m in subsequent columns. The vertical Y-axis ranges from 0 to 600 mu m in the first column and minus 150 to 450 mu m in others.
* Color Scale: A logarithmic color bar on the right indicates density from 10 super minus 4 (blue) to 10 super 0 (dark red).
* Temporal Evolution:
- Panels a and e (time equals 0.00 n s): Show the initial geometry with a curved shell above a V-shaped cone.
- Panels b and f (time equals 4.00 n s): Show the shell material moving downward, forming turbulent plasma structures above the cone.
- Panels c and g (time equals 5.00 n s): The plasma enters the cone opening. A green dashed line marks Y equals 100 mu m.
- Panels d and h (time equals 6.00 n s): High-density plasma (red/white) concentrates at the cone tip and along the inner walls. The coated case (h) shows a slightly different density distribution at the collision center compared to the uncoated case (d).
(a) Simulated evolution of Au pre-plasma expansion distance for uncoated and coated targets at Y = 100 μm. (b) Transverse density profiles of gold plasma at Y = 100 μm at t = 0, 2.5, 3.5, 4.2, 4.5, 5.0 and 6.0 ns for the uncoated target. (c) Corresponding profiles for the 2-μm-coated target. (d)–(f) CH plasma density, tangential velocity and linear KHI growth rate near the Au–CH interface for uncoated and coated targets at Y = 100 μm, respectively.

Figure 5. Long description
A six-panel figure labeled a through f.
Panel a: A line graph of X in micrometers versus Time in nanoseconds. The uncoated red line peaks sharply at negative 75 micrometers around 4.2 nanoseconds, while the coated blue line shows a smoother, lower peak. An inset graph shows Velocity V in kilometers per second increasing over time.
Panel b: A line graph for uncoated targets showing rho Au in grams per cubic centimeter versus X in micrometers. Multiple colored lines represent time intervals from 0.0 to 6.0 nanoseconds, showing the density profile shifting rightward as time increases.
Panel c: A similar line graph to panel b but for coated targets, showing a more constrained density expansion compared to the uncoated version.
Panel d: A scatter plot with error bars showing rho C H in grams per cubic centimeter versus Time in nanoseconds. The coated blue data points are consistently higher than the uncoated red data points, both peaking around 5.2 nanoseconds.
Panel e: A scatter plot of V C H in kilometers per second versus Time in nanoseconds. Uncoated red points start high at 160 kilometers per second and decrease, while coated blue points start at zero and rise to meet the red points at 6.0 nanoseconds.
Panel f: A line graph of gamma in units of 10 super 9 per second versus Time in nanoseconds. The uncoated red dashed line shows a much higher growth rate, peaking near 2.4, compared to the coated blue line which peaks near 1.0.
In the second stage (t > 4.0 ns), Figures 5(b) and 5(c) only present several typical moments in the second evolutionary stage, that is, 4.0, 4.5, 5.0 and 6.0 ns, which correspond to the evolution after 4.0 ns in Figure 5(a). As clearly observed from Figure 5(a), the gold pre-plasma in the uncoated structure expands to a larger extent before 4.5 ns. After 4.5 ns, affected by the KHI, the gold pre-plasma curls and transports toward the cone-tip region. As a result, the expansion distance of plasma in the uncoated case becomes shorter than that in the coated case. The initial configurations of the gold cone are identical in the two groups of simulations. The comparison results show that the coating effectively restrains the expansion of gold pre-plasma and maintains a more intact structure of the gold cone. Meanwhile, the amount of gold material curled and transported to the cone tip due to KHI is greatly reduced, which can be directly verified by the comparison between Figures 4(c) and 4(d) and between Figures 4(g) and 4(h). The above phenomena fully demonstrate that the coating can effectively suppress the growth of KHI. The arriving CH plasma establishes a large tangential velocity shear ΔV at the CH–Au interface, driving KHI. The linear growth rate of KHI is evaluated using the incompressible two-fluid formula[ Reference Zhang, Wu, Yang, Ma, Cui, Jiang and Zhang 35 ]:

where
${\mu}_\mathrm{CH}$
and
${\mu}_\mathrm{Au}$
 are the tangential velocities of the CH and Au plasmas, respectively,
${\rho}_\mathrm{CH}$
 and
${\rho}_\mathrm{Au}$
 are the densities of the CH and Au plasmas, respectively, and
$k$
 is the perturbation wavenumber set by the cone inner-surface roughness. In the simulations, the roughness of the target surface was induced by the spatial resolution. In the xy plane, the resolution is about 5 μm. The CH plasma density, velocity and resulting growth rate at Y = 100 μm are shown by the red dotted lines in Figures 5(d)–5(f). All data are obtained at the position of Y = 100 μm on the inner wall of the gold cone in the simulations, with physical quantities averaged over the region of Y = 100 ± 5 μm. The KHI growth rate γ remains near zero until the CH plasma arrives, and then rises sharply as both ΔV and
${\rho}_\mathrm{CH}$
 increase rapidly. Prior to KHI onset, the Au plasma is carried out of the cone tip with a flat, non-curled structure (Figure 4(c)). As the instability grows, it adopts a characteristic vortex structure (Figure 4(d)) and expands substantially in both lateral and longitudinal directions.
The two stages are coupled. The Au pre-plasma density
${\rho}_\mathrm{Au}$
 at the interface is set by Stage 1 expansion and directly enters the Stage 2 growth rate. The CH coating suppresses both stages simultaneously. In Stage 1, X-rays preferentially ablate the CH coating rather than the gold wall (Figure 4(f)), reducing Au pre-plasma generation and lowering
${\rho}_\mathrm{Au}$
 throughout the implosion, as clearly demonstrated by the transverse density profile of gold plasma in Figure 5(c). This reduced
${\rho}_\mathrm{Au}$
 also suppresses the Stage 2 growth rate. The coating transforms the single CH–Au interface into a double CH–CH–Au interface, reducing the tangential velocity difference at the inner Au–CH layer (Figure 5(e)) and lowering γ directly. Together, these effects delay KHI onset at Y = 100 μm by approximately 500 ps, from 4.1 to 4.6 ns, and sustain a low growth rate thereafter (Figure 5(f)). The total gold entrained toward the cone tip is substantially reduced (Figures 4(g) and 4(h)).
The coating strategy suppresses γ through lowering the gold plasma density
${\rho}_\mathrm{Au}$
 at the interface in Stage 1 and decreasing the tangential velocity difference ΔV in Stage 2. One can further notice that γ in Equation (3) depends linearly on the perturbation wavenumber k = 2π/λ. Here, λ is the dominant perturbation wavelength seeded by the cone inner-surface roughness. For a cone wall with characteristic roughness scale λ
r, the dominant KHI mode grows at a rate proportional to 1/λ
r. A rougher surface therefore seeds shorter-wavelength perturbations that grow faster and entrain more gold into the fuel plasma. Reducing the cone wall roughness below the current fabrication tolerance would lower k and directly suppress γ. This provides a complementary mitigation route alongside the coating strategy. The two approaches are additive: the coating acts on
${\rho}_\mathrm{Au}$
 and ΔV, while surface smoothing acts on k. Together, they suggest a path toward substantially cleaner colliding plasma in future DCI experiments.
Beyond quantifying gold contamination, the temporal evolution of Cu Kα transmittance provides an experimental means to assess the KHI growth rate. The gold mass fraction f Au at the cone tip is governed by KHI-driven entrainment in Stage 2. Following KHI onset, f Au grows approximately as exp(γt). The rate of transmittance decay is therefore directly linked to γ. This connection between transmittance and instability dynamics provides a unique experimental diagnostic for the KHI growth rate. It also opens a route to investigate the dependence of γ on the wavenumber. This will be pursued in future experiments by systematically varying the cone inner-surface roughness.
4 Conclusion
We report a hydrodynamic investigation of the DCI scheme, analyzing high-resolution data captured from the central region using a monochromatic backlight imaging system during the 2022-DCI-R7 experimental campaign. Experimental results demonstrate that the spike structures observed at both lateral edges of the cone tip originate from gold plasma formation along the inner surface of the gold-cone wall. The implosion process is further investigated using the radiation-hydrodynamics code FLASH, revealing that gold accumulation at the cone tip arises from two coupled mechanisms: X-ray ablation of the inner cone wall by laser-driven radiation, and KHI-driven entrainment of gold plasma at the fuel–cone interface. To mitigate this issue, we propose and experimentally verify a CH inner-wall coating strategy for the gold cone. The coating effectively suppresses gold pre-plasma generation in the initial stage (Stage 1) and reduces the KHI growth rate in the subsequent stage (Stage 2), thereby substantially decreasing the gold mass fraction at the cone tip. By integrating experimental measurements with 3D hydrodynamic simulations, we confirm that the coating strategy significantly reduces the radiative cooling penalty caused by gold contamination, bringing the plasma purity closer to the level required for DCI ignition. This work represents a meaningful step toward achieving the plasma purity required for high-gain DCI and provides valuable insights into dynamics of KHI-driven contamination in high-energy-density interfacial flows.
Acknowledgements
We thank the staff members of the SG-II Upgrade facility (https://cstr.cn/31126.02.SG II.UP.HPLF) in Shanghai for providing technical support and assistance in data collection and analysis. This study was supported by the Strategic Priority Research Program of the Chinese Academy of Sciences (Grant Nos. XDA25010100, XDA25010300, XDA25030100, XDA25051100, XDA25030200 and XDA25051000).

 Open access

