Introduction
The nutritional environment during developmental periods, such as the fetal period and infancy, influences the risk of developing chronic and non-communicable diseases later in life, including lifestyle-related diseases such as type 2 diabetes and cardiovascular disease. Therefore, the nutritional environment during the first 1,000 days from conception to two years after birth is important for the health of offspring. Reference Hanson and Gluckman1,Reference Butel, Waligora-Dupriet and Wydau-Dematteis2 However, approximately 7% of adult women worldwide are underweight, which is considered a public health concern in many settings, Reference Black, Victora and Walker3 and underweight in females is closely related to low birth weight. Reference Arabzadeh, Doosti-Irani, Kamkari, Farhadian, Elyasi and Mohammadi4 Birth weight is widely recognized as an important marker of maternal and fetal health status, and influenced by factors such as maternal nutrition, placental function, and intrauterine environment. Globally, 14.7% of all newborns have low birth weight. Reference Okwaraji, Krasezec and Bradley5 Numerous epidemiological studies and animal experiments have reported that intrauterine growth restriction (IUGR) in children exposed to low nutrition during fetal life increases the risk of developing lifestyle-related diseases in adulthood. Reference Godfrey and Barker6,Reference Bertram and Hanson7
Although mothers need to consume sufficient nutrients, iron is one of the most common nutrients deficient during gestation. Iron is an important element for humans because it is involved in oxygen transport and energy metabolism as a component and cofactor of iron-containing enzymes, such as hemoglobin and the cytochrome system. Reference Frieden8 During gestation, the demand for iron increases due to fetus growth, iron storage in the umbilical cord and placenta, and increased red blood cell volume due to increased circulating blood volume. Reference Zimmermann and Hurrell9 When a woman with chronic iron deficiency becomes pregnant, her iron needs and that of her fetus cannot be adequately met, which may negatively affect the fetus. Iron deficiency during pregnancy has been found to affect the mental and physical growth of a child. Reference Joshi, Nair, Khade and Rajan10,Reference Rees, Hay, Hayes, Stevens, Gambling and McArdle11 It has also been associated with lifestyle-related diseases, such as the onset and progression of type 2 diabetes. Reference Rajpathak, Crandall, Wylie-Rosett, Kabat, Rohan and Hu12,Reference Sun, Franco and Hu13 Animal studies have shown that iron deficiency results in the loss of fertility, with serious consequences for mothers. Reference Tonai, Kawabata and Nakanishi14 Furthermore, iron deficiency increases glucose dependence in rats. Reference Brooks, Henderson and Dallman15
Several isoforms of glucose transporters (GLUTs) mediate glucose uptake and release. GLUT2 functions primarily in the liver and catalyzes the passive transport of glucose in an insulin-independent manner, responds to high glucose concentrations, and stimulates insulin secretion. Reference Thorens16–Reference Iynedjian18 GLUT4 functions primarily in the adipose tissue and muscle and is insulin-dependent, moving to the plasma membrane in response to insulin stimulation and blood glucose uptake into the cell. Insulin binds to the insulin receptor (IR), a transmembrane glycoprotein with intrinsic protein tyrosine kinase activity. This activates tyrosine kinase, phosphorylating insulin receptor substrate-1 (IRS-1), which then regulates GLUT4 translocation and glucose uptake via phosphoinositide 3-kinase (PI3K)-protein kinase Akt (Akt) signaling. Reference Ueda-Wakagi, Mukai, Fuse, Mizushina and Ashida19 In addition to mediating glucose uptake, Akt plays a pivotal role in a variety of other essential cellular processes. These include inhibition of apoptosis, regulation of energy homeostasis, promotion of protein synthesis, and maintenance of mitochondrial integrity. Reference Manning and Toker20 Through these diverse functions, Akt serves as a key integrator of metabolic and survival pathways.
Although a reduced iron nutritional status may affect a mother’s conception rate and glucose metabolism in the offspring, the underlying mechanisms have not been fully investigated. To address this knowledge gap, we investigated maternal chronic iron deficiency in the mother herself and abnormalities in glucose metabolism in the succeeding generations of rats with different iron intake levels.
Materials and methods
Experimental animals and design
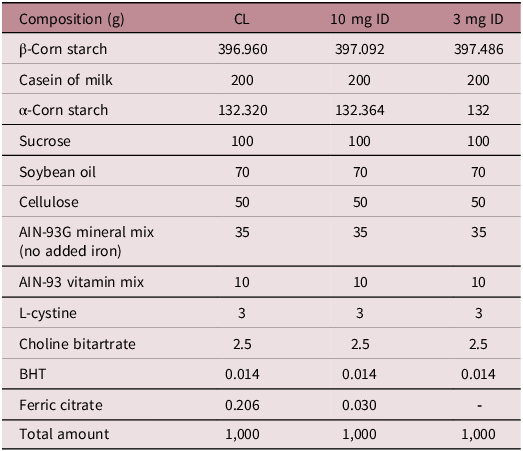
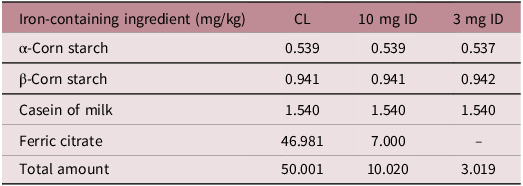
Four-week-old female Sprague-Dawley rats (Kyudo Co., Ltd., Saga, Japan) were pre-reared on a standard diet (CE-2, CLEA Japan, Inc. Tokyo, Japan) for one week. After pre-rearing, a control diet (CL) was provided for one week. At six weeks of age, the animals were divided into the CL and iron deficiency (ID) groups, the latter receiving the experimental diet. At ten weeks of age, pro-estrus rats were housed with male rats of the same strain overnight for mating. The day on which sperm was confirmed in the vaginal mucus plug was defined as day 0.5 of pregnancy. In the ID group, rats that gave birth were labeled ID+, and those that did not give birth were labeled ID−. Pups were euthanized within 24 h after birth. During the rearing period, experimental diets and distilled water were provided ad libitum. The experimental diets were prepared based on AIN-93G; the amount of iron in the experimental diet was determined using AIN-93G Mineral Mix (Oriental Yeast Co., Ltd., Tokyo, Japan) and according to Tables 1 and 2 (50 mg/kg diet in the CL group, 3 mg/kg diet in the 3 mg ID group, and 10 mg/kg diet in the 10 mg ID group).
Composition of experimental diet

CL, 10 mg ID and 3 mg ID composition per kg of laboratory chow.
Iron content in experimental diet

Food intake was measured daily during the rearing period. Body weight was measured once a week before pregnancy and daily during pregnancy. The animals were kept at a room temperature of 22 ± 3°C, humidity of 55 ± 7%, and a 12-h light–dark cycle (7:00–19:00 light period).
Collection of serum and organs
Maternal blood was collected weekly from the tail vein and from the inferior vena cava during autopsy. Neonates were collected from the carotid artery during autopsy. Blood samples were centrifuged (1,100 × g, 10 min, 4°C), and the supernatant was used for subsequent analyses. A portion of the blood was collected in heparinized hematocrit tubes, and blood hemoglobin was measured. After delivery, dams and neonates were anesthetized using isoflurane (099-06571; FUJIFILM Wako Pure Chemical Corporation, Osaka, Japan) administered by the open-drop method. A paper towel soaked with a small amount of 100% liquid isoflurane was placed in a closed chamber, and the rat was placed inside to induce anesthesia. Anesthesia was confirmed by observing loss of righting and pedal withdrawal reflexes. To maintain anesthesia, the end of a conical tube which contained a paper towel soaked with a small amount of isoflurane was placed over the animal’s nose. Blood collection and dissection were performed while the animal remained under anesthesia. These animal treatments were performed consistent timing and minimal exposure to reduce variability. The organs were treated with liquid nitrogen and stored at −80°C until further analyses.
Assessment of implantation
Implantation marks were assessed by macroscopic examination of the uterus after delivery. The marks were clearly visible as distinct discolorations or thickenings on the uterine wall, and no staining was required.
Blood biochemistry
Maternal blood hemoglobin levels were determined using a Hemoglobin B Test Wako (271-73901; FUJIFILM Wako). Serum insulin levels in dams and neonates were measured using a Levis Insulin-Rat T (637-01471; FUJIFILM Wako), and serum glucose levels were measured using a Glucose C II Test Wako (437-90902; FUJIFILM Wako). Serum adiponectin levels in neonates were measured using a mouse/rat adiponectin ELISA kit (410713; Otsuka Pharmaceutical, Tokyo, Japan).
RNA extraction and RT-qPCR
Total RNA was extracted from the neonatal liver and skeletal muscle using RNeasy Midi (75144; QIAGEN, Hilden, Germany) and RNeasy Mini (74104; QIAGEN) kits, respectively. All samples were treated with DNase using an RNase-Free DNase Set (79254; QIAGEN) to remove genomic DNA. The 28S and 18S rRNA bands were confirmed using electrophoresis on formaldehyde (16223–55; Nacalai Tesque Inc., Kyoto, Japan)-containing denaturing agarose gels (312-01193; NIPPON GENE, Tokyo, Japan). The extracted total RNA was used to synthesize cDNA using an iScriptTM Advanced cDNA Synthesis Kit for RT-qPCR (170-8890; Bio-Rad, Hercules, CA, USA), followed by RT-qPCR using SsoAdvancedTM Universal SYBR Green Supermix (172-5271; Bio-Rad). Analysis was performed using CFX Connect (185-5201; Bio-Rad). The amplification conditions were: denaturation at 95°C for 10 min and 40 cycles of 95°C for 15 s and 60°C for 1 min. The primer sequences used in this analysis were taken from the literature. Reference Gan, Wang, Chen, Zhu and Song21–Reference Langnaese, John, Schweizer, Ebmeyer and Keilhoff23 (Table 3) The mRNA expression levels were normalized to those of GAPDH. Before using GAPDH as a control, we confirmed that GAPDH was stably expressed and suitable for use as an internal control. The relative expression levels of the target genes were calculated using the 2-ΔΔCt method.
Primers for quantitative real-time PCR

Western blotting
Neonate livers were homogenized in a lysis buffer containing 50 mM Tris-HCl (pH 7.4; Tris base, 35409-45, Nacalai Tesque; HCl, 080-01066, FUJIFILM Wako), 5 mM EDTA (345-01865; FUJIFILM Wako), 300 mM NaCl (191-01665; FUJIFILM Wako), 0.1% NP-40 (599-05781; FUJIFILM Wako), and 1 mM DTT (044-33871; FUJIFILM Wako). The buffer was supplemented with a protease inhibitor mix containing 50 mM NaF (192-01972; FUJIFILM Wako), 50 mM β-glycerophosphate (048-34332; FUJIFILM Wako), 0.1 mM PMSF (195-381; FUJIFILM Wako), 1 mM benzamidine (04011-82; Nacalai Tesque), and 0.5 mM sodium vanadate (32062-32; Nacalai Tesque). The lysate was centrifuged at 600 × g for 3 min. The supernatant was collected, and an equal volume of sample buffer was added. Finally, the sample solution was heated at 96°C for 10 min for denaturation. Skeletal muscle was crushed at 1,100 × g for 30 s using a bead crusher (μT-12; TAITEC, Saitama, Japan) and centrifuged at 600 × g for 3 min. After centrifugation, samples were prepared in the same manner as for the neonatal liver. The protein concentration in the prepared samples was measured using a Bradford Protein Assay Kit (T9310A; Takara Bio Inc., Shiga, Japan) according to the manufacturer’s instructions.
Protein extracts were separated using sodium dodecyl sulfate-polyacrylamide gel electrophoresis and transferred onto nitrocellulose membranes (10600096; Cytiva, Little Chalfont, UK). The membranes were blocked to reduce non-specific binding using TBS-T containing 3% skim milk (190-12865; FUJIFILM Wako) for 1 h at 22 ± 2°C. TBS-T was prepared by adding 0.1% Tween-20 (160-21211; FUJIFILM Wako) to TBS (pH 7.4, 20 mM Tris-HCl, 150 mM NaCl). Subsequently, the membranes were incubated with primary antibodies against GLUT2 (ab54460; Abcam, Cambridge, UK), GLUT4 (#2213; CST, Danvers, MA, USA), Akt (pan; #4691; CST), phospho-Akt (Thr308; #4056; CST), phospho-Akt (Ser473; #4060; CST), PDK1 (#3062; CST), phospho-PDK1 (Ser241; #3438; CST) or GAPDH (#3683; CST). Following three washes with TBS-T, the membrane was immersed with the secondary antibodies anti-rabbit IgG (#7074; CST) or anti-mouse IgG (#7076; CST) for 30 min at 22 ± 2°C. After washing with TBS-T, the membrane was exposed to Chemi-Lumi One Super (02230-30; Nacalai Tesque) and measured using a Molecular Imager ChemiDocTM XRS + with the Image LabTM Software (170-8265; Bio-Rad). The target protein expression levels were expressed as fold changes relative to GAPDH to normalize the data.
Statistical analysis
All statistical analyses were performed using the IBM SPSS version 25.0 software. Maternal outcomes were measured using the Kruskal–Wallis test. When a significant overall effect was observed, pairwise comparisons were conducted using Dunn’s test with Bonferroni correction. Proportions were not statistically compared because each group yielded only one summary value. Neonatal data were averaged within each dam to account for litter effects, and statistical analyses were performed at the dam level using two-way analysis of variance to examine the effects of group and sex. Significance was assessed for main effects and their interaction. The overall main effect of sex was not assessed because the study aimed to examine group-specific differences rather than effects averaged across groups. Data are shown as the mean ± standard deviation. Differences were considered statistically significant at p < 0.05.
Results
Maternal weight and food intake
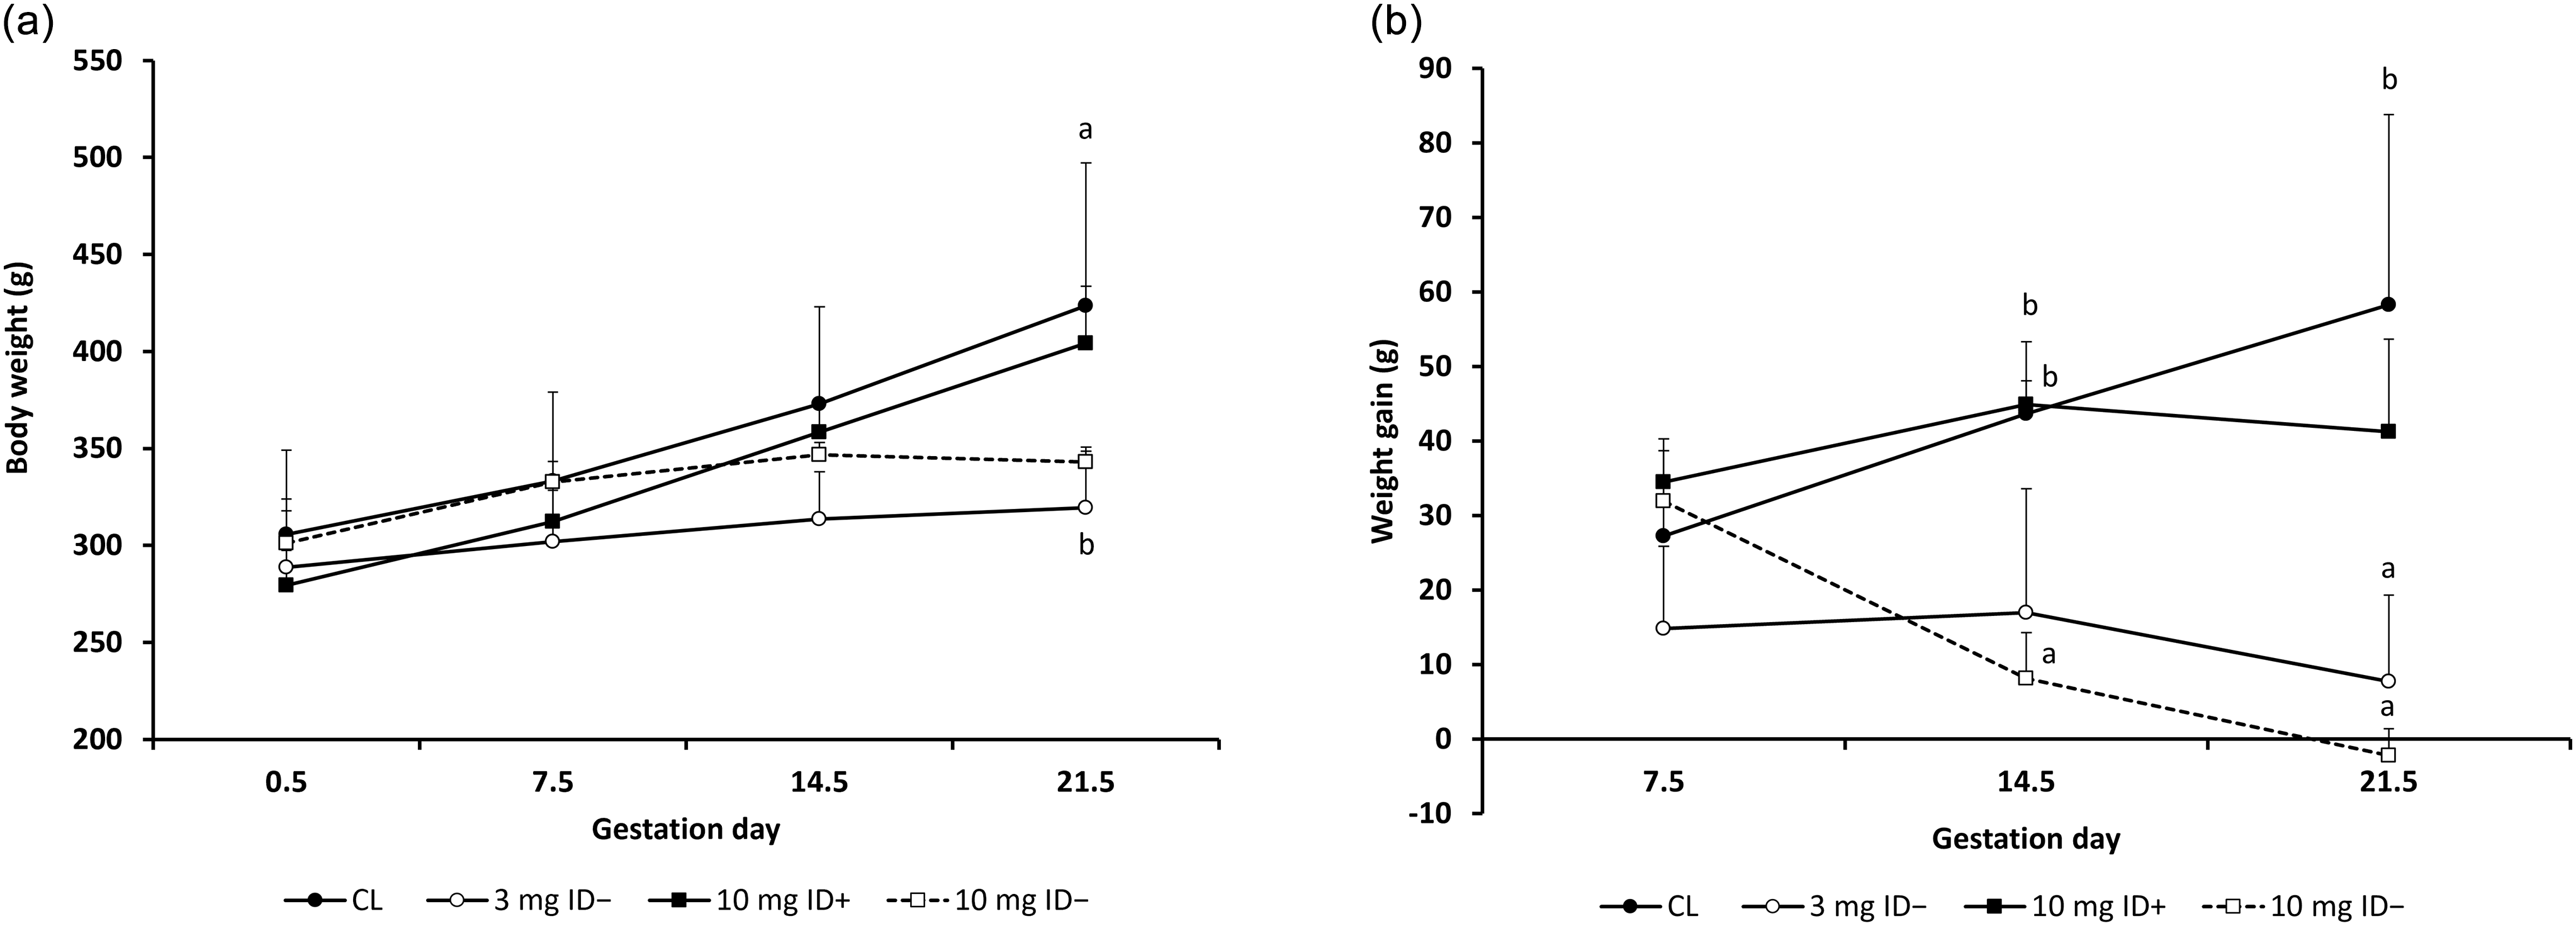
There were no significant differences in weight or weight gain before pregnancy among the four groups (data not shown). Although the CL and 10 mg ID+ groups gained weight up to day 21.5, the groups that did not give birth (the 3 mg ID− and 10 mg ID− groups) gained little weight from day 7.5 onward (Fig. 1a). The CL group continued to gain weight until day 21.5, while the 10 mg ID− group showed a marked decrease in weight gain after day 7.5 (Fig. 1b).
Changes in maternal weight and weight gain. (a) Weight transition during gestation (b) Weight gain transition during gestation. CL: n = 6, 3 mg ID−: n = 5, 10 mg ID+: n = 3, 10 mg ID−: n = 3 Statistical analysis was performed using the Kruskal–Wallis test, and when a significant overall effect was detected, pairwise comparisons were conducted using Dunn’s test with Bonferroni correction. ab There are significant differences between each group that do not share superscripts (p < 0.05). Animals that were plug-positive but showed no visible implantation marks at autopsy were included in the analysis, as early pregnancy loss could not be definitively excluded.

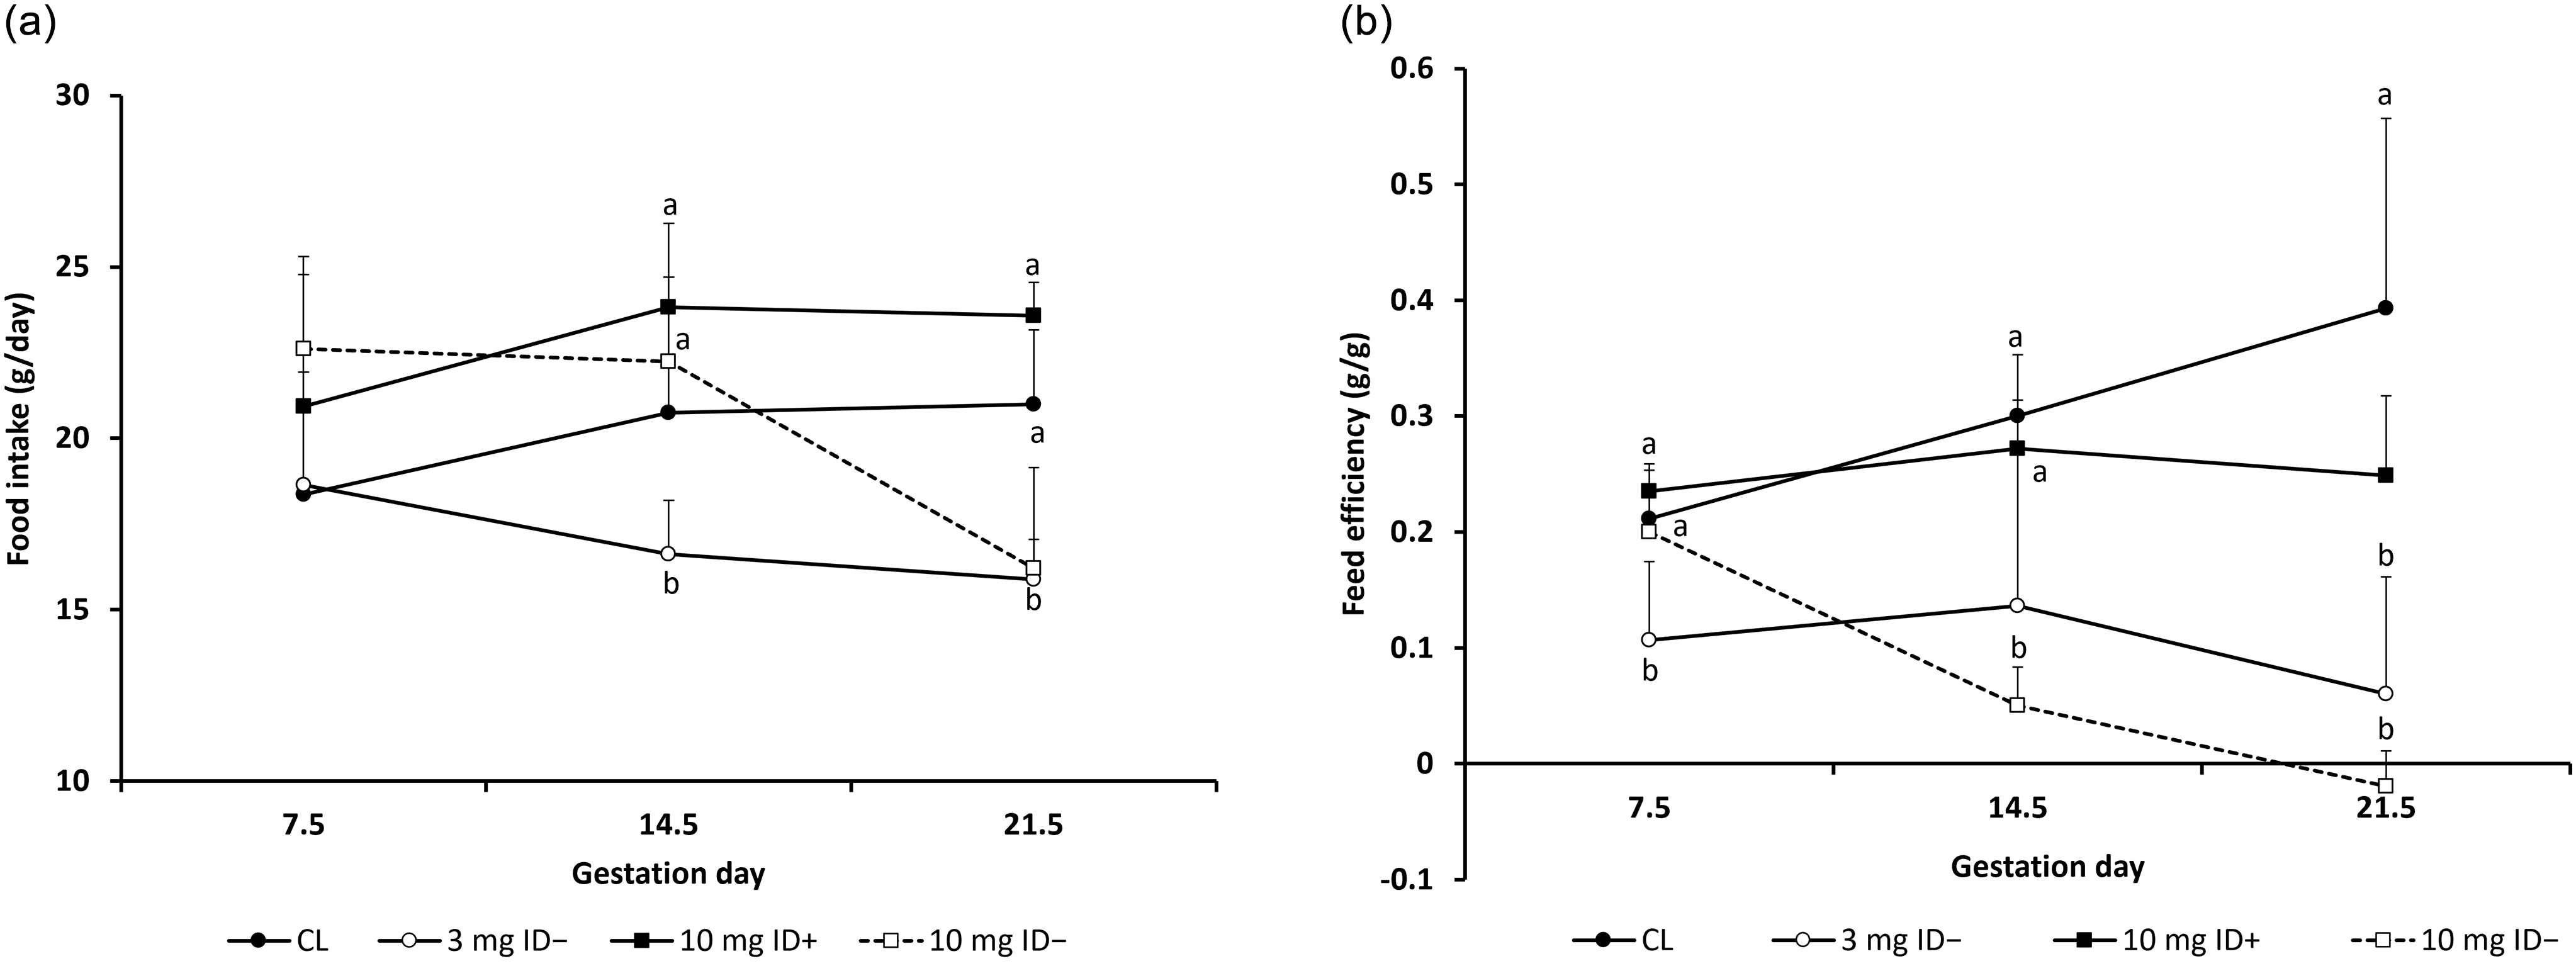
During gestation, food intake decreased in the ID− groups; specifically, that of the 10 mg ID− group decreased rapidly from day 14.5 onward (Fig. 2a). Feed efficiency continued to increase until day 21.5 for the CL group, whereas a decrease was observed in the 3 mg ID− and 10 mg ID− groups (Fig. 2b).
Changes in maternal food intake and feed efficiency. (a)Food intake (g/day) transition during gestation (b) Feed efficiency (weight gain per amount of food intake) transition during gestation. CL: n = 6, 3 mg ID−: n = 5, 10 mg ID+: n = 3, 10 mg ID−: n = 3. Statistical analysis was performed using the Kruskal–Wallis test, and when a significant overall effect was detected, pairwise comparisons were conducted using Dunn’s test with Bonferroni correction. ab There are significant differences between each group that do not share superscripts (p < 0.05). Animals that were plug-positive but showed no visible implantation marks at autopsy were included in the analysis, as early pregnancy loss could not be definitively excluded.

Maternal blood hemoglobin levels
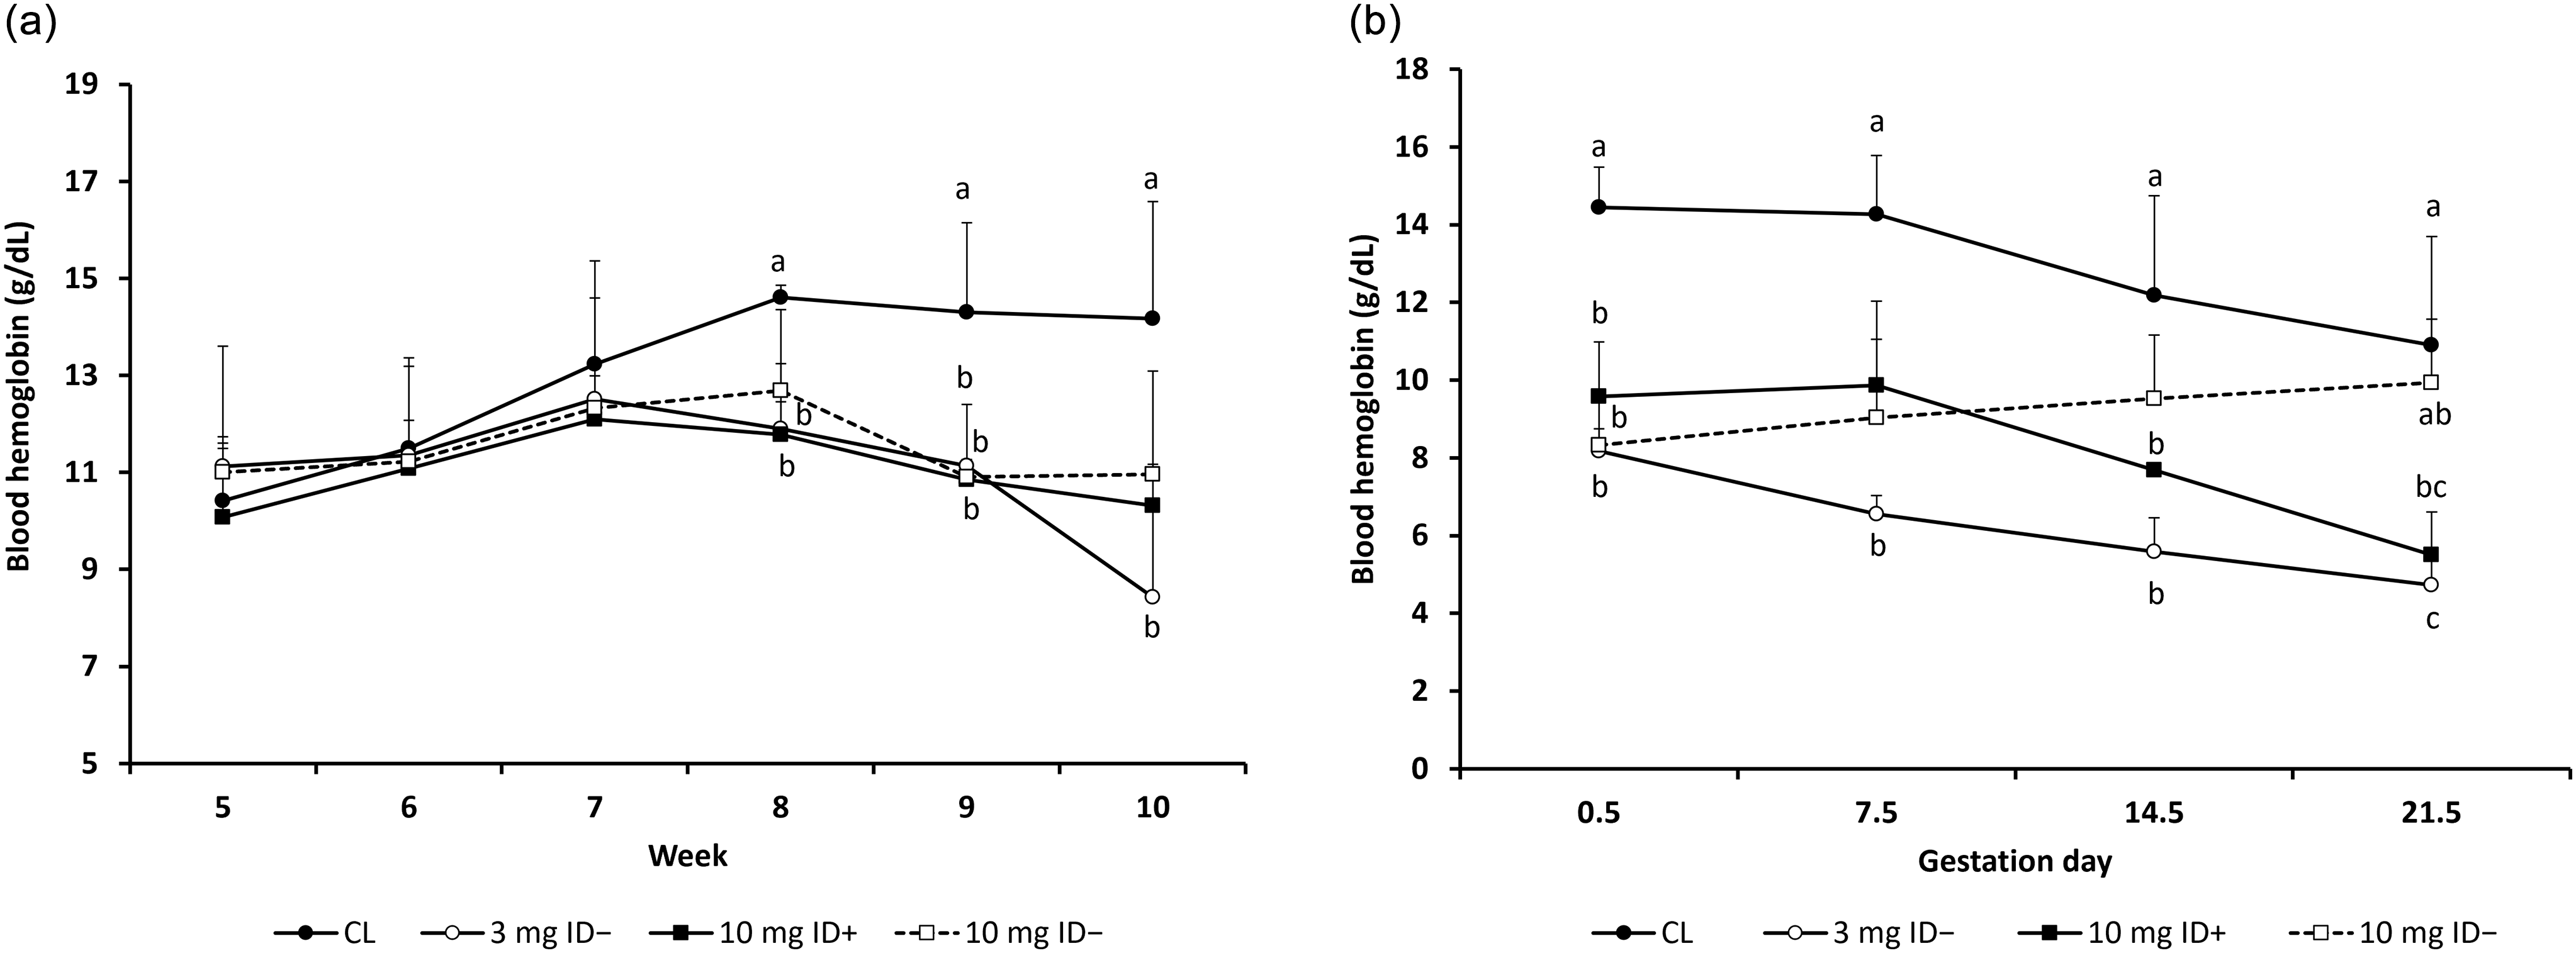
One week after the start of the experimental diet in each group, differences in blood hemoglobin levels gradually emerged, and significant differences were observed between the CL group and the other three groups at 9 weeks of age (Fig. 3a). During gestation, blood hemoglobin levels in the CL and 10 mg ID+ groups decreased from day 7.5, while that of the 3 mg ID− group continued to decrease until day 21.5 (Fig. 3b).
Transition in blood hemoglobin levels before and during gestation. These graphs were presented the level of blood hemoglobin before (a) and during gestation (b). CL: n = 6, 3 mg ID−: n = 5, 10 mg ID+: n = 3, 10 mg ID−: n = 3. Statistical analysis was performed using the Kruskal–Wallis test, and when a significant overall effect was detected, pairwise comparisons were conducted using Dunn’s test with Bonferroni correction. ab There are significant differences between each group that do not share superscripts (p < 0.05). Animals that were plug-positive but showed no visible implantation marks at autopsy were included in the analysis, as early pregnancy loss could not be definitively excluded.

Rate of maternal conception, delivery, fetal mortality, and number of births
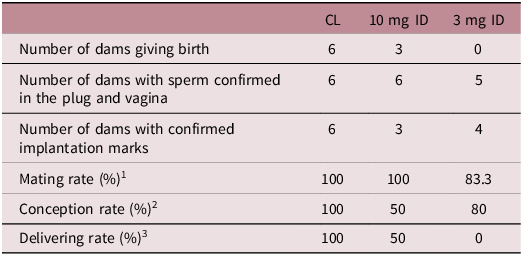
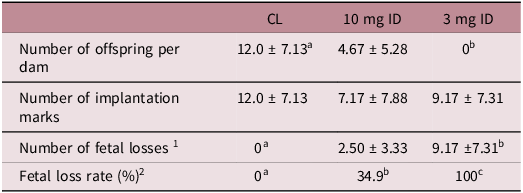
None of the dams in the 3 mg ID group gave birth, and half of the dams did not give birth in the 10 mg ID group. The conception rate decreased in the ID group, while the delivery rate decreased with decreasing dietary iron content (Table 4). The number of births per dam was significantly lower in the ID group than in the control group. Some rats in the ID− groups did not become pregnant and were observed to have implantation marks and placentas in the uterus. The fetal loss rate increased with decreasing dietary iron content (Table 5).
Maternal conception and delivery rates

n = 6 rats per group.
1 Percentage of mated animals. Mating rate (%) =(Number of dams with sperm confirmed in the plug and vagina / Number of dams) ×100.
2 Percentage of confirmed pregnancies among mated animals. Conception rate (%) = (Number of dams with confirmed implantation marks / Number of dams with sperm confirmed in the plug and vagina) ×100.
3 Percentage of dams delivered among those with confirmed mating. Delivering rate (%) =(Number of dams giving birth / Number of dams with sperm confirmed in the plug and vagina) × 100. Statistical analysis of proportions was not performed due to the absence of within-group variation.
Number of offspring per dam and fetal loss rate

1 Number of fetal losses = Number of implantation marks −Number of births.
2 Fetal loss rate = (Number of Fetal loss / Number of implantation marks) × 100. Data were presented as mean ± SD, n = 6 rats per group. Statistical analysis was performed using the Kruskal–Wallis test, and when a significant overall effect was detected, pairwise comparisons were conducted using Dunn’s test with Bonferroni correction. ab There are significant differences between each group that do not share superscripts (p<0.05).
Maternal organ weights
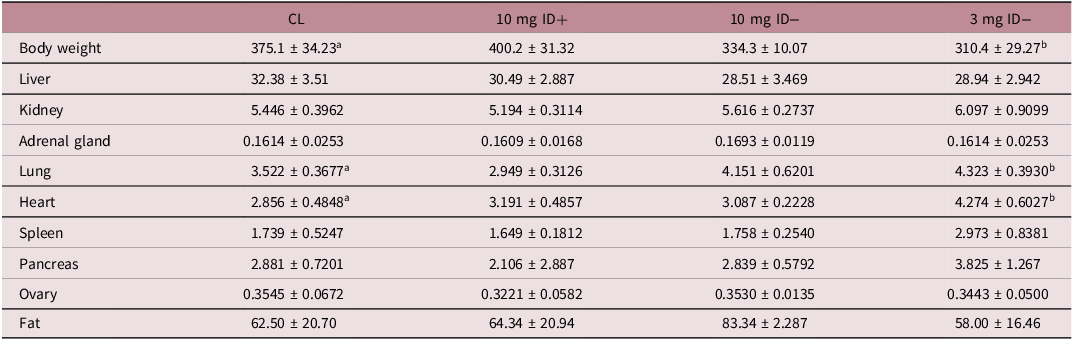
Postpartum maternal organ weight per body weight in the 3 mg ID− group was significantly higher than that in the CL group for the lungs and heart. The lungs were larger in dams that did not give birth than in dams that gave birth. Although the spleen was the heaviest in the 3 mg ID− group, the difference was not statistically significant (Table 6).
Maternal organ weight

Organ weights are expressed in mg per body weight. Data are presented as the mean ± standard deviation, CL: n = 6, 3 mg ID : n = 5, 10 mg ID+ : n = 3, 10 mg ID− : n = 3. Statistical analysis was performed using the Kruskal–Wallis test, and when a significant overall effect was detected, pairwise comparisons were conducted using Dunn’s test with Bonferroni correction. ab There are significant differences between each group that do not share superscripts (p < 0.05).
Birth and organ weights of neonates
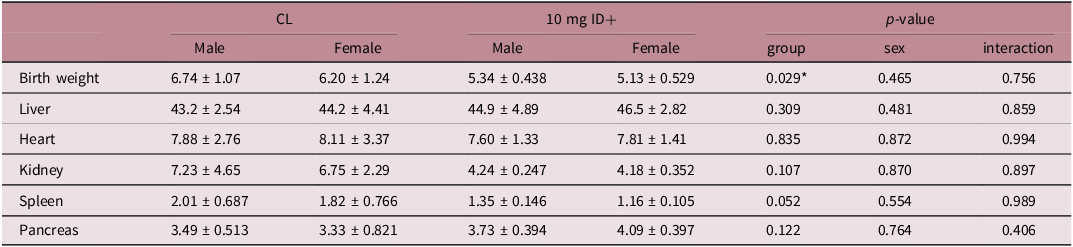
Birth weight was significantly lower in the 10 mg ID+ group than in the CL group. The weight of the spleen tended to be lower in the 10 mg ID+ group than in the CL group (Table 7).
Birth and organ weights of neonates

Organ weights are expressed in mg per body weight. Data are presented as the mean ± standard deviation and were analyzed using two-way ANOVA to test the effects of group, sex, and their interaction (group*sex). For neonates, data were averaged within each dam, and statistical analyses were performed at the dam level to account for litter effects. Sample sizes were as follows: CL group (n = 6 dams; 42 males, 28 females), and 10 mg ID+ group (n = 3 dams; 28 males, 11 females). *Significant differences between groups were observed (p < 0.05).
Serum glucose, insulin, and adiponectin levels in neonates
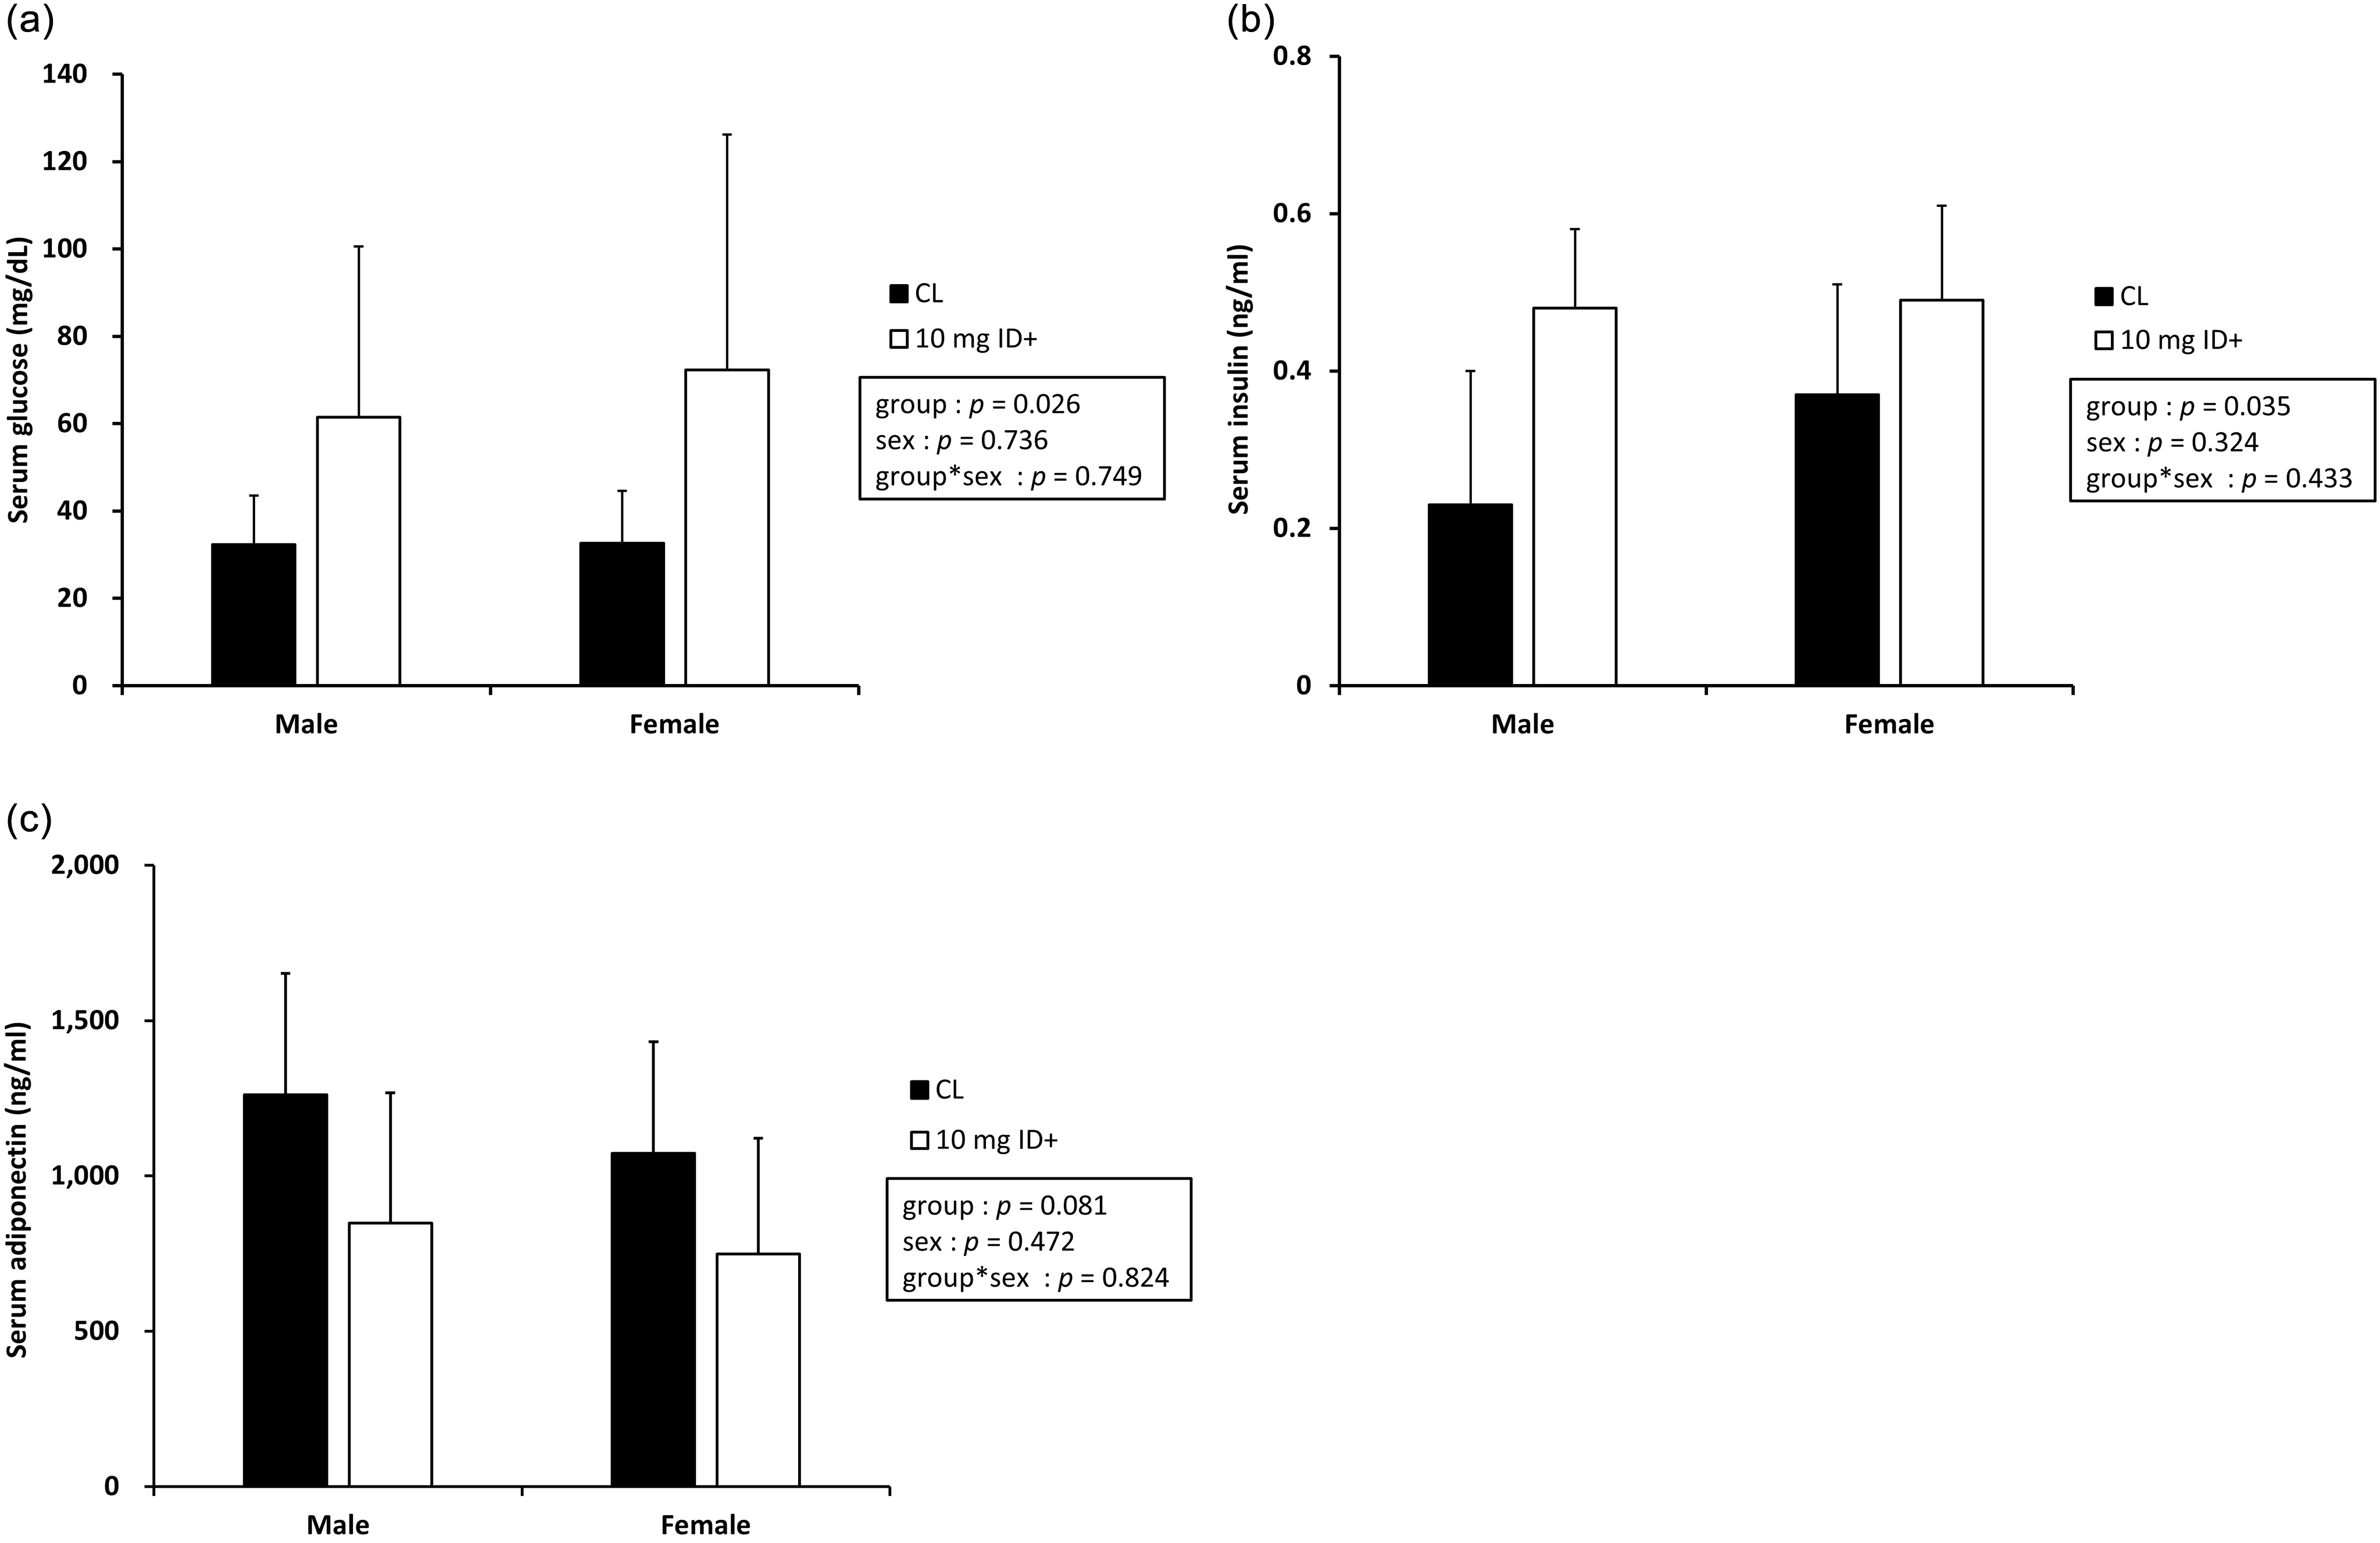
Serum glucose and insulin levels were significantly higher in the 10 mg ID+ group than in the CL group [serum glucose: F (1, 13) = 6.28, p = 0.026; serum insulin: F (1, 10) = 5.938, p = 0.035]. However, no significant interaction effects were observed between group and sex [serum glucose: F (1, 13) = 0.107, p = 0.749; serum insulin: F (1, 10) = 0.668, p = 0.433; Figs. 4 a and b]. Serum adiponectin levels tended to be lower in the 10 mg ID+ group, although the difference was not statistically significant [F (1, 13) = 6.28, p = 0.081]. There was also no significant interaction between group and sex [F (1, 13) = 0.052, p = 0.824; Fig 4c].
Blood biochemistry of neonates born from dams in the CL and ID groups. These figures were indicated various blood biochemistry parameter in neonates; concentration of serum glucose (a), and serum insulin (b), and serum adiponectin (c). Data are expressed as the mean ± standard deviation. Two-way ANOVA was used to analyze the effects of group and sex. Significance was assessed for the main effects and their interaction. Data from neonates were averaged within each dam, and statistical analyses were performed at the dam level to account for litter effects. Sample sizes were as follows: CL group (n = 6; male = 42, female = 28), and 10 mg ID+ group (n = 3; male = 28, female = 11). p < 0.05 was considered statistically significant.

mRNA and protein expression in the neonate liver and skeletal muscle
GLUT2 mRNA expression in the liver tended to be lower in the 10 mg ID+ group, although the difference was not significant [F (1, 13) = 3.862, p = 0.071; Fig. 5a]. However, protein expression levels in the liver were significantly higher in the 10 mg ID+ group and based on sex [group: F (1, 13) = 10.712, p = 0.010, sex: F (1, 13) = 8.371, p = 0.018], while no significant interaction was observed between group and sex [F (1, 13) = 3.047, p = 0.115]. Owing to the absence of significant interaction effects, we did not conduct further simple effect analyses (Fig. 5b). GLUT4 mRNA expression in the skeletal muscle tended to be lower in the 10 mg ID+ group, although this difference was not significant [F (1, 11) = 4.100, p = 0.068]. There was also no significant interaction between group and sex [F (1, 11) = 0.941, p = 0.353; Fig. 5c]. GLUT4 protein expression was significantly decreased in the 10 mg ID+ group compared to the CL group [F (1, 13) = 19.002, p = 0.002]. There was no significant interaction between group and sex [F (1, 13) = 0.464, p = 0.513; Fig. 5d]. The ratio of skeletal muscle p-Akt (Thr308) to Akt protein expression was significantly decreased in the 10 mg ID+ group compared to the CL group [F (1, 13) = 10.258, p = 0.011], and there was no significant interaction between group and sex [F (1, 13) = 1.432, p = 0.262; Fig. 5e]. The p-Akt (Ser473)/Akt protein expression did not differ between the two groups [F (1, 13) = 0.064, p = 0.807], but a significant main effect of sex was observed [F (1, 13) = 7.049, p = 0.026]. Interaction effects were non-significant [F (1, 13) = 0.538, p = 0.482], and no further simple effect analyses were conducted (Fig. 5f). The p-PDK1 (Ser241)/PDK1 protein expression did not differ by group and sex [group: F (1, 13) = 0.992, p = 0.345, sex: F (1, 13) = 0.552, p = 0.476], and no significant interaction between was observed [F (1, 13) = 0.334, p = 0.577; Fig 5g].
mRNA and protein expression in liver and skeletal muscle of neonates. The graphs indicate mRNA and protein expression in neonates; GLUT2 mRNA relative expression (a) and protein relative expression (b) in liver, GLUT4 mRNA relative expression (c) and protein relative expression (d), and p-Akt (Thr308)/Akt protein relative expression (e), p-Akt (Ser473)/Akt protein relative expression (f), and p-PDK1 (Ser241)/PDK1 protein relative expression (g) in skeletal muscle. Representative western blot bands are shown. Data are expressed as the mean ± standard deviation. Two-way ANOVA was used to analyze the effects of group and sex. Significance was assessed for the main effects and their interaction. Data from neonates were averaged within each dam, and statistical analyses were performed at the dam level to account for litter effects. Sample sizes were as follows: CL group (n = 6 dams; males = 6-8, females = 6-7), and 10 mg ID+ group (n = 3 dams; males = 6-8, females = 6-7). The number of neonates per dam varied slightly by tissue type (liver: 8 males and 7 females; muscle: 6 males and 6 females). p < 0.05 was considered statistically significant.

Discussion
In this study, we show that maternal iron deficiency leads to lower conception and delivery rates. The offspring of mothers with iron deficiency commonly exhibit abnormalities in glucose metabolism; however, sufficient knowledge on the underlying mechanisms has not yet been accumulated. We provide novel insights into the possible effects of maternal iron deficiency on GLUT expression in neonates.
The number of offspring per dam in the ID+ group was approximately 39% of that in the CL group, and none of the dams in the 3 mg ID− group gave birth (Table 5). Some of the rats in the 3 mg ID− group had unviable pregnancies with no implantation marks observed (Table 5). Rats fed diets containing 5–8 mg/kg of dietary iron have been found to experience frequent fetal death and resorption, which is associated with reduced iron absorption capacity due to decreased placental tissue weight and function. Reference Finch, Huebers, Miller, Josephson, Shepard and Mackler24 Our results suggest that the number of births decreases with increasing iron deficiency levels, leading to decreased maternal conception rates and difficulty in maintaining pregnancies because of fetal death and resorption, even when pregnancies are achieved. In fact, the 3 mg ID− and 10 mg ID− groups showed a decrease in food intake and body weight from day 7.5 of pregnancy onward, and were unable to maintain a normal pregnancy (Figs. 1 and 2). Iron transfer from the mother to the fetus via the placenta increases rapidly during late gestation, and fetal iron requirements peak during this period. Reference Finch, Huebers, Miller, Josephson, Shepard and Mackler24,Reference Sangkhae, Fisher, Ganz and Nemeth25 When iron intake is insufficient during gestation, the dam preferentially supplies iron to the fetus to satisfy the iron demand for fetal development. Reference Sangkhae, Fisher, Ganz and Nemeth25 Therefore, the groups that did not give birth may have been in a severely iron-deficient state, with almost no maternal iron stores necessary for fetal development, owing to potential pre-pregnancy iron deficiency and insufficient iron intake during gestation. The blood hemoglobin level of the groups that gave birth continued to decrease from day 7.5 to supply the fetuses, while the 10 mg ID− group was presumably able to maintain it until day 21.5 by absorbing the fetus (Fig 3b).
Hemoglobin is an oxygen-carrying protein that transports oxygen to various tissues. Reference Gell26 Because oxygen is supplied to the fetus via the placenta, anemia during gestation is a serious problem for both the mother and fetus. It has been reported that iron deficiency during pregnancy causes a decrease in maternal hemoglobin, an increase in serum transferrin, and a 65% decrease in fetal hemoglobin levels. Reference Woodman, Care and Mansour27 Moreover, the more significant the maternal iron deficiency, the worse the fetal growth and the higher the rate of fetal resorption. Furthermore, lung volume has been found to increase under hypoxic conditions. Reference Reinke, Bevans-Fonti and Grigoryev28,Reference Pankoke, Schweitzer and Bikker29 In this study, the lung weights were increased in dams that did not give birth, with a significant difference observed in the 3 mg ID group compared to the CL group. This may be due to insufficient iron and oxygen supply to both the dams and fetuses (Table 6). Thus, the fetus could likely not grow after day 7.5, when the dam weight no longer increased. However, we normalized maternal organ weights to postpartum body weight, which may reflect residual pregnancy-related physiological changes, such as increased blood volume and fluid retention. Therefore, the observed increase in the lung weight should be interpreted with caution, as these factors may confound the comparison between groups. Maternal iron deficiency has been reported to cause IUGR in offspring in various studies. Reference Allen30–Reference Hubbard, Bandyopadhyay, Wojczyk, Spitalnik, Hod and Prestia32 In the present study, we also observed frequent fetal resorption and a significant decrease in birth weight (Tables 5 and 7).
Neonates in the 10 mg ID+ group showed higher serum glucose and insulin levels than those in the CL group (Fig. 4a and b). IUGR offspring have been reported to exhibit elevated fasting plasma glucose and insulin levels. Reference De Blasio, Gatford, Harland, Robinson and Owens33 Although a more pronounced reduction in insulin sensitivity has been reported for females versus males, Reference De Blasio, Gatford, Harland, Robinson and Owens33 no sex differences were observed in the present study at the neonatal stage. The spleen weight tended to be lower in the ID group. Approximately 20–30% of the iron in the body is stored in the liver, spleen, and muscles. The mother preferentially supplies the iron stored in the body to the fetus. However, a mother in an iron-deficient state only has a small amount of iron stored; therefore, the amount of iron transferred to the fetus is also reduced. As pups born from iron-deficient rats have been found to have significantly reduced spleen weight, Reference Gambling, Dunford and Wallace34 it is likely that the reduced amount of iron transferred from the mother also reduces spleen weight in pups.
Although serum adiponectin levels in the 10 mg ID+ group tended to be lower than those in the CL group, the difference was not significant (Fig. 4c). Adiponectin, secreted by adipocytes, enhances fatty acid metabolism in the liver and skeletal muscles. Following the suppression of gluconeogenesis in the liver by inhibiting the expression of glycogenic rate-limiting enzymes, glucose uptake is increased in the skeletal muscle via GLUT4. Reference Kadowaki and Yamauchi35,Reference Yamauchi, Kamon and Ito36 Decreased adiponectin levels have been associated with insulin resistance, diabetes, obesity, and metabolic syndrome. Reference Kadowaki, Yamauchi, Kubota, Hara, Ueki and Tobe37 While no significant difference was observed in our study, the observed trend may suggest a potential early metabolic alteration in the 10 mg ID+ group, warranting further investigation in future studies. Furthermore, increased hepatic GLUT2 protein expression was observed (Fig. 5b), suggesting an effect on increased glucose uptake in response to hyperglycemia. Decreased adiponectin levels may increase glucose production without suppressing gluconeogenesis, increasing GLUT2 protein expression. In various animal studies, elevated levels of glycogenic enzymes, such as phosphoenolpyruvate carboxykinase (PEPCK) and glucose-6-phosphatase (G6Pase), and increased glucose production rates have been reported in the liver of IUGR fetuses. Reference Bertram and Hanson7,Reference Limesand, Rozance, Smith and Hay38,Reference Lane, MacLennan, Hsu, Janke and Pham39 Furthermore, iron-deficient rats reportedly exhibit elevated blood glucose levels and increased gluconeogenesis. Reference Brooks, Henderson and Dallman15 In our previous study, we observed a trend toward elevated blood glucose and G6Pase levels (data not shown). Another study in sheep reported that a reduced glucose supply to the fetus during late gestation increased glucose production rates and the expression of glycogenic genes in response to a low nutritional environment. Reference Narkewicz, Carver and Hay40–Reference Rozance, Limesand and Barry42 Increased glucose production in response to a low nutritional environment, such as reduced glucose supply to the fetus, is a beneficial adaptive response to maintain glucose supply, especially to vital organs such as the brain and heart. However, if this adaptation continues after birth, it has the adverse effect of increasing glucose production beyond the amount of glucose available, resulting in persistent hyperglycemia. In addition, preterm and low-birth-weight infants have been found to have high rates of gluconeogenesis. Reference Chacko, Ordonez, Sauer and Sunehag43,Reference Chacko and Sunehag44 Since gluconeogenic enzyme activity is elevated in diabetic model rats, and GLUT2 expression is elevated in obese model rats, Reference Thorn, Sekar and Lavezzi41,Reference Yamamoto, Fukumoto and Koh45 the offspring of the ID+ group may develop diabetes and obesity if their neonatal metabolic state persists. In this study, although GLUT2 mRNA expression tended to decrease, GLUT2 protein expression was significantly increased (Fig. 5a and b). This discrepancy may be due to post-transcriptional and -translational regulatory mechanisms, including differences in mRNA stability, translational efficiency, and protein degradation rates. It has also been reported that maternal nutritional restriction can alter DNA methylation patterns in fetal tissues. Reference Lan, Cretney and Kropp46–Reference Swali, McMullen, Hayes, Gambling, McArdle and Langley-Evans48 In the present study, it is plausible that maternal iron restriction may have led to epigenetic suppression of GLUT2 gene transcription, for example, through increased DNA methylation, thereby resulting in decreased mRNA expression. At the same time, the elevated blood glucose levels observed in offspring may have triggered compensatory responses that enhanced GLUT2 protein translation or inhibited its degradation, ultimately leading to increased protein levels. It has also been reported that gene expression at the mRNA level does not always correlate with protein levels. Reference Cheng, Teo and Krueger49,Reference Burcelin, Eddouks, Kande, Assan and Girard50 In addition, high insulin levels have been found to reduce GLUT2 gene expression. Reference Burcelin, Eddouks, Kande, Assan and Girard50 High insulin may lower the activity of transcription factors such as HNF-1α, which are important for GLUT2 transcription. Therefore, high insulin could contribute to a decrease in GLUT2 mRNA. In contrast, high glucose may increase protein levels by promoting translation or stabilizing the protein. These combined effects may have caused the mismatch between mRNA and protein levels. Future studies investigating the methylation status of the GLUT2 gene, along with translational regulation, will be essential to clarify the underlying mechanisms of this discrepancy.
IUGR fetuses have been found to exhibit decreased insulin secretion, plasma insulin, and increased plasma cortisol, glucagon, and norepinephrine levels. Reference Thorn, Sekar and Lavezzi41 Glucagon-induced gene transcription of gluconeogenesis-related genes greatly contributes to the activation of the gluconeogenesis pathway. Moreover, cAMP is produced when glucagon binds to glucagon receptors on the surface of liver cell membranes. cAMP-activated PKA phosphorylates cAMP-responsive element-binding protein (CREB) and stimulates the transcriptional induction of gluconeogenic genes. Peroxisome proliferator-activated receptor-gamma coactivator 1-alpha (PGC-1α) is a transcriptional coactivator that plays a central role in fasting responses such as glycogenesis and fatty acid oxidation and activates the transcription factors forkhead box protein O1 (FOXO1) and hepatocyte nuclear factor-4α (HNF-4α), contributing to the induction of glycolytic enzyme expression. Reference Yoon, Puigserver and Chen51 IUGR pups have been shown to have increased expression levels of PGC-1α, CREB, HNF-4α, and FOXO1. Reference Thorn, Sekar and Lavezzi41 The results of this study also suggest that pups born to ID group dams may have had IUGR and that metabolic adaptation to the low nutritional environment in utero activated the expression of gluconeogenesis-related genes and enhanced glucose production. In addition, serum glucose levels were high despite adequate serum insulin secretion, suggesting that the 10 mg ID+ group had decreased insulin sensitivity.
GLUT4 protein expression decreased in the 10 mg ID+ group (Fig. 5c and d). Skeletal muscle-specific GLUT4 knockout mice can develop insulin resistance in the fat and liver due to abnormal systemic glucose metabolism, ultimately leading to diabetes. Reference Zisman, Peroni and Abel52,Reference Kim, Zisman and Fillmore53 Moreover, a diabetic rat model has been shown to inhibit the PI3K-Akt-AS160 signaling pathway. Reference Zhang, Li and Liang54 IUGR fetuses have been found to have decreased amounts of GLUT4 protein and transmitter molecules involved in GLUT4 translocation. Reference Muhlhausler, Duffield and Ozanne55 Furthermore, GLUT4 translocation has been found to be reduced in the adipose tissue of iron-deficient rats. Reference Yamagishi and Komabayashi56 In this study, GLUT4 and p-Akt (Thr308)/Akt expression levels were also decreased (Fig. 5d and e), suggesting that the number of transduction molecules involved in GLUT4 induction may be reduced and that signals related to GLUT4 translocation to the plasma membrane may be inhibited. However, despite no observable changes in p-Akt (Ser473) and p-PDK1 (Ser241) levels, p-Akt (Thr308) and GLUT4 were selectively decreased. This suggests that Akt activation may have been partially impaired. Furthermore, decreased p-Akt (Thr308) levels may also result in insufficient phosphorylation of downstream targets of Akt, such as AS160, inhibiting GLUT4 translocation. It has also been speculated that a low nutritional environment in utero reduces GLUT4 expression because of reduced GLUT4-induced transduction molecules as a metabolic adaptation to maintain basal metabolism. Moreover, the observed reduction in GLUT4 may reflect not only impaired translocation but also a decrease in total GLUT4 expression, potentially due to transcriptional or translational downregulation during fetal development. IUGR pups have been reported to have a decreased expression of GLUT1 and GLUT4 in the myocardium at 21 and 120 days of age, respectively. 57 Since the reduced expression of GLUT1 and GLUT4 persisted until 120 days of age, the reduced glucose uptake caused by reduced GLUT expression during IUGR may persist into adulthood and affect glucose metabolism. Therefore, these findings suggest that maternal iron deficiency may lead to persistent reductions in GLUT4 expression in offspring, thereby contributing to the future development of insulin resistance and diabetes. However, since GLUT4 expression in the plasma membrane and in the cytoplasm was not analyzed, the extent to which the expression levels obtained in this study are involved in glucose uptake remains unclear. Therefore, investigating the expression level of membrane-localized GLUT4 and the detailed signaling pathways related to the expression of GLUT4 is expected to provide more knowledge on glucose metabolism in offspring.
In conclusion, maternal iron deficiency decreases dam conception and delivery rates. In addition, we observed low birth weight in the neonates of iron-deficient rats. Indicators regulating glucose metabolism, such as GLUTs, were also affected. These results indicate that maternal iron deficiency affects glucose metabolism in neonates, potentially increasing the risk of abnormal glucose metabolism and the development of lifestyle-related diseases. While our cross-sectional analysis cannot establish causality, the observed changes may reflect early metabolic adjustments potentially linked to predictive adaptive responses, as proposed by the Developmental Origins of Health and Disease theory. However, as major physiological changes occur immediately after birth, which may be confounding factors, further longitudinal and mechanistic studies with larger sample sizes are needed to clarify the long-term effects of maternal iron deficiency on offspring metabolism and its epigenetic basis. Eventually, this research field may contribute to the scientific evidence supporting appropriate nutrition intake during pregnancy.
Acknowledgments
We would like to thank Editage (www.editage.jp) for English language editing.
Financial support
This research was supported by JSPS KAKENHI (Grant-in-Aid for Scientific Research (C), grant number JP23K10908).
Competing interests
None.
Ethical standard
This study was approved by the Nagasaki International University Faculty of Health Management Research Ethics Committee and the Animal Experimentation Committee (approval number 17A04-2) and was conducted in accordance with the Nagasaki International University Animal Experimentation Regulations and the Nagasaki International University Faculty of Pharmaceutical Sciences Animal Experimentation Guidelines.