Implications
Genetic diversity loss in domestic populations becomes especially important in apparently unsustainable species like donkeys, meaning the simultaneous loss of important functional traits. The Andalusian donkey breed fits the common framework of small endangered genetically unknown populations at the beginning of their conservation programmes, and thus can describe a translatable model systematizing the measures to take when the information available is reduced. Our findings enable quantifying the real risk of extinction such populations face, avoiding underestimating population intrarelationships and reporting an unreal population structure, hindering proper handling measures, reducing the effectiveness of the techniques implemented and worsening their situation.
Introduction
Not only did worldwide studies on the domestic donkey raise concerns about the endangerment risk of donkey breeds individually, but also about the whole species (Kugler et al., Reference Kugler, Grunenfelder and Broxham2008). Tools allowing us to understand the evolution of the different donkey populations in time, the future trends that they describe, and the factors conditioning such trends, become invaluable critical points when aiming at preserving and recovering those donkey populations from their complex status. Based on the characteristic lack of background information and the commonly applied husbandry systems, it is possible to infer a model to assess the genetic and demographical structure of certain donkey populations using a particular breed as an example. With the Egyptian ass and other rather undefined north African breeds as direct ancestors, the first precursors of the Andalusian donkey breed would have been introduced into the peninsula in the 6th century B.C., as already domestic animals with the transhumant movements by the Chamites, later components of the Iberian people, a fact that makes this breed stand out among the rest, as one of the direct remnants of the connection with the first African donkey ancestors. The only existing remains from the early presence of this species in the Iberian Peninsula, appear at the Celtiberian levels in sites in the Basque Country and Navarra, supporting the theory that Celtiberians would have introduced donkeys from Africa through the north. The first human migrations left Africa through the Bab-el-Mandeb Arabian strait and reached Europe around 45 000 years ago, ascendingly following the Afro-Mediterranean coast, to finally settle throughout the Southeastern Iberian territories, according to the most probable genetic and anthropological hypotheses (Melé et al., Reference Melé, Javed, Pybus, Zalloua, Haber, Comas, Netea, Balanovsky, Balanovska, Jin, Yang, Pitchappan, Arunkumar, Parida, Calafell and Bertranpetit2012). The Andalusian donkey breed would reach its maximum concentration in the early 19th century, surpassing the frontiers of the basin of the Guadalquivir River, something that has not excluded it from being recognized as endangered by the Spanish Official Catalogue of Livestock Breeds. The different census obstacles the breed had to face start dating from the end of the Cordobesian Umayyad Caliphate (756–1031 A.C.) and culminate with the industrialization process of the region since halfway through the 19th century. This would bring about the last drastic reduction of its census and current endangered status, as a consequence of the disappearance of the causes originating its creation, breeding and selection – crop transport through an inefficient transport network area and mule production. Although it started being scientifically noticed in the 1910s, the first reference to the studbook of the Andalusian donkey breed would not appear until 1939. However, its genetic structure has remained unknown. The studbook information, genetic diversity status, population structure and the assessment of breeding practices have become indispensable tools for the development of conservation programmes, as donkeys appraisal and valuation is still done considering their ancestry, what confers a more strictly economic basis to the control of endogamy and mating management (Santana and Bignardi, Reference Santana and Bignardi2015). Its traditional context and breeding methods may have led to an inbreeding increase, an effective population size reduction and a consequent genetic diversity loss. Therefore, the aim of this study is the development of a model to perform the analysis of the pedigree completeness downwards, checking the repercussions of ancestors and founders, evaluating the structure of the population, its genetic variability and connections between its genetic and demographic parameters, measuring the existing gene flux and quantifying the risk of genetic diversity loss; evaluating its endangerment degree to suggest effective conservation strategies for donkeys and other endangered animal small populations (Oldenbroek, Reference Oldenbroek1999).
Material and methods
Data registries and software tool
The complete pedigree file provided by the Union of Andalusian Donkey Breeders (UGRA) included 1015 animals constituting the historical population – 272 jackstocks and 743 jennies – born between January 1980 and July 2015. All registries were genotyped and parentage tests for the offspring included in the pedigree were performed with 28 molecular markers recommended by the International Society of Animal Genetics. Demographic and genetic parameters of the existing variability in the pedigree were evaluated and traced back to ancestors. Analyses were carried out using ENDOG (v4.8) software (Gutiérrez et al., Reference Gutiérrez, Cervantes and Goyache2005) on the complete pedigree file (historical population described above), on the current population, or alive animals in the historical population (914, 246 males and 668 females, born from January 1980 to July 2015) and a contrast population set (453 alive animals, 199 jackstocks and 254 jennies), including those donkeys in the current population from which both parents were known.
New-born annual increase, pedigree completeness index, breeding animals, generation interval and mean age of parents at offspring’s birth
The study of the number of births was carried out to assess the maximum and mean progeny number per jack or jenny. Pedigree completeness index (PCI), which summarizes the proportion of known ancestors of each ascending generation, was evaluated through: (1) the maximum number of generations traced; (2) the number of complete traced generations; (3) the number of complete equivalent generations, calculated as (1/2n) where n is the number of generations setting the individual apart from each known ancestor (Maignel et al., Reference Maignel, Boichard and Verrier1996), equal to
 $$\mathop{\sum}\nolimits_{i{\equals}1}^{n_{j} } {{1 \over {2^{{g_{{ij}} }} }}} $$
, where n
j
is the total number of ancestors of the animal, j and g
ij
the number of generations between j and its ancestor i (Boichard et al., Reference Boichard, Maignel and Verrier1997); and (4) the quality of the information of the pedigree through the proportion of known parents, grandparents, great-grandparents and great-great-grandparents registered in the studbook. Generation intervals (James, Reference James1977) and the average age of parents at the birth of their offspring were calculated for each of the four gametic pathways: sire to son, sire to daughter, dam to son and dam to daughter, from birthdate records for every animal together with those of its parents’. The jenny/jack ratio was computed through the percentage of females and males with progeny selected for breeding and the number of reproductive animals selected.
Inbreeding, coancestry and degree of non-random mating
First, individual inbreeding (F) was computed according to Meuwissen and Luo (Reference Meuwissen and Luo1992). Second, the average relatedness (AR) of each individual was computed as proposed by Gutiérrez et al. (Reference Gutiérrez, Cervantes and Goyache2005). Leroy et al. (Reference Leroy, Mary-Huard, Verrier, Danvy, Charvolin and Danchin-Burge2013) stated inbreeding F and coancestry C coefficients are identity estimators by descent (IBD), a probability that differs whether the alleles considered belong to a single individual or two individuals, respectively. Third, the individual rate of inbreeding
 $( {\overline{{\Delta F}} } )$
for the generation, computed as suggested by Gutiérrez et al. (Reference Gutiérrez, Marmi, Goyache and Jordana2009) was calculated using
 $\Delta F_{i} \,{\equals}\,1{\minus}\root {t_{i} \,{\minus}\,1} \of {1\,{\minus}\,F_{i} } $
, where t
i
is the number of complete equivalent generations and F
i
the inbreeding coefficient of the individual i. Mean inbreeding per generation was used to form a regression equation testing linear and quadratic functions, which predicted further inbreeding up to 15 generations onwards. Fourth, the individual rate of coancestry
 $( {\overline{{\Delta C}} } )$
for the generation was computed as suggested by Cervantes et al. (Reference Cervantes, Goyache, Molina, Valera and Gutierrez2011) through
 $\Delta C_{{ij}} \,{\equals}\,1\!{\minus}\,\root \!\!\!\!{{{t_{i} {\plus}t_{j} } \over 2}} \of {1{\minus}C_{{ij}} } $
, where t
j
and t
j
are the number of equivalent complete generations and C
ij
the coancestry coefficient for the individuals i and j. Finally, non-random mating was calculated as described by Caballero and Toro (Reference Caballero and Toro2000) relating to the inbreeding coefficients by (1−F)=(1−C) (1−α) (Wright, Reference Wright1969) indicating the existing deviation degree from Hardy–Weinberg proportions.
Probabilities of gene origin and ancestral contributions
First, the effective number of founders (f
e) was computed as
 $f_{{\rm e}} \,{\equals}\,{1 \over {\mathop{\Sigma}\nolimits_{k{\equals}1}^f {q_{k}^{2} } }}$
, where q
k
is the probability of gene origin of the kth founder and f the real number of founders (Lacy, Reference Lacy1989). Second, the effective number of ancestors (f
a) was determined by
 ${f_{{\rm a}} {\equals} {1 \over {\mathop{\Sigma}\nolimits_{k{\equals}1}^f {p_{k}^{2} } }}}$
, where p
k
is the marginal contribution of an ancestor k (Boichard et al., Reference Boichard, Maignel and Verrier1997). Third, the effective number of founder genomes (f
g) was obtained by calculating the inverse of twice the average coancestry (Caballero and Toro, Reference Caballero and Toro2000). Fourth, the expected marginal contribution of each major ancestor j (the largest genetic contributing founders or not), which is not already explained by a previously chosen ancestor was computed as (Boichard et al., Reference Boichard, Maignel and Verrier1997) and the contributions to inbreeding of nodal common ancestors, that is forming inbreeding loops, were computed according to Colleau and Sargolzaei (Reference Colleau and Sargolzaei2008). Fifth, the mean effective population size
 $${{(\overline{N_{{\rm e}} } )}} $$
(Wright, Reference Wright1969) was calculated as
 $$\overline{{N_{{\rm e}} }} \,{\equals}\,{1 \over {( {2\overline{{\Delta IBD}} } )}}$$
. Sixth, the number of equivalent subpopulations (Cervantes et al., Reference Cervantes, Goyache, Molina, Valera and Gutiérrez2008) was calculated through
 $S\,{\equals}\,{{\overline{{N_{{\rm e}} C_{i} }} } \over {\overline{{N_{e} F_{i} }} }}$
, in which
 $$\overline{{N_{{\rm e}} C_{i} }} \,{\equals}\,{1 \over {( {2\overline{{\Delta C}} } )}}$$
is the mean effective population size considering the coancestry coefficient and
 $$\overline{{N_{{\rm e}} F_{i} }} \,{\equals}\,{1 \over {( {2\overline{{\Delta F}} } )}}$$
, considering the inbreeding coefficient. Seventh, genetic diversity (GD) was computed as
 $$GD\,{\equals}\,1\,{\minus}\,{1 \over {2f_{{\rm g}} }}$$
. Eighth, GD lost in the population since the founder generation was estimated by 1−GD. Ninth, GD loss derived from the unequal contribution of founders was estimated by 1−GD*, where
 $$GD{^\asterisk}\,{\equals}\,1\,{\minus}\,{1 \over {2f_{{\rm e}} }}$$
(Caballero and Toro, Reference Caballero and Toro2000). The difference between GD and GD* indicates the GD loss owed to genetic drift accumulated since the foundation of the population (Lacy, Reference Lacy1989). Finally, the effective number of non-founders (N
ef) was computed through
 $$N_{{{\rm ef}}} \,{\equals}\,{1 \over {{1 \over {f_{g} }}\,{\minus}\,{1 \over {f_{e} }}}}$$
(Caballero and Toro, Reference Caballero and Toro2000).
Herd relationships and breeding strategy
The existing 145 subpopulations were computed considering 272 owners/farms. Minimum Nei’s genetic distance (Nei, Reference Nei1987) between subpopulations i and j was computed as D
ij
=[(C
ii
+C
jj
)/2]−C
ij
, in which C
ij
is the average pairwise coancestry between individuals of the subpopulations i and j, including all N
i
×N
j
pairs. C
ii
and C
jj
are the average pairwise coancestries within subpopulations i and j, to assess interherd relationships. The maximum limit of relationship coefficient between mated animals is assessed to maintain ΔF in a generation equal or below 1% (N
e
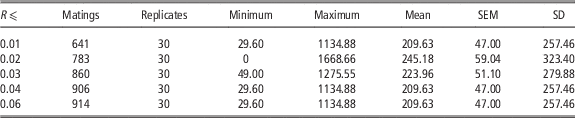
=50), level below which the fitness of a population steadily decreases (Meuwissen and Woolliams, Reference Meuwissen and Woolliams1994). Relatedness is the probability that two individuals share an allele because of common ancestry. This probability is expressed as the coefficient of relatedness (R), and ranges from 0 (unrelated) to 1 (clones or identical twins), excluding alleles simply shared because of belonging to the same species or population. In total, five mating groups in which the relationship coefficient between mated animals was kept below 1.00%, 2.00%, 3.00%, 4.00% and 6.00% (the greatest feasible limit considering all possible matings among all 914 living animals) were assessed. The inbreeding coefficient (F) for the offspring of each mating was calculated as one-half of the parental relationship coefficient. The inbreeding rate (Gutiérrez et al., Reference Gutiérrez, Marmi, Goyache and Jordana2009) was estimated by averaging the individual inbreeding increase through
 $$\Delta F_{i} \,{\equals}\,1{\minus}\root {t_{i} {\minus}1} \of {1\,{\minus}\,F_{i} } $$
, where t
i
is the number of complete equivalent generations and F
i
the inbreeding coefficient of the individual i. In total, 60 random matings were selected within each group, basing on the number of births in 2015 (56 births) and on the assumption of one foal/jenny using SPSS Inc. (2008). Then, 30 replicates were analysed to calculate the average effective population size (N
e) (Gutiérrez et al., Reference Gutiérrez, Marmi, Goyache and Jordana2009).
Results
New-born annual increase, pedigree completeness index, breeding animals, generation interval and mean age of parents at offspring birth
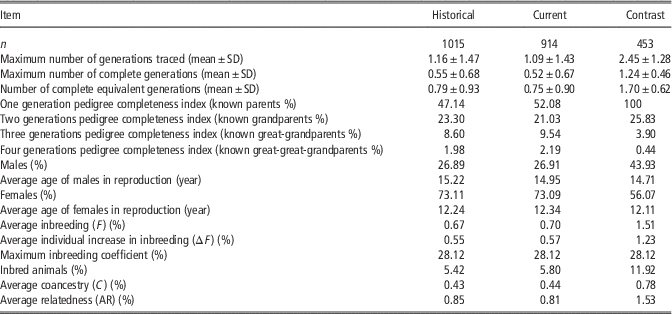
The average number of foals born per year was 28.19, reaching the highest number (71) in 2003. The average equivalent complete generations number during the last decade was 1.38 and increased almost linearly over the years, until it reached a value of 2.59 in 2015. The PCIs for one, two, three and four generations, the statistics for the average maximum number of traced generations, average number of complete generations and average number of equivalent generations are shown in Table 1. Maximum progeny per jacks (41) and jennies (7) was equal in the three population sets. However, jenny/jack ratio (2.73/1 historically and 2.71/1 currently) decreased in the contrast population (0.78/1). The mean number of progeny for males and females was slightly and progressively lower in each population; 1.78 in the historical, 1.76 in the current and 1.24 in the contrast population for males and 0.63, 0.60 and 0.54 for females in the same population sets, respectively. The percentage of females with progeny selected for breeding was 10.76% and 25% for males in the historical population; 11.82% for females and 26.42% for males in the current population; and 30.74% for females and 35.42% for males in the contrast population. Historically breeding jacks were 2.98 years older than breeding jennies on average, but this difference shortened in the current (2.61) and contrast population sets (2.6). The average generation interval for the historical population was 7.40 years and 7.34 years for the current population.
Summary statistics of the pedigree analysis, average inbreeding, average coancestry and degree of non-random mating for the historical population (n=1015), the current population (n=914) and the contrast population (first generation, both ancestors known animals) (n=453) of the Andalusian donkey breed

Inbreeding, coancestry and degree of non-random mating
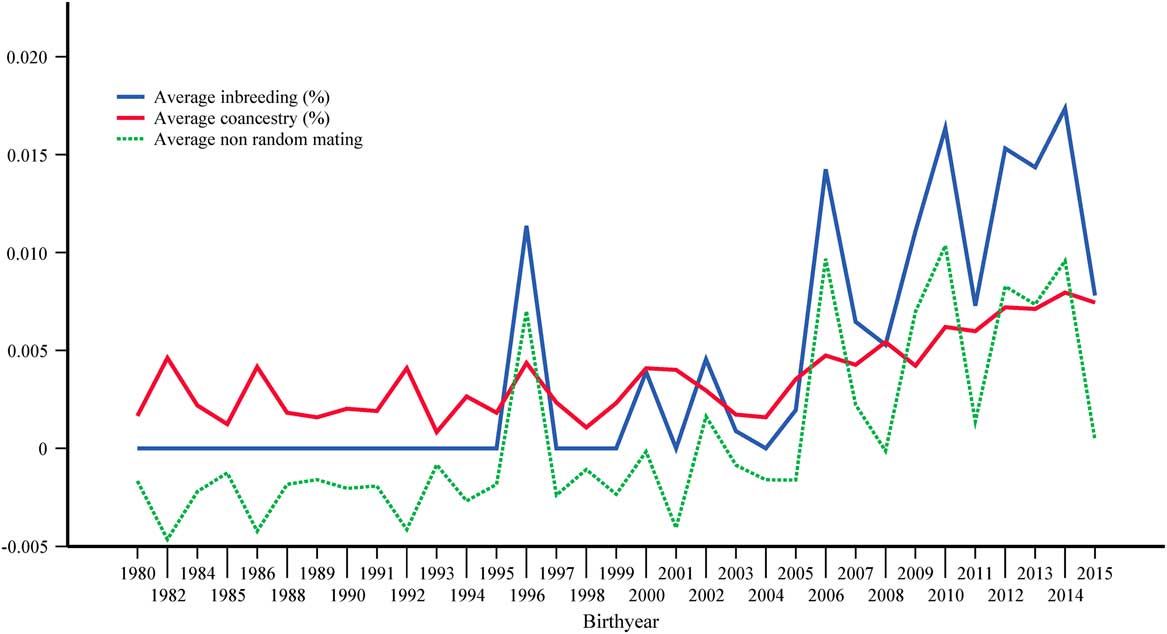
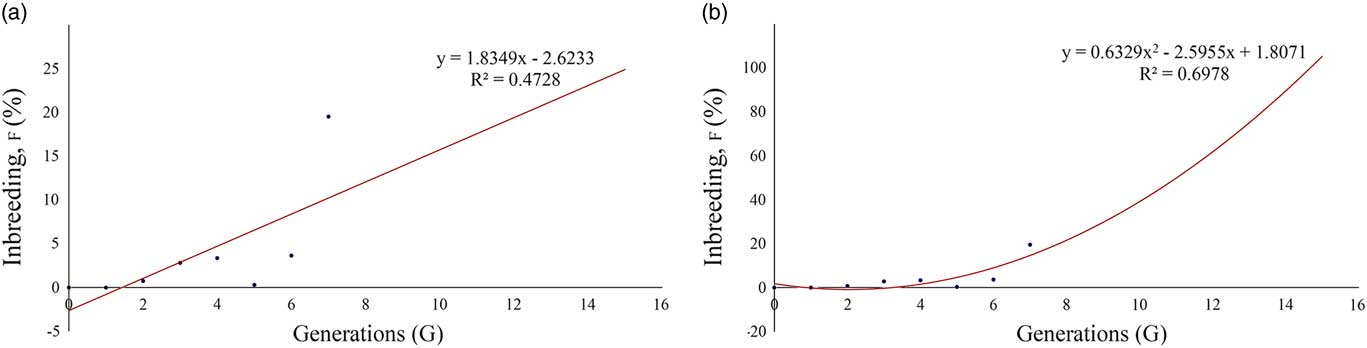
Although average inbreeding was low (0.67% in the historical population, 0.70% in the current population and 1.51% in the contrast population), highly inbred animals were present (maximum inbreeding coefficient of 28.12%). The percentage of inbred animals was 5.42%, 5.80% and 11.92%; the average coancestry was 0.43%, 0.44% and 0.78%, and the degree of non-random mating reached a progressively increasing value of 0.0025, 0.0027 and 0.0074 for the three populations sets, respectively (Figure 1). The average inbreeding coefficient reached a 1.73% maximum in 2015, whereas 1.59% maximum average coancestry was reached in 2014. The average degree of non-random mating reached a maximum of 0.50% in 2006. Matings between highly inbred animals, 0.20% matings between full sibs, 1.18% matings between half sibs and 1.18% parent-offspring matings have occurred. Regression equations testing linear and quadratic functions are shown in Figure 2.
Evolution of the average coefficient of inbreeding, average coancestry and degree of non-random mating of the Andalusian donkey breed population according to the maximum number of complete generations from 1980 to 2015.

Linear (a) and quadratic (b) regression equations for mean inbreeding from the 1st to 5th generation, and predicted inbreeding from the 6th to 15th generation in the Andalusian donkey breed.

Probabilities of gene origin and ancestral contributions
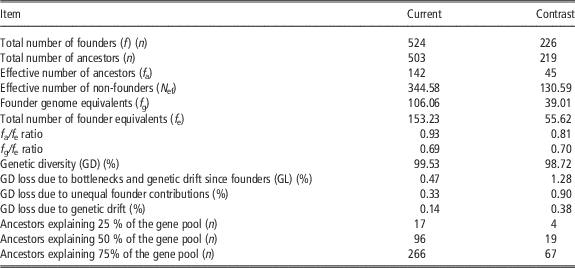
The results for the analysis of the gene origin probabilities, ancestral contributions and genetic diversity loss are shown in Table 2. Considering the marginal genetic contribution, a single ancestor (identification number: 1) explained from 9.18% to 14.44% of the genetic pool of the contrast population and from 7.56% to 9.92% of the genetic pool of the current population, and was also responsible for 43.63% to 60% of total inbreeding. The top 10 ancestors contributing to the inbreeding accounted for 17.45% to 68.35% of the total inbreeding of the animals born in recent years. The effective population size based on the individual inbreeding rate (N e F i ) (±SD) was 17.81±8.45, whereas based on the individual coancestry rate (N e C i ) (±SD) was 41.88±2.56. The number of equivalent subpopulations (±SD) was 2.35±1.13.
Measures of genetic variation and analysis of the probabilities of gene origin, genetic diversity loss for the current (n=914) and contrast (n=453) Andalusian donkey breed population sets under study

Herd relationships and breeding strategy
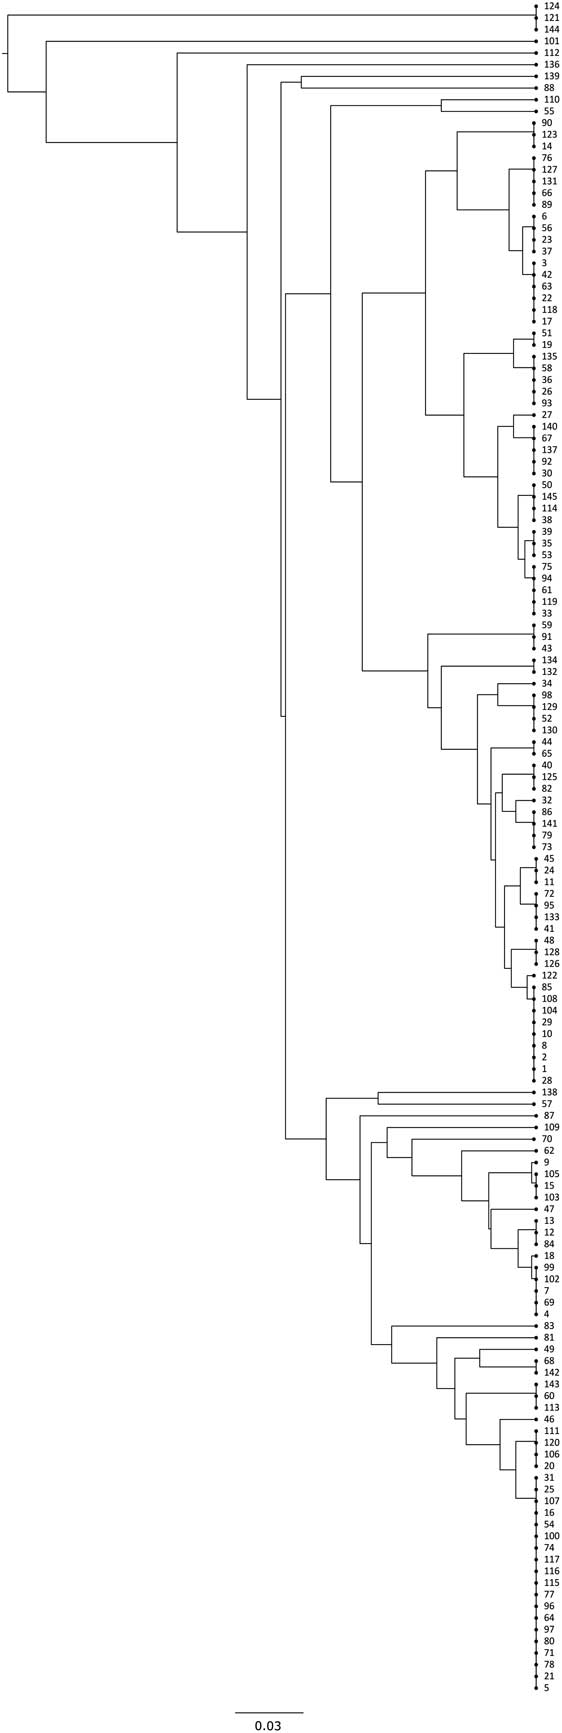
The mean number of donkeys per farm was 4.75 ranging from 1 to 56. A total of 10 585 Nei’s genetic distances were considered. Nei’s average genetic distance between them was 8.29%. Mean coancestry within subpopulations was 8.73% and mean inbreeding 0.66%, whereas the mean coancestry in the metapopulation was 0.44% and the self-coancestry was 50.33%. Studying Wright’s F parameters, the inbreeding coefficient relative to the total population (F IT) was 0.0022 and the inbreeding coefficient relative to the subpopulation was 0.0883 (F IS). The correlation between random gametes drawn from the subpopulation relative to the total population (F ST) was 0.0832. The assessment of the herd structure revealed none of the herds could be considered the population nucleus. The number of farms, which did not use own fathers was almost three times higher than the one of those that did it, and none of the herds was totally isolated. In total, 43 pairs of farms held the greatest Nei’s genetic distance among them (56.25%), whereas the shortest distance among farms was 0.98%. Mean Nei’s minimum distance/average homozygosity was 8.28%. A cladogram is shown in Figure 3, where all the relationships among farms are represented. Descriptive statistics and effective population size for each relationship coefficient level are shown in Table 3.
Cladogram constructed from Nei’s distances among farms/owners of Andalusian donkey breed.

Descriptive statistics for (N e F i ) effective size of the population of the Andalusian donkey breed through the individual inbreeding rate (ΔF i ), considering all possible matings at five different lower than 6% coefficient relatedness levels (R)

Discussion
New-born annual increase, pedigree completeness index, breeding animals, generation interval and mean age of parents at offspring’s birth
The knowledge about the pedigree of the breed has substantially increased in recent years, as a result of the increase in the number of foals whose genealogical information is known, but it is not deep rooted enough yet. Researchers like Gutiérrez et al. (Reference Gutiérrez, Cervantes and Goyache2005) reported a mean number of equivalent generations of 2.5 for the Catalonian donkey; Rizzi et al. (Reference Rizzi, Tullo, Cito, Caroli and Pieragostini2011) reported a slightly higher value (4.17) for Martina Franca donkeys and Quaresma et al. (Reference Quaresma, Martins, Rodrigues, Colaço and Payan-Carreira2014) found that almost 80% of Miranda donkeys had unknown parents. The relatively poor pedigree completeness levels of many donkey breeds, result in the underestimation of inbreeding level trends, as individuals with unknown parents and their offspring are assigned a 0 inbreeding coefficient even if they are somehow related (Lutaaya et al., Reference Lutaaya, Misztal, Bertrand and Mabry1999; Cassell et al., Reference Cassell, Adamec and Pearson2003). Assessing the breeds individually, there was a great difference according to whether population control measures had been already implemented or not. In Amiata donkeys, the greatest number of traced generations was four and the average maximum, complete and equivalent generations were 1.4, 0.53 and 0.78, respectively (Cecchi et al., Reference Cecchi, Ciampolini, Ciani, Matteoli, Mazzanti, Tancredi and Presciuttini2006). Similarly, for the Catalonian donkey and its subpopulations, the number of complete generations ranged from 0.81 to 1.83, whereas the equivalent generations ranged from 1.2 to 2.78 (Gutiérrez et al., Reference Gutiérrez, Cervantes and Goyache2005). This contrasts the Martina Franca donkey, for which the greatest number of traced generations was 11 and the average maximum, complete and equivalent generations were 4.67±2.91, 1.97±1.25 and 3.01±1.83, respectively. Historically, in the first Andalusian donkey generation, the percentage of known ancestors was lower (47.14%) than in the current population (52.08%), evidencing a successful conservation programme. The Andalusian pedigree completeness level in the following generations was lower (1.98%) than in Catalonian (Folch and Jordana, Reference Folch and Jordana1998) or Martina Franca donkeys (Rizzi et al., Reference Rizzi, Tullo, Cito, Caroli and Pieragostini2011), with around 20% of known ancestors in the fifth generation or the Pêga donkey, in which the proportion of know ancestors in the third generation was 43% (Santana and Bignardi, Reference Santana and Bignardi2015).
The generation intervals for the four different pathways were similar and relatively long. A slightly greater mean generation interval was observed between dams and sons (7.93 years) when compared with the mean generation interval between dams and daughters (6.83 years). However, it is worth noting that the greatest value, shown by the dam to son pathway may have probably occurred because of a higher number of jennies whose age at delivery was above the mean, when compared with the same value for jackstocks. The mean age of parents when their offspring was born was slightly greater between dams and sons (8.23 years) than between dams and daughters (7.84 years). These values pointed out the promotion of the breeding use of some donkeys depending on the characteristics sought in particular, as a consequence of the differences in the taste that owners usually show towards the external features that certain donkeys present, which made the use of the animals for breeding also divergent. In Catalonian (Folch and Jordana, Reference Folch and Jordana1998) and Amiata donkeys (Cecchi et al., Reference Cecchi, Ciampolini, Ciani, Matteoli, Mazzanti, Tancredi and Presciuttini2006), the average generation intervals found (6.74 and 6.65 years, respectively) were shorter than in the Martina Franca (8.86 years) (Rizzi et al., Reference Rizzi, Tullo, Cito, Caroli and Pieragostini2011), Miranda (8.18 years) (Quaresma et al., Reference Quaresma, Martins, Rodrigues, Colaço and Payan-Carreira2014) or the Pêga donkey (10.70 years) (Santana and Bignardi, Reference Santana and Bignardi2015). Long generation intervals could be mainly ascribed to the slow turnover rate because the most favoured and popular sires and dams continued contributing with their progeny on subsequent generations for years. Prolonging the generation interval may be useful to increase the number of sires and dams selected for breeding, thereby progressively increasing the effective population size, which is inversely proportional to the rate of inbreeding (Meuwissen, 1999) and therefore, contributing to preserving the genetic diversity of the population. The percentage of females with progeny selected for breeding was less than half the same percentage for males for the historical and the current population sets, but this difference almost disappeared when we considered the contrast population set. Historically breeding jacks were, on average, 2.98 years older than breeding jennies. This difference shortened in the current and contrast population sets, in which it was 2.61 and 2.6 (Table 1), indicating selection has more frequently been applied to jackstocks, as historically, owners have only paid attention to them for the selection of mating couples, erroneously considering jennies a secondary item, hence the higher age of breeding jackstocks and the greater percentage of males with progeny selected for breeding. The jenny/jack ratio inverted in the contrast population, because of a higher number of males with both parents known than females, a sign of the historical lack of attention paid to the genealogy of females. The small age difference between breeding males and females suggested both sexes had the same reproductive life. The jenny/jack ratio was similar for Martina Franca donkeys (1.48/1) (Rizzi et al., Reference Rizzi, Tullo, Cito, Caroli and Pieragostini2011), higher for Pêga donkeys (4.97/1) (Santana and Bignardi, Reference Santana and Bignardi2015) and Miranda donkeys (3.63/1) (Quaresma et al., Reference Quaresma, Martins, Rodrigues, Colaço and Payan-Carreira2014), and slightly higher for Amiata donkeys (2.90/1) (Cecchi et al., Reference Cecchi, Ciampolini, Ciani, Matteoli, Mazzanti, Tancredi and Presciuttini2006).
Inbreeding, coancestry and degree of non-random mating
Inbreeding (F) and (coancestry coefficients) AR were slightly lower in the historical population set than in the current population set, showing an increasing trend over the years. The value of 1.51% for F and of 1.53% for AR in the contrast population showed that the more information about a certain individual was known the greater F was, reaching values over 1%, evidencing a high number of related matings and responding to the appearance of highly inbred animals in the pedigree (Table 2). In clinical genetics, a consanguineous mating is generally defined as a union between two individuals related as second cousins or closer (F⩽0.0156). Beyond second cousins matings (F<0.0156) often arise in small isolated populations. Although remote levels of consanguinity seem not to have a major adverse impact on health, they can result in a notable increase in homozygosity, often sought when defining a breed according to a certain standard; either it is morphological, functional or zootechnical. AR increased through the years, indicating breeders mated more related individuals, especially from 2006 ahead, when the census dramatically decreased and AR was more than twice the value of F. Very small values of mean F and AR (0.0029 and 0.0094, respectively) were reported for Amiata and (0.0008 and 0.0033, respectively) Miranda donkeys, which presented a shallow and incomplete pedigree, whereas in the Pêga donkey (0.0285 and 0.0126, respectively), the PCI made such values more reliable. By contrast, greater F and AR coefficients in Catalonian donkeys (F=0.0336 and AR=0.0376) and in the Berga subpopulation (F=0.072 and AR=0.066) were historically reported. The values found in Martina Franca donkeys must be attributed to the lack of genetic management and matings between only a few related animals and were similar to those reported for the Berga subpopulation (6.87% and 9.80%, respectively), in which contrarily they seemed to result from the attempts to obtain a highly selected morphologically homogenous herd (Folch and Jordana, Reference Folch and Jordana1998; Cecchi et al., Reference Cecchi, Ciampolini, Ciani, Matteoli, Mazzanti, Tancredi and Presciuttini2006; Rizzi et al., Reference Rizzi, Tullo, Cito, Caroli and Pieragostini2011; Quaresma et al., Reference Quaresma, Martins, Rodrigues, Colaço and Payan-Carreira2014; Santana and Bignardi, Reference Santana and Bignardi2015). Andalusian donkeys presented a worse endangerment situation as high inbreeding levels and relatedness coefficients were present in a shallow pedigree in the contrast population, showing an uncontrolled increasing tendency, which could get worse in time if measures were not implemented. Inbreeding was lower than coancestry for the population studied almost through all the years (Figure 1), suggesting that matings were not performed intentionally between close relatives and/or mainly within subpopulations, but still the information on the pedigree was inconsistent. Noteworthily, farms were scattered across a vast territory, which made it difficult to set a proper breeding relation with other genetic resources. These estimates were consistent when compared with the degree of non-random mating obtained. More positive values meant that positive assortative mating patterns were generally being adopted to seek particular phenotypic characteristics, although traditionally, no attention had been paid to this as shown by the trends described by this parameter until 2005, when further selection measures started being implemented to fit the existing population to a standard regarding the height and its emblematic grey coat. The rates of inbreeding per generation and the related Ne reflected the estimates of AR and F. The ΔF found in the contrast population exceeded the recommended maximum ΔF level (1%) and Ne (50) to maintain genetic variation and fitness in a population. By contrast, the values obtained historically were ΔF=0.55% and N e=17.81±8.45, which meant that the greater the number of new animals with reliable genealogical information added to the pedigree, and subsequently the higher the level of completeness were, the greater the presence of inbred animals revealed to be, therefore, evidencing the underestimation of the ΔF values previously obtained. In view of the observed inbreeding and coancestry differences the effective populations sizes based on these two parameters were also different, being N e C i almost twice higher than N e F i . Comparing the effective population size based on inbreeding and coancestry, the number of equivalent subpopulations was slightly lower than 3, indicating that the Andalusian donkey population was highly structured. According to Fernández et al. (Reference Fernández, Meuwissen, Toro and Mäki-Tanila2011), maintaining subdivided populations has the advantage of reducing the risk of extinction because of accidental or health factors as these events would only cause the extinction of a single group. In addition, the maximum long-term genetic diversity of a population is achieved by subdivision into as many separate groups as possible. However, population subdivision can exert a negative effect given each subpopulation will have a smaller effective size and therefore a higher level of inbreeding. The effective population size based on the individual inbreeding rate for Andalusian donkeys (17.81±8.45) was similarly small to the value found for the same in the Pêga donkey (35), but yet it was smaller than for Martina Franca donkeys (Rizzi et al., Reference Rizzi, Tullo, Cito, Caroli and Pieragostini2011). Although population structure greatly affects the individual inbreeding increase, it little affects the coancestry increase, therefore N e C i is more accurate than N e F i to calculate the effective population size (Leroy et al., Reference Leroy, Mary-Huard, Verrier, Danvy, Charvolin and Danchin-Burge2013).
Probabilities of gene origin and ancestral contributions
The ratio between the f e and the f (f e /f) obtained in the historical and contrast population sets was 0.31, suggesting the loss of genetic information from two out of three founders. Given the magnitude of f e and f e /f, it may be assumed that the frequent use of only a few individuals for breeding led to a loss of genetic variability. This was confirmed by the small number of founders contributing to 50% of genetic variability, 96 for the current population set and 20 for the contrast population set. Founder genome equivalents (fg) and the ratio between f a and f e, pointed out the unequal contribution of founders as the main cause for the current loss of genetic diversity. In the Pêga (Santana and Bignardi, Reference Santana and Bignardi2015), Catalonian (Gutiérrez et al., Reference Gutiérrez, Cervantes and Goyache2005), Miranda (Quaresma et al., Reference Quaresma, Martins, Rodrigues, Colaço and Payan-Carreira2014) and Amiata (Cecchi et al., Reference Cecchi, Ciampolini, Ciani, Matteoli, Mazzanti, Tancredi and Presciuttini2006) donkeys, f e value was similar to the value found in the Andalusian donkey (55.62), but higher than that of Martina Franca donkeys (Rizzi et al., Reference Rizzi, Tullo, Cito, Caroli and Pieragostini2011), although the decreased level of pedigree completeness could have caused an overestimation of these parameters. The difference between f e and f a suggested a decrease in the genetic variation because of the several bottlenecks the breed has historically suffered (especially in the 1990s) and was confirmed by the increase in the number of births after the 1990s. The current loss of genetic variation is confirmed by the values of fg (106.06), and the greater decrease in f e (39.01) found in the current population. The values recorded in the contrast population set (70%) and in the current population set (69%), were almost the same indicating the intensive breeding use of certain individuals. The reduced fg in the current population bases on the greater average inbreeding and the smaller number of individuals. Similar bottlenecks were reported in European donkey breeds with a similar degree of genetic diversity loss from the late 1940s to early 1990s, as a result of rural mechanization. The f e /f a ratio (0.81 : 0.93) for Andalusian donkeys compares with the values of 0.89 for Miranda (Quaresma et al., Reference Quaresma, Martins, Rodrigues, Colaço and Payan-Carreira2014) or 0.82 for Martina Franca donkeys (Rizzi et al., Reference Rizzi, Tullo, Cito, Caroli and Pieragostini2011), and contrasts the values of 0.38 for Catalonian (Gutiérrez et al., Reference Gutiérrez, Cervantes and Goyache2005) or 0.37 for Amiata donkeys (Cecchi et al., Reference Cecchi, Ciampolini, Ciani, Matteoli, Mazzanti, Tancredi and Presciuttini2006), possibly addressing for narrower bottlenecks, basing on the misestimation caused because of their low pedigree completeness level, as reported by the difference between f a /f e ratio in the current and contrast Andalusian donkey populations. The 0.92 to 0.94 values for Pêga donkeys (Santana and Bignardi, Reference Santana and Bignardi2015) infer such bottlenecks may not have been so sharp. These results do not only account for founder genotypes misrepresentation and disappearance from local populations, but also highlight a global critical situation affecting the whole species. Bottlenecks neither necessarily lead populations towards extinction, nor free them from becoming extinct even if their effectives are recovered. Bottleneck-based diversity loss is a double-edged sword as deleterious mutations could either be erased and harmless or otherwise, fixed in the population declining them into extinction, as they may produce an increased disease or climate change sensitivity which may remain unnoticed, until it may be too late (Frankham et al., Reference Frankham, Ballou and Briscoe2010).
Herd relationships and breeding strategy
The minimum Nei’s genetic distance, effective population size and F ST statistics evidenced herd based differenced subpopulations, traditionally stemming from the historical interherd breeding trends followed according to which, the origin of the donkeys founding the rest of the herds reduced to three main herds from which the main population founders were distributed, and the latter intraherd breeding policy and tendency to use a few selected animals for breeding, what could resemble the patterns described by other naturally temporarily isolated endangered wild species, such as the Bison (Halbert et al., Reference Halbert, Gogan, Hedrick, Wahl and Derr2012). Breeders should mate animals with relationship coefficients lower than 6%, helping minimize the inbreeding rate and increasing the effective population size, to counteract the risk of extinction.
Conclusions
Genetic diversity loss since the founder generations can be considered small in Andalusian donkeys and similar to breeds with a common unknown genetic background, however, monitoring is always a compulsorily reasonable decision. The typical excessive contribution of few ancestors to the gene pool of small critically endangered populations may lead to narrower bottlenecks in the near future whose hidden effects can only be controlled by tracking the populations. The generation intervals found may be considered an advantage to reduce the inbreeding increase maintaining the existing genetic diversity of donkey breeds. Our major concern falls on the productive sustainability as in situ conservation is clearly affected by a rising international demand, increasing feeding costs and a decrease in governmental subsidies as the main contributors to the loss of discarded or exported individuals, whose genealogical information is no longer considered. Tracking back 36 years of genetic history, the shallow level of pedigree completeness does not permit the reliable estimation of genetic variability parameters. However, the trends described by smaller population sets from which a greater level of genetical information is known, help us quantify the virtual inbreeding decrease, and the underrated distortion of genetic diversity loss describing parameters (f e, f a and f g), enabling the counteraction of potential deleterious effects. Part of founders’ genetic variability has been lost in the course of the years, and especially, the increased percentage of males and females exhibiting high AR values warn that the threat of extinction still looms over the breed. The considerably to slightly low effective population size may balance the inbreeding depression, approaching the estimated minimum viable effective size for the preservation of endangered species (Meuwissen and Woolliams, Reference Meuwissen and Woolliams1994). Although inbreeding rate in the current and historical populations was acceptable (under 1%), its value in the contrast population set alarmingly differs from the recommended value (+0.23%) and indicates that the more genealogical information is known, the more endangered the breed reveals it actually is. In conclusion, careful genetic management is necessary to minimize inbreeding practices and enhance genetic variation. Thus, measures such as the use of artificial insemination or embryo vitrification need to be implemented to contain the inbreeding rate and increase the effective population size, assessing the percentage of relationships that reproductive pairs share in each case and selecting individuals for mating when these relationships are kept below a 6% coancestry level.
Acknowledgment
This work would not have been possible if it had not been for the support and assistance of UGRA (Union of Breeders of the Andalusian Donkey Breed) and the PAIDI AGR 218 research group. Especially we would like to thank the international team composed of Navas B, Arando A, Pizarro MG, Calderón MG, Miranda JC, Avilés D, Miró M, Cumplido A and Gollonet AM.