

Introduction
This article presents preliminary results from a quantitative study of ‘multiple exclusion homelessness’ (MEH) in the UK. The background to this study, and to the MEH research initiative as a whole, was a concern to develop a more sophisticated understanding of ‘deep social exclusion’ (Cabinet Office/Social Exclusion Task Force, 2007; Fitzpatrick, Reference Fitzpatrick2007) in order to promote better responses to people with ‘multiple and complex needs’ (Rosengard et al., Reference Rosengard, Laing, Ridley and Hunter2007). The forms of deep social exclusion with which this research initiative is primarily concerned are those which are thought to interact significantly with homelessness, such as substance misuse, institutional care and ‘street culture’ activities (for example, begging and street drinking). However, to date, the extent and patterns of these intersections has not been known.
This research focus reflects a growing policy awareness that the populations at the sharpest end of these sorts of problems are likely to overlap strongly, meaning that this multiple needs group may be relatively small in overall scale, but costly to society as a whole because of the chaotic lives led by many of those within it (Clinks et al., 2009). There has been a concern that these extremely vulnerable individuals either ‘fall between the gaps’ in policy and services altogether, or else are viewed through a succession of separate and uncoordinated ‘professional lenses’: ‘criminal justice’, ‘substance misuse’, ‘homelessness’ and so on. While in theory ‘care management’ processes should overcome this potential fragmentation, Cornes et al. (Reference Cornes, Joly, Manthorpe, O'Halloran and Smyth2011) report that in reality the picture is somewhat ‘grey’ on how all this fits together, with agencies often working in parallel, each developing their own ‘holistic’ plans, and seeing ‘itself as at the centre’. The MEH research programme sought to avoid replicating this focus on pre-defined ‘client groups’ and organisational priorities, and aimed instead to foreground how the people directly affected defined their own experiences and the most important issues for them.
This more ‘client-centred’ approach, and focus on the most excluded, is evident in the ongoing ‘personalisation’ pilots which aim to develop bespoke support packages for ‘entrenched’ rough sleepers linked strongly with the target to ‘end rough sleeping’ both in England (Department of Communities and Local Government (CLG), 2009) and in London (Mayor of London, 2009), and with parallels to the recent US focus on ‘ending chronic homelessness’ (Culhane and Byrne, Reference Culhane and Byrne2010). However, while homelessness – and in particular rough sleeping − is generally thought to be a key aspect of deep social exclusion (Pleace, Reference Pleace1998; Kennedy and Fitzpatrick, Reference Kennedy and Fitzpatrick2001), it is not entirely clear whether housing-related issues are as central to the problems of those experiencing deep social exclusion as is often supposed. Some would argue that homelessness may in fact have been given undue prominence because of an institutional and political context in which it is often treated more sympathetically than other manifestations of deep exclusion (Philips, Reference Phillips2000). Thus, the precise role of homelessness within broader patterns of deep social exclusion requires critical interrogation.
There has been a great deal of research on homelessness in the UK, but unlike relevant work in the US (Jones and Pleace, Reference Jones and Pleace2010), the majority of UK research is qualitative in nature, with a dearth of robust quantitative studies (Fitzpatrick and Christian, Reference Fitzpatrick and Christian2006). This imbalance has some obvious consequences with respect to the evidence base on homelessness in the UK. While qualitative research is well-suited to providing in-depth, nuanced information about the nature of individual experiences and perceptions, it is not designed to address the sorts of research questions that require quantification and measurement – such as the scale and pattern of particular characteristics, experiences or support needs in the homeless population. Robust statistical studies are also required to test the generalisability of qualitative insights, which are typically based on data derived from purposive rather than representative samples. But there has been no major survey of single homeless peopleFootnote 1 in the UK since a survey in England in 1991 (Anderson et al., Reference Anderson, Kemp and Quilgars1993), albeit that some homelessness providers have carried out surveys of their own service users (most notably a recent large-scale survey conducted by The Salvation Army (Bonner and Luscombe, Reference Bonner and Luscombe2008)). While there is a range of administrative sources of data on single homelessness, these generally provide only very basic data (often on a simple headcount basis), are restricted to those aspects of people's lives of interest to the agencies collecting the data and some of the key sources – such as the CHAIN database on rough sleeping and the street population in London – are limited in geographical scope (Jones and Pleace, Reference Jones and Pleace2010).
Thus the main aim of this quantitative study was to provide a statistically robust and detailed account of the nature and patterns of MEH across the UK. The definition of MEH used was as follows:
People have experienced MEH if they have been ‘homeless’ (including experience of temporary/unsuitable accommodation as well as sleeping rough) and have also experienced one or more of the following additional domains of deep social exclusion – ‘institutional care’ (prison, local authority care, psychiatric hospitals or wards); ‘substance misuse’ (drug problems, alcohol problems, abuse of solvents, glue or gas); or participation in ‘street culture activities’ (begging, street drinking, ‘survival’ shoplifting or sex work).
This article focuses on three research questions addressed by the study. First, what is the degree and nature of overlap between these experiences of deep social exclusion? Second, what is the specific role of homelessness within these broader patterns? Third, does the nature and experience of MEH vary geographically across the UK? The next section of the article outlines the methodology used before key findings on each of these research questions are presented, and some preliminary conclusions are drawn.
Methodology
A key challenge in conducting this research was the absence of a pre-existing sample frame from which to draw a random sample of people experiencing MEH. Thus, a multi-stage research design was adopted in six urban locations where existing dataFootnote 2 suggested people experiencing MEH were concentrated, these being: Belfast, Birmingham, Bristol, Cardiff, Glasgow and Westminster (London). Prior to the main phase fieldwork, a half size ‘dress rehearsal’ pilot was conducted in Leeds in October and November 2009. As no substantive changes were required in research or survey design following this pilot exercise, the Leeds data was incorporated into the main dataset. The main phase fieldwork was conducted between February and May 2010 and comprised the following three stages in each location.
First, with the assistance of local voluntary sector partners, we identified all agencies in these urban locations that offered ‘low threshold’ support services to people experiencing deep social exclusion. We opted to focus on low threshold services (such as street outreach teams, drop in services, day centres, direct access accommodation, soup runs, etc.) as these make relatively few ‘demands’ on service users and might therefore be expected to reach the most excluded groups. We included not only homelessness services in this sample frame, but also low threshold services targeted on other relevant groups, such as people with drug and/or alcohol problems, ex-offenders and people involved in street-based sex work. From this sample frame, six low threshold services were randomly selected to take part in the study in each of the study locations (thirty-six services in total).Footnote 3
The second stage of fieldwork involved a ‘census’ questionnaire survey undertaken with the users of these low threshold services over a two-week ‘time window’. This short paper questionnaire asked fourteen simple yes/no questions to capture experience of the four domains of deep exclusion specified in the MEH definition above: homelessness, institutional care, substance misuse and street culture activities.Footnote 4 While the questionnaire was designed for self-completion, interviewers from the research team and support agency staff were on hand to provide assistance whenever this was required because of literacy problems, limited EnglishFootnote 5 or for any other reason. In total, 1,286 census survey questionnaires were returned, representing a response rate of 52 per cent.Footnote 6
Third, ‘extended interviews’ were conducted with users of low threshold services whose census responses indicated that they had experienced MEH, as defined above, and who consented to be contacted for this next stage of the study.Footnote 7 The structured questionnaire used was designed to generate detailed information on the characteristics, current circumstances and life experiences of these MEH service users. The interviews were conducted face-to-face and lasted forty-six minutes on average. Interpreting services were made available for those whose first language was not English. A £10 voucher was given to every interviewee to thank them for their time. In total, 452 extended interviews were achieved, representing a response rate of 51 per cent.
As this article is concerned primarily with the overall extent and patterns of MEH in the specified urban locations, it uses mainly data from the ‘Census Survey’, that is from the survey of the full population of users of low threshold services. However, as the range of information available from this Census Survey is limited, we also draw where necessary on the more detailed data derived from the ‘Extended Interview Survey’ with service users defined as having experienced MEH. A composite weight has been applied throughout this descriptive analysis to correct for both disproportionate sampling and non-response bias in order to ensure that the survey estimates provided are as robust as possible.Footnote 8 All differences identified are statistically significant at the 95 per cent level of confidence or above. The margins of error on all percentages (‘point estimates’) are within a +/–10 per cent boundary unless otherwise indicated.
The overlap between experiences of deep social exclusion
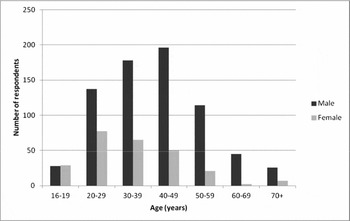
The Census Survey enabled assessment of both the overall prevalence of specific forms of deep social exclusion amongst users of low threshold services, and the overlap between them. It also included data on age and gender, and as we would expect from previous research (Jones and Pleace, Reference Jones and Pleace2010), users of these low threshold services were predominantly male (74 per cent), and were concentrated in the middle age ranges (half of all service users were thirty to forty-nine years old). Again in line with the existing literature, female service users tended to be younger than male users (see Figure 1).
Age of Census Survey respondents, by gender.
Source: Census Survey, 2010. Base: 1,237.

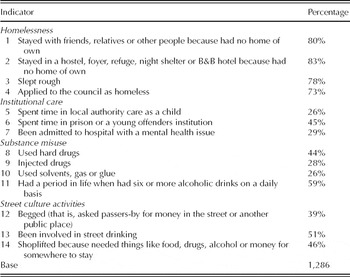
Table 1 details experience of the fourteen specific indicators of deep social exclusion employed to investigate the four general domains of deep exclusion of interest. The first point to note is the very high prevalence of all forms of homelessness amongst these service users: even the most extreme manifestation of homelessness, sleeping rough, was reported by more than three-quarters of all service users. Prison or a young offenders institution was the most common form of institutional care experienced – reported by almost half of all service users – but the figures for being admitted to hospital with a mental health issue and experience of local authority care as a child were also strikingly high as compared with their likely prevalence in the general population. Substance misuse was very widespread, with over half of service users reporting problematic alcohol use, and approaching half reporting use of ‘hard drugs’.Footnote 9 All three specified street culture activities – begging, street drinking and ‘survival shoplifting’ – were likewise reported by very substantial proportions of service users. While comparable data on the wider single homeless population does not currently exist in the UK (see above), this profile of responses is fundamentally different to that found in a major survey of homeless families in England, wherein only very small proportions of the parents in these families reported experience of substance misuse or the criminal justice system (Pleace et al., Reference Pleace, Fitzpatrick, Johnsen, Quilgars and Sanderson2008).
Experience of deep social exclusion

Source: Census Survey, 2010.
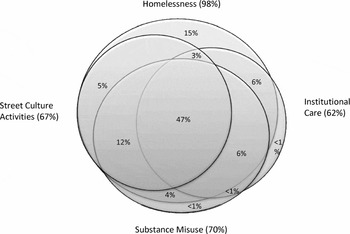
As you would expect given these high prevalence rates for the individual indicators, experience of each of the four domains of deep social exclusion was extremely widespread amongst this population. Almost all low threshold service users (98 per cent) had experienced homelessness, 70 per cent had experienced substance misuse, 67 per cent street culture activities and 62 per cent institutional care (see Figure 2). Consequently, the degree of overlap between these domains was also very high. In fact, as Figure 2 illustrates, almost half (47 per cent) of service users had experienced all four domains of deep exclusion. While 15 per cent of service users had experienced homelessness only, the proportion who had experienced institutional care only or substance misuse only was less than 1 per cent, and no service users had experienced street culture activities only.
Overlaps between domains of deep social exclusion.
Source: Census Survey, 2010. Base: 1,286.

The proportion of service users who were eligible for the extended interview stage of the study, having experienced at least one form of homelessness and at least one other domain of deep exclusion, was 83 per cent. In the next section of the article we consider the specific role of homelessness within these broader patterns of deep exclusion in more detail.
The specific role of homelessness
As the analysis above demonstrates, homelessness was the most common form of exclusion experienced by the users of low threshold services (98 per cent). This pattern will be related in part to the predominance of homelessness agencies amongst those providing low threshold services in urban areas of the UK (82 per cent of all service users were recruited through homelessness services). However, the breadth of our sample frame meant that we were able to conduct separate analysis on the experiences of the 18 per cent of service users who were recruited from non-homelessness services – predominantly, these were drugs services, but also included alcohol services, and services for ex-offenders and those involved in street sex work.
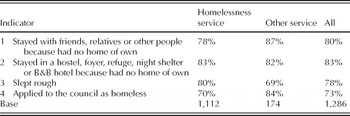
A significant finding of the study thus far is that homelessness was almost as common amongst those sampled from these ‘other services’ as it was amongst those sampled from ‘homelessness services’ (see Table 2). While service users recruited from other services were somewhat less likely to have slept rough than those recruited from homelessness services, they were just as likely to have stayed in a hostel or other temporary accommodation, and were actually more likely to have stayed with friends and relatives because they had no home of their own or to have applied to the council as homeless. This suggests that subgroups within the MEH population have distinctive sets of experiences and ways of managing their housing and other problems, which in turn brings them into contact with different types of services; we will explore these experience ‘clusters’ in future articles.
Experience of homelessness, by type of service

Source: Census Survey, 2010.
It does then appear that homelessness is indeed central to the problems faced by a wide range of people experiencing deep exclusion, and not simply to those who access homelessness-specific services. Overall, only 7 per cent of those recruited from ‘other services’ had never experienced any form of homelessness. Even rough sleeping, the most extreme form of homelessness, was reported by seven in ten users of these other types of low threshold services.
Geographical variation
One of the key objectives underpinning both this quantitative study, and the MEH research initiative as a whole (Fitzpatrick, Reference Fitzpatrick2007), was assessment of the extent to which the characteristics, circumstances and support needs of people experiencing deep social exclusion vary geographically, and investigation of the causes and implications of any such spatial variation.
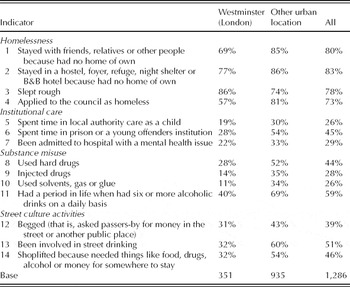
From our initial exploration of geographical variations, it became apparent that by far the most striking pattern was a clear distinction between Westminster and the other six urban locations studied. As Table 3 demonstrates, across most indicators of homelessness and the other domains of deep exclusion, levels of experience were considerably lower in Westminster than elsewhere. Only sleeping rough was more commonly reported in Westminster than in the other locations studied.
Experience of deep social exclusion, by urban location

Source: Census Survey, 2010.
In order to investigate why Westminster appeared so different from the other urban locations (which this preliminary analysis suggested were in many ways quite similar to each other), we turned to the more detailed information provided in the Extended Interview Survey of service users defined as MEH. This revealed that the key explanation was the exceptionally strong representation of ‘migrants’ – defined as all those born outside the UK who migrated to the UK as adults (aged 16 or older) – amongst service users in Westminster. This group comprised 17 per cent of all MEH service users, but 41 per cent of MEH service users in Westminster. In all, 82 per cent of MEH service users who were migrants were located in Westminster. The migrant group included a number of subgroups of particular policy concern, such as: central and eastern European migrants (7 per cent of all MEH service users, 20 per cent of MEH service users in Westminster); former asylum seekers (3 per cent overall, 6 per cent in Westminster); current asylum seekers (1 per cent overall, 2 per cent in Westminster); and illegal migrants (4 per cent overall, 12 per cent in Westminster).
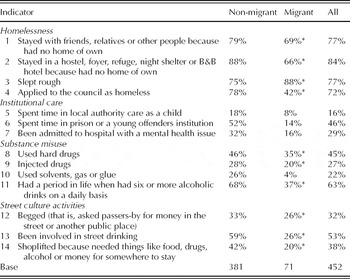
As Table 4 indicates, while migrants were more likely than non-migrants to have slept rough, they were less likely to report experience of most of the other indicators of deep social exclusion, including staying in a hostel or other homeless accommodation, applying to the council as homeless,Footnote 10 spending time in prison, being admitted to hospital with a mental health issue, using solvents, gas or glue, having had an alcohol problem, being involved in street drinking or engaging in ‘survival’ shoplifting.
Experience of deep social exclusion, by migration status

Note: * Margins of error on these point estimates are up to +/–13%.
Source: Extended Interview Survey, 2010.
While, by definition, all MEH service users had experienced homelessness, the proportion of migrants who reported each of the other domains of deep exclusion was considerably less than for non-migrants: 51 per cent of migrants reported substance misuse, as compared with 82 per cent of non-migrants; 51 per cent of migrants had engaged in street culture activities, as compared with 74 per cent of non-migrants; and 32 per cent of migrants reported institutional care experiences, as compared to 72 per cent of non-migrants. Further analysis of the in-depth information provided in the MEH extended interviews confirmed a consistent pattern across a wide range of indicators of extreme exclusion. Notably, conviction of a violent crime, suicide attempts and experience of self-harm were of significantly lower incidence amongst migrants than non-migrants.
Therefore, the main explanation for the key geographical pattern identified thus far appears to be this exceptionally high concentration of migrants in Westminster. Interestingly, however, even once migrants were filtered out of the analysis there remained a pattern of a lower incidence of many indicators of deep exclusion in Westminster, albeit that this geographical pattern was then much weaker and the relevant differences did not always reach statistical significance.Footnote 11 This spatial pattern amongst non-migrants requires further exploration in the next (multivariate) stages of analysis, but may indicate that the particularly difficult structural context in London exposes a broader range of the population to MEH than is the case in other urban locations in the UK.
Concluding comments
This article has presented preliminary results from an ongoing study of MEH in seven urban locations across the UK. Analysis of this rich dataset is ongoing, and will ‘drill down’ into the experience of particular subgroups of interest – such as migrants, young people, women and ex-service personnel – over the coming months. But some important findings are already apparent from this initial descriptive analysis.
It strongly supports the contentions of Clinks et al. (2009) and others about the very high degree of intersection between deeply socially excluded groups and the need to coordinate responses (Cornes et al., Reference Cornes, Joly, Manthorpe, O'Halloran and Smyth2011). While this study explicitly focuses upon those at the sharpest end of homelessness and other social problems, and thus complexity of need is to be expected, the extent to which users of low threshold services had experienced all four of the specified domains of deep exclusion, and had multiple experiences within each domain, indicates an even more extreme concentration of trauma and vulnerability than has hitherto been assumed.
The virtual ubiquity of homelessness experiences amongst those accessing ‘non-homelessness’ low threshold support services indicates that the prominence given to this particular issue in debates and policies targeting deep social exclusion is not misplaced. At the same time, this MEH population appears to constitute a distinctive and exceptionally vulnerable subgroup within the broader homeless population, with data on homeless families, for example, indicating a far lower incidence of experiences associated with chaotic lifestyles and deep social exclusion than that reported here (Pleace et al., Reference Pleace, Fitzpatrick, Johnsen, Quilgars and Sanderson2008).
However, it is crucial to draw a distinction between migrants to the UK who experience MEH and indigenous MEH service users. These preliminary findings indicate that MEH migrants’ problems are far more ‘structural’ (related to welfare, labour market and housing systems) and less ‘individual’ (related to personal vulnerabilities and support needs) than those of indigenous MEH service users (Fitzpatrick, Reference Fitzpatrick2005). While the specific experiences of MEH migrants will be the subject of more detailed analysis at later stages in this study, the position of homeless and destitute migrants is a topic of growing policy concern that merits bespoke research.
One final point to emerge from this initial analysis is just how different the profile of the MEH population ‘looks’ in Westminster (London) as compared with the other six urban locations studied, a finding which was mainly but not fully accounted for by the exceptionally high proportion of migrants in the MEH population in Westminster. This emphasises the importance of avoiding any assumption that data from London is representative of the rough sleeping or deeply excluded populations elsewhere in the UK.
Acknowledgements
The study upon which this article is based was conducted in collaboration with TNS-BMRB and a wide range of voluntary sector partners. Nicholas Pleace, University of York, contributed to the research design and early stages of this study.