I. INTRODUCTION
Neodymium nickelate (NdNiO3) is an interesting transition metal oxide (TMO) belonging to an important family of materials known as strongly correlated materials. Other materials which are strongly correlated TMOs include yttrium barium cuprate (YBa2Cu3O7), bismuth ferrite (BiFeO3), vanadium oxide (VOx), and lanthanum calcium manganese oxide (LaCaMnO), which have been shown to exhibit a wide range of highly desirable properties, namely, high-temperature superconductivity (HTSC),Reference Scheel and Licci1 multiferroic behavior,Reference Catalan and Scott2 and both giant and colossal magnetoresistance.Reference Rata, Kataev, Khomskii and Hibma3–Reference Tiwari and Rajeev5 Because of the similarities to the strongly correlated electronic characteristics between NdNiO3 and these materials, NdNiO3 has likewise been of particular interest. NdNiO3 possesses an orthorhombically distorted perovskite structure. This unique structure dictates the behavior of NdNiO3, specifically in its transport properties. Upon investigating its electrical transport properties, it was discovered that NdNiO3 undergoes a charge-transfer metal-insulator (M-I) transition.Reference Vassiliou, Hornbostel, Ziebarth and Disalvo6, Reference Medarde, Fontaine, Garcia-Munoz, Rodriguez-Carvaial, de Santis, Sacchi, Rossi and Lacorre7 What this M-I transition indicates is that, at high temperatures, NdNiO3 behaves as a metal, with the oxygen 2p band and nickel 3d upper Hubbard band overlapping, as both bands have broadened with temperature.Reference Adler and Brooks8 Upon cooling, the bands experience less broadening, and thus the overlap decreases. At the M-I transition temperature (TM-I), the bands just barely meet and, upon cooling further, the bands are separated by what is known as the charge-transfer gap.Reference Torrance, Lacorre, Nazzal, Ansaldo and Niedermayer9
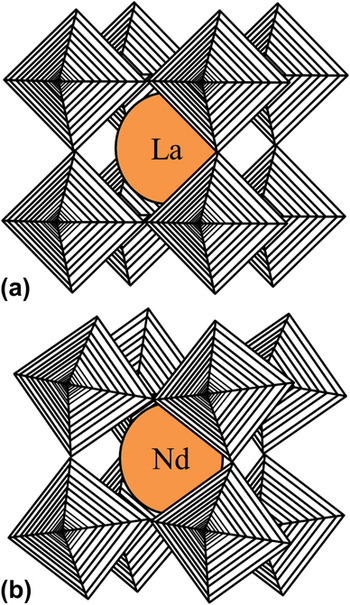
The existence of this M-I transition stems from its orthorhombic perovskite structure. In the case of all perovskites oxides with the general formula ABO3, there are corner-shared BO6 octahedra that link subsequent unit cells. For cubic perovskites, the BO6 octahedra are arranged linearly, with the B–O–B angles all being 180°, as is the case with lanthanum nickelate (LaNiO3)Reference Dobin, Nikolaev, Krivorotov, Wentzcovitch, Dahlberg and Goldman10 [Fig. 1(a)]. For NdNiO3, the NiO6 octahedra are not arranged linearly, but rather the Ni–O–Ni angles are less than 180° [Fig. 1(b)]. As mentioned before, the M-I transition is directly related to the structure of NdNiO3. Specifically, the TM-I is controlled by the rotation of the NiO6 octahedra, as has been illustrated by neutron diffraction experiments.Reference Garcia-Munoz, Rodriguez-Carvajal, Lacorre and Torrance11 Wherever the octahedra have the capacity to rotate more freely, the transition temperature is higher. Thus, decreasing the Ni–O–Ni bond angles will result in an increase in TM-I.Reference Xiang, Asanuma, Yamada, Inoue, Akoh and Sawa12
Structure of: (a) cubic perovskite LaNiO3 and (b) orthorhombic perovskite NdNiO3.

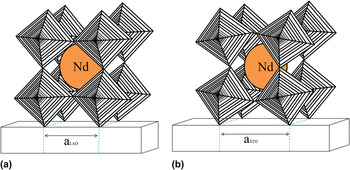
The angle of the Ni–O–Ni bonds can be modified in many different ways. One way is through the application of an external pressure.Reference Medarde, Mesot, Rosenkranz, Lacorre, Marshall, Klotz, Loveday, Hamel, Hull and Radaelli13, Reference Mallik, Sampathkumaran, Alonso and Martinez-Lope14 Granados et al.Reference Granados, Fontcuberta, Obradors, Manosa and Torrance15 quantified this change in TM-I as a function of the external hydrostatic pressure at a rate of dTM-I/dP = −4.8 K/kbar. This shows that, by increasing the external pressure, the TM-I is decreased. A second way for changing the bond angle externally is through modifying the amount of strain in thin films of NdNiO3, typically through substrate alterations.Reference Kaur, Jesudasan and Raychaudhuri16, Reference Kumar, Rajeev, Kushwaha and Budhani17 By growing the film under compressive stress [e.g., on lanthanum aluminate (LaAlO3) (LAO); see Fig. 2(a)], or under tensile stress [on strontium titanate (SrTiO3) (STO) e.g.; see Fig. 2(b)], it is possible to tune the TM-I.Reference Tiwari, Narayan, Jin and Kvit18 As STO has a higher degree of lattice mismatch, the rotation of the octahedra that are directly deposited on the substrate is higher, making the NdNiO3 vary in structure even further from that of cubic perovskites. Tiwari et al.Reference Tiwari, Narayan, Jin and Kvit18 showed that the tensile stressed films have a lower TM-I than films grown compressively.
Schematic illustration of the effect of substrates on epitaxial stress in NdNiO3 films deposited on (a) LaAlO3 and (b) SrTiO3.

There have been limited cases of Hall effect measurements being performed on NdNiO3 thin films in the past. Of these experiments, the tests have all been performed on multilayered devices, over a more limited range of thicknesses.Reference Scherwitzl, Zubko, Lezama, Ono, Morpurgo, Catalan and Triscone19 For gaining a better idea of what is happening to the structure around the TM-I, a thorough examination of the Hall effect and carrier concentration as a function of temperature both above and below the TM-I is critical.
Although previous work has shown many ways to modify the TM-I through bond angle modifications and Hall effect measurements have been performed above the transition temperature in multilayered devices,Reference Scherwitzl, Zubko, Lezama, Ono, Morpurgo, Catalan and Triscone19 there is still a lack of knowledge surrounding NdNiO3. Specifically, through examining a wider range of film thicknesses (0.6–120 nm), quantifying the effects of time dependence over this range of thicknesses, and performing Hall effect measurements, a more complete understanding can be reached. Hence, for gaining a more complete material understanding and quantification of the properties of NdNiO3, in this study we are reporting the electrical transport properties and Hall effect measurements of thin films (0.6–120 nm) of NdNiO3 grown directly on a single crystalline LAO (001) substrate.
II. EXPERIMENT
Thin films of NdNiO3 were grown using a pulsed laser deposition technique. A Lambda Physik Compex Pro KrF excimer laser (λ = 248 nm and pulse width of 25 ns; Lambda Physik USA Inc., Ft. Lauderdale, FL) was used to ablate a dense ceramic target at 10 Hz under 0.3 mbar oxygen. The ablated material was then deposited on a single crystalline LAO (001) substrate, which was heated to 700 °C. The laser energy density was ∼15 J/cm2 and the distance between the target and the substrate was 4.5 cm. Following the deposition, the oxygen pressure was increased to 0.5 mbar and the sample was annealed for 30 min. The deposition rate was determined by masking off the corner of a test deposition and using a Tencor P-10 profilometer (KLA-Tencor, Milpitas, CA) to measure the film thickness. The deposition rate was found to be 0.024 nm per shot, which corresponded to a range of 0.6–120 nm thicknesses upon depositing 25–5000 pulses.
A Phillips X'Pert X-ray Diffractometer (Philips PANalyical Inc., Westborough, MA), which uses Cu Kα radiation, was used to perform x-ray diffraction (XRD) on the samples. Conventional four-probe measurements were performed to examine both the resistance and the Hall measurements of each of the samples. A Keithley 6220 current source and Keithley 181 nanovoltmeter (Keithley Instruments Inc., Cleveland, OH) were used to perform the experiments. Temperature dependence was investigated by observing the resistance over a range of 17–300 K and the Hall effect over a range of 145–225 K. To reach low temperatures, a closed cycle cryostat (CTI cryogenics Model 22, Janis Research Company Inc., Wilmington, MA) was used in conjunction with a Lakeshore Model 325 temperature controller (Lakeshore Cryotronics Inc., Westerville, OH). The temperature was ramped at 10 K/min. Once the samples were fabricated, they were stored for up to 1 wk prior to testing. Subsequent Hall effect measurements were performed at a later time. All of the samples were subjected to the same ambient conditions for the same period of time.
III. RESULTS AND DISCUSSION
A. X-ray diffraction
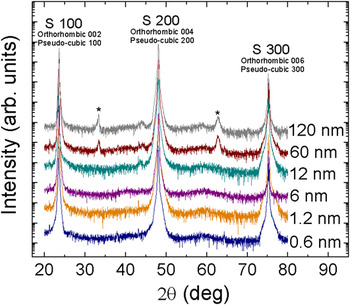
The NdNiO3 thin films were examined using x-ray diffraction, which indicated potential epitaxial growth and showed good crystallinity for the thinnest samples deposited (Fig. 3). The presence of epitaxial growth in NdNiO3 systems has been supported by the work of Liu et al.Reference Liu, Kareev, Gray, Kim, Ryan, Dabrowski, Freeland and Chakhalian20 For the thickest among samples, two additional peaks are present, which indicates a less oriented growth pattern. For all of the films, the low resolution of the x-ray diffractometer and the very close positioning of the NdNiO3 peaks to the LAO peaks made it impossible to distinguish the film peaks from the substrate peaks, with the exception of the additional peaks noted in the thicker films. Specifically, the peaks positioned at 23° and 47° 2θ correspond to the {100} family of planes in LAO as well as either the {100} pseudocubic oriented NdNiO3 peaks or the {002} orthorhombic oriented NdNiO3 peaks.
XRD of NdNiO3 thin films over a range of thicknesses, from 0.6 to 120 nm.

The intermediate peaks, positioned at approximately 32° and 63° 2θ and indicated in Fig. 3, can likewise be attributed to either the orthorhombic and pseudocubic orientations, as the {200} or {110} family of planes, respectively.Reference Catalan, Bowman and Gregg21 Research performed previously indicated a higher probability for the orthorhombic distorted perovskite structure, belonging to the space group Pbnm.Reference Blasco, Castro and Garcia22, Reference Lorenzo, Hodeau, Paolasini, Lefloch, Alonso and Demazeau23 The bulk NdNiO3 lattice constant is 3.818 Å and is 3.790 Å for LAO. This indicates that the NdNiO3 thin films will experience a small compressive strain, as the NdNiO3 film is oriented with its pseudocubic axes parallel to those of LAO.
B. Electrical resistivity as a function of temperature
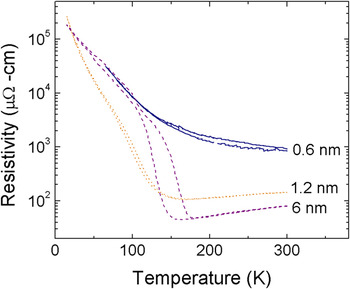
For quantifying as to how the structural changes associated with the M-I transition depend on film thickness, the electrical resistivity of NdNiO3 films was measured as a function of temperature. This was accomplished by measuring the resistivity as the samples were cooled down from room temperature to 17 K and then subsequently returned to room temperature. For each of the samples, there was a difference between the heating and cooling cycle resistivity curves, which was known as the hysteresis of the sample. First, as shown in Fig. 4, resistivity was measured for the three thinnest films, which ranged in thickness from 0.6 to 6 nm. For the 0.6-nm thick sample, insulating behavior was evident over the entire temperature range and there was a minimal amount of hysteresis. This is due to the fact that the 0.6-nm thick film corresponds to a mere two pseudocubic unit cells thick, and thus the lattice of the film is heavily compressively constrained to the lattice of the substrate. Because this restriction limits the amount of rotation that the NiO6 octahedra are able to undergo, the Ni–O–Ni angles are held fixed, at angles much below 180°.Reference Venimadhav, Lekshmi and Hegde24 This tight constriction causes the sample to exhibit behavior similar to that of the substrate, in this case insulating behavior at all temperatures and consequently, no visible M-I transition and little hysteresis.
Resistivity versus temperature for the thinnest NdNiO3 thin films, with thicknesses ranging from 0.6 to 6 nm.

The next sample in terms of increasing order of thicknesses measuring 1.2 nm, displayed a TM-I at approximately 170 K and the resistivity still showed very little hysteresis. Despite only increasing by two unit cells in thickness, the resistivity behavior of this sample is significantly different as compared with that of the 0.6-nm thick sample. This is due to the fact that there is a strong dissipation of strain effects on increasing the film thickness. However, the lattice of the film is still constrained to the lattice of the substrate, which results in a relatively high overall resistivity. Because the film was still very thin, there was still a high degree of distortion in the Ni–O–Ni bond angles, which resulted in a lower transition temperature than was expected. On increasing further to 6 nm, the strain effects dissipated further, causing a lower overall resistivity and a higher transition temperature, as the orthorhombic perovskite structure became less distorted due to its increased thickness.
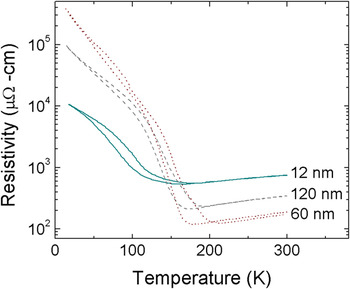
In Fig. 5, the resistivity curves as a function of temperature are shown for the thicker range of films made, 12, 60, and 120 nm. The 12-nm sample shows a unique set of behavior, having the lowest overall resistivity of all of the samples measured. Although the TM-I of the 12-nm sample was similar to that of the 6-nm sample, approximately 160–170 K, the resistivity behavior indicated contradictory mechanisms behind the structural changes associated with the M-I transition. This specified that, at 12 nm, strain is dominated by a second mechanism, namely defect formation. The formation of defects dominates the resistivity behavior, as defect formation relieves the strain in the film. The number of defects is still minimal, however; which results in a minimized resistivity for the12-nm sample.
Resistivity versus temperature for the thickest NdNiO3 thin films, with thicknesses ranging from 12 to 120 nm.

The 60-nm sample repeats the resistivity behavior shown by the 6-nm sample, except the 60-nm sample has a TM-I nearing 200 K. This increase in resistivity as compared with the 12-nm sample is thought to be due to defect clustering. Because the 60-nm sample has more defects than the 12-nm sample, it is possible for the increased concentration of defects to become localized to various points throughout the lattice.Reference Mughrabi25 Clustering results from the NdNiO3 attempting to reach its most energetically favorable state by rearranging the defects to localized centers. However, this rearrangement has a limit. For the120-nm sample, the defects have reached a large enough concentration that rearrangement no longer provides the most favorable distribution. This means that the defects are randomly distributed throughout the sample, similar to the arrangement with the12-nm sample. Due to the increased number of defects as compared with the 12-nm sample, the resistivity of the 120-nm sample was significantly higher.
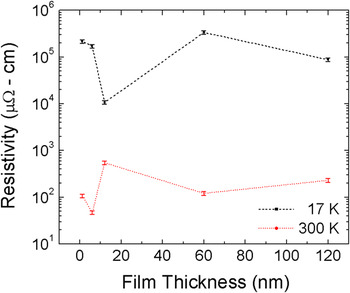
A second examination of the resistivity as a function of temperature was done to reiterate this proposed structure of defects forming as strain effects dissipate. Specifically, the resistivity was plotted as a function of thickness at three different temperatures, room temperature, TM-I, and 17 K. The behavior at TM-I and 300 K was the same, so only the behavior at 300 K is plotted. As can be seen in Fig. 6, the thinnest films at 300 K showed a decrease in resistivity with increasing film thickness. This follows the suspected defect structure as the thicker of the two samples experienced less stress, and thus had a smaller resistivity value. On increasing further to 12 nm, (the 0.6-nm film is not shown, as it never exhibited a M-I transition) the resistivity reached its maximum value. This maximum point was indicative of the formation of defects in the sample. The defects impede the electron motion, and thus the resistivity is significantly increased. Further increasing the thickness resulted in the subsequent clustering of defects that lowered the resistivity by decreasing the overall concentration of scattering centers in the electron path. The thickest film, 120 nm, showed a relative increase in resistivity, as the defects were again prevalent throughout the sample, due to the limit of clustering at such high concentrations of defects.
Resistivity versus thickness at 17 K and TM-I.

Likewise shown in Fig. 6 is the resistivity as a function of thickness at 17 K. Similar to the behavior at 300 K and TM-I, the resistivity decreases on increasing the thickness for the two thinnest samples. This was still due to the dissipation of strain effects, which decreased the overall sample resistivity. However, on increasing further to 12 nm, the resistivity continues to decrease, which is opposite to the behavior noted at 300 K. This is a sign that the material properties are still dominated by strain effects at low temperatures and low defect concentrations. Because the strain is fully relieved due to the presence of defects, the resistivity is minimal. Increasing the thickness, the 60-nm sample showed a peak in the resistivity. This is likely due to the defect clusters resulting in regions of strained material. The thickest film again decreases in resistivity, as the strain effects are minimal for a uniform distribution of defects.
C. Electrical resistivity as a function of time
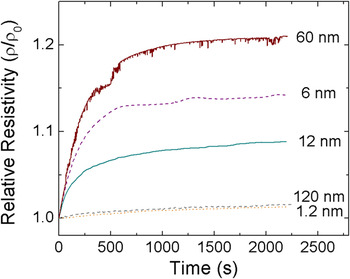
Electrical resistivity was also measured as a function of time. Figure 7 illustrates the time dependence of the resistivity. Time-dependent measurements were performed on both the heating and cooling cycles to gather a more complete understanding of the temperature-dependent structural changes in the material. The cooling cycle time dependence was tested by cooling below the TM-I to approximately 100 K, the point where the maximum hysteresis occurred. Once this temperature was reached, the resistivity of the sample was measured as a function of time, after which the sample was returned to room temperature. The 0.6-nm sample was not included due to the fact that there was no M-I transition observed.
Cooling cycle relative resistivity as a function of time.

For the 1.2-nm sample, there is little change in the resistivity with time, amounting to only about a 1% total change. The 6-nm sample showed a much more significant change, increasing by nearly 14%. Finally, the 12-nm sample showed a moderate alteration in the resistivity, with an increase of almost 9%. The 60- and 120-nm samples showed changes of approximately 21% and 2%, respectively. To understand the mechanism behind these changes, it was critical to examine the behavior during the heating cycle.
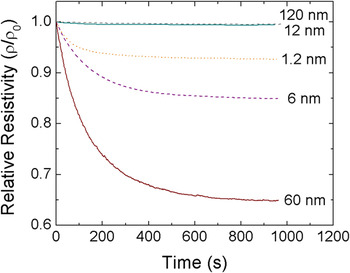
The heating cycle data were taken by cooling the samples to 17 K and then heating the samples to approximately 100 K, at the center of the hysteresis. The resistivity of the samples versus time measurements is shown in Fig. 8. The 1.2-nm thick sample showed a decrease of almost 6%. The 6-nm sample changed by 15%, whereas the 12-nm sample changed by less than 1%. For the thicker films, the change was about 35% for the 60-nm sample and just under 1% for the 120-nm sample.
Heating cycle relative resistivity versus time for the 60 and 12 nm samples.

This behavior can be explained by the low-temperature NdNiO3 material structure. It has been reported that, on cooling below the TM-I, NdNiO3 forms a supercooled metallic phase.Reference Kumar, Rajeev, Alonso and Martinez-Lope26 Observation of this supercooled phase below the transition temperature has shown two different possible outcomes: (i) the phase transitions to a stable insulating phase at low enough temperatures, or (ii) the supercooled phase becomes a kinetically stable glassy phase at very low temperatures.Reference Kumar, Rajeev, Alonso and Martinez-Lope26, Reference Kumar, Rajeev, Alonso and Martinez-Lope27 However, because of the presence of time dependence on both the heating and cooling cycles, only the second option is possible.Reference Kumar, Rajeev, Alonso and Martinez-Lope27
The degree of supercooling and thus the degree of kinetically stable glassy metallic phase depends greatly on the film thickness. The thinnest 1.2-nm sample showed a minimal amount of supercooling, but data indicated almost all of the supercooled phase transitioned to glassy phase. Increasing the film thickness to 6 nm showed similar behavior, except with a higher degree of supercooling and thus a larger amount of glassy phase formation. When defects began to form, the amount of glassy phase that could be formed from supercooling was limited, as was noted in the 12-nm sample. The 60-nm sample exhibited the maximum change in both the heating and cooling cycles, consistent with a maximum amount of supercooling resulting in a maximum degree of kinetically stable glassy phase formation. The final sample, 120 nm thick, showed the smallest degree of change on the cooling cycle with time, indicating an insignificant amount of supercooling and thus a miniscule amount of glassy metallic phase was formed, as the defects present throughout the sample minimized the potential for supercooling.
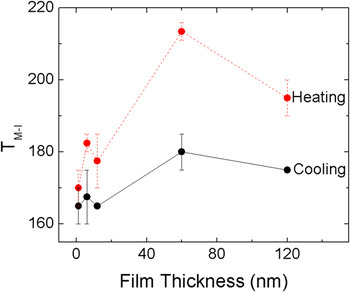
Another way to view these trends is to examine the TM-I as a function of film thickness, as is illustrated in Fig. 9. As can be seen for small thicknesses, the difference between the heating and cooling cycles was a minimum, as indicated by the lack of hysteresis in the initial resistivity vs. temperature measurements. For the 1.2-nm sample, the TM-I was between 160 and 170 K on the cooling cycle, and was between 165 and 175 K on the heating cycle. The 1.2-nm sample had a small degree of supercooling, but almost all, if not all, of the supercooled phase transitioned to glassy metallic phase. Because there was a small degree of supercooling, the difference between TM-I on the cooling and heating cycles was a minimum.
TM-I as a function of film thickness for both the heating and cooling cycles.

For the 6-nm thick film, the TM-I shifted to approximately 167 K on the cooling cycle and 182 K on the heating cycle. As the strain effects dissipated, the Ni–O–Ni bond angle has more freedom of rotation, thus increasing the transition temperature.Reference Zhou, Goodenough, Dabrowski, Klamut and Bukowski28 Further, the 6-nm sample showed a high degree of supercooling and glassy phase formation. This resulted in a significant amount of difference in the cooling and heating TM-I values as compared with the 1.2-nm sample. The 12-nm sample experienced a slight decrease in its TM-I as compared with the 6-nm sample, from between 167 and 182 K to between 165 and 177 K on the cooling and heating cycles, respectively. This is likely due to the presence of defects in the 12-nm sample, which causes the Ni–O–Ni octahedra and thus the film structure to differ from cubic phase enough that the transition temperature was lower relative to the 6-nm sample. Significant supercooling but minimal glassy phase formation caused a decrease in the TM-I on the heating cycle.
For the 60-nm sample, there was a peak in the TM-I, occurring at about 180 K on the cooling cycle and 210 on the heating cycle. This relatively massive difference in the heating and cooling cycle values of the TM-I is a direct result of the fact that the maximum degree of supercooling and glassy phase formation occurs in the 60-nm sample. Upon increasing to 120 nm, the TM-I decreased on both the heating and cooling cycles. This is similar to what was noted with the 12-nm sample, as both the degree of supercooling and glassy phase formation were almost negligible for the 120-nm sample as compared with those of the 60-nm sample.
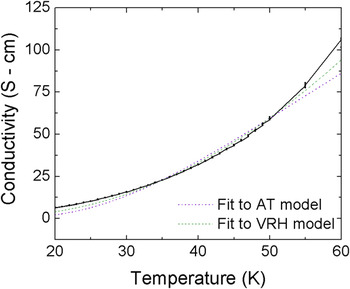
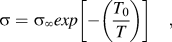
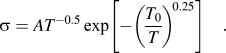
In an attempt to corroborate these claims regarding a mechanism of kinetically stable glassy phase formation rather than stable insulating phase formation on cooling below the TM-I, further comparisons were made to models of pure insulators. These models were compared with the low-temperature behavior of the 1.2-nm sample, as this sample was not riddled with defects, but still exhibited a small time dependence on both the heating and cooling cycles. The electrical conductivity experienced by the 1.2-nm sample was compared with both the equation for activated transport (AT), Eq. (1), and the equation for variable range hopping (VRH), Eq. (2):
 $$\sigma = \sigma _\infty exp\left[ { - \left( {{{T_0 } \over T}} \right)} \right]\quad,$$
 $$\sigma = AT^{ - 0.5} \exp \left[ { - \left( {{{T_0 } \over T}} \right)^{\!0.25} } \right]\quad.$$
In the above equations, A,  $\sigma _\infty$, σ 0, and T 0 are all constants. The other film thicknesses were investigated and yielded similar curves. In Fig. 10, it can be seen that there is significant variation between the two curve fits and the actual data. This supports our hypothesis that, on further cooling of the supercooled metallic phase, a kinetically stable glassy phase is formed rather than a stable insulating phase.
Comparison of the conductivity of the 1.2 nm thick film to the behavior of true insulators.

D. Hall effect measurements
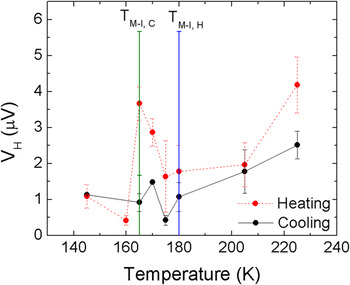
The proposed structure of a supercooled metallic state forming a kinetically stable glassy phase on cooling below the TM-I has been further reinforced by Hall effect measurements. Figure 11 shows the Hall voltage as a function of temperature for both the heating and cooling cycles for the 1.2-nm thick sample. At high temperatures, the Hall voltage is a maximum, but quickly decreases on decreasing the temperature. This low Hall voltage is consistent until the transition temperature is reached. On further cooling, there is a peak in the Hall voltage just below the TM-I. This trend is noted in both the heating and cooling cycles, with the cooling cycle having a larger signal. Cooling to even lower temperatures causes a significant decrease in the Hall voltage, which was negligible below 145 K.
Hall voltage versus temperature for both the heating and cooling cycles.

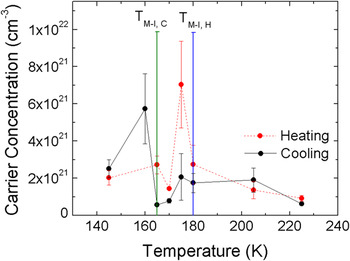
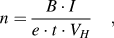
The carrier concentration is shown in Fig. 12 for both the heating and cooling cycles as well. It was calculated from the Eq. (3):
 $$n = {{B \cdot I} \over {e \cdot t \cdot V_H }}\quad,$$
where n is the carrier concentration in m−3, B is the magnetic field in tesla, I is the current in amps, e is the charge of an electron, t is the film thickness and V H is the Hall voltage. Because the carrier concentration is inversely proportional to the Hall voltage, the plot of carrier concentration is opposite to that of Hall voltage.
Carrier concentration versus temperature on both the heating and cooling cycles.

At high temperatures, the carrier concentration is relatively low and increases on decreasing the temperature. This seems counterintuitive as, with decreasing temperature, there is less band overlap, and thus the carrier concentration should decrease. However, the increase is very minimal and, with error bars, is basically negligible. A peak in the carrier concentration occurs just below the TM-I on both the cooling and heating cycles. Decreasing the temperature further meant lower carrier concentrations on both cycles.
Based on the material structure at low temperatures, there is a separation between the two bands. This separation limits the movement, and thus concentration of carriers. As the two bands become closer to one another, the number of carrier should remain limited, increasing slightly with temperature, until the two bands touch, at which there is an increase in the carrier concentration. However, the maximum in carrier concentration occurs below the TM-I in our case. This is due to the fact that the metallic state is supercooled.
Likewise, on the heating cycle, the peak in carrier concentration below the TM-I is indicative of the low-temperature behavior. If the NdNiO3 had transitioned to a stable insulating phase, the peak in carrier concentration would not occur until at or above the TM-I. As this is not the case, the supercooled metallic phase must transition to a kinetically stable metallic glassy phase on cooling to low temperatures.
IV. CONCLUSION
The proposed mechanism of supercooled metallic state transitioning to a kinetically stable glassy metallic phase rather than a stable insulating state has been supported through time-dependent measurements, comparisons with insulating models, and through Hall effect measurements at and below the TM-I. Initial film characterizations included XRD and resistivity versus temperature measurements. These showed that the films were epitaxial, but the two thickest films were not as highly oriented. Resistivity measured as a function of temperature showed that, strain effects dominated below 12 nm and that above 12 nm, defects and subsequent defect clustering limits the material properties. Time dependence measurements of the resistivity introduced the concept of a supercooled metallic phase transitioning to a kinetically stable glassy metallic phase, which was supported by the fact that there was time dependence on both the heating and cooling cycles. Hall effect measurements showed that a peak in the carrier concentration occurred below the TM-I, further supporting the idea that a supercooled phase exists and does not form a stable insulating phase at low temperatures.
ACKNOWLEDGMENT
Financial support from the National Science Foundation (NSF) through Award Nos. DMR-0746486 and DMR-1121252 is thankfully acknowledged.