It is well known that the financial system in postwar Japan was bank-based, and that it was characterized by the “main bank system.”1
Aoki, Sheard, and Patrick, “Main Bank”; and Hoshi and Kashap, Corporate Financing.
However, in prewar Japan, a large part of industrial investment was financed by equity and, correspondingly, large shareholders played a major role in corporate governance.
2 Hoshi and Kashap, Corporate Financing; and Okazaki, Corporate Governance, Mochikabu, and “Role.”
Banks basically were not active in monitoring industrial companies in prewar Japan. In fact, many banks were controlled by the owners of industrial companies.
Banks controlled by industrial companies were called “organ banks” (kikan ginko), and have been regarded as characterizing the prewar Japanese financial system.3
“Kikan ginko” was translated into “organ bank” in Hoshi and Kashyap, Corporate Financing, while it was translated into “institution bank” in Teranishi, “Main Bank.”
According to the literature, a typical organ bank was established to generate funding for the industrial businesses of the bank's founders. Therefore, an organ bank was not managed for its own profitability, but rather for the benefit of the corporate group with which it was affiliated. Consequently, organ banks tended to advance a large amount of loans to a small number of industrial companies connected with the bank's founders.
4 Kato, Honpo Ginkoshi Ron; and Murakami, “Futsu Ginko.”
Furthermore, many researchers have pointed out that organ banks engaged in unsound lending to their related companies without diversifying their portfolios, which damaged the banks' financial positions and destabilized the financial system. This view has become well established in today's literature on Japanese financial history. In addition, some regard the organ bank relationship as a basic cause of the 1927 Showa Financial Crisis.
5 Teranishi, “Fall”; Takahashi and Morigaki, Showa Kin'yu Kyoko; and Yamazaki, Showa Kin'yu Kyoko.
On the other hand, recent literature in the field of banking and finance has made it clear that this kind of bank-firm relationship (“related lending”) can be widely observed in today's developing countries.6
LaPorta, Lopez-Silanes, and Zamarrip, “Related Lending”; and Beim and Calomiris, Emerging Financial Markets.
Furthermore, “insider lending” was also prevalent in the United States in the nineteenth century.
7 Lamoreaux, Insider Lending.
This suggests that the organ bank relationship in prewar Japan was symptomatic of the pattern of financial relationships in underdeveloped financial markets. Investigating the organ bank relationship can contribute not only to understanding Japanese financial history, but also to a broader examination of comparative financial systems and comparative financial history.
8 Allen and Gale, Comparing Financial Systems; Calomiris, U.S. Bank Deregulation; and La Porta, “Legal Determinants.”
An extensive body of literature on the organ bank relationship has been published since the seminal work of Toshihiko Kato.9
Kato, Honpo Ginkoshi Ron; Imuta, “Shohyo”; Sugiyama, “Gomeigaisha Mitsui”; and Ishii, “Hyaku Sanju Ginko.”
However, this research is based on case studies of a small number of banks, and there has been no literature that analyses the organ bank relationship quantitatively. In fact, we do not even have such basic data as how pervasive the close bank-firm relationship was in prewar Japan, for the very good reason that this information is difficult to find. In this article, we use a newly compiled database of directors and auditors of banks and nonbanking companies in 1926 to identify bank-firm relationships through the “interlocking” of directors and auditors. Then, using the interlocking variable, we quantitatively examine the effect of director interlocking on bank performance.
A BRIEF HISTORICAL BACKGROUND
The modern history of the banking industry in Japan started with the National Bank Act in 1872. The national banks were private banks that were granted the privilege of issuing banknotes. After revision of the act in 1876, which suspended the convertibility of national banknotes, the number of national banks grew rapidly to reach 153, the upper limit prescribed by the National Bank Act, in 1879. In 1882 the Bank of Japan (BOJ) was established as the central bank. In 1885 it began to issue bank notes convertible to silver, resulting in a further revision to the National Bank Act, which obliged national banks to convert into ordinary banks within 20 years of establishment.10
Asakura, Shinpen Nihon Kin'yu Shi, pp. 36–37; and Teranishi, Nihon no Keizai Hatten, pp. 35–37.
Enactment of the 1893 Bank Act as the legislative framework for ordinary banks brought about a rapid increase in their number. In 1901 the number of ordinary banks approached the peak of 1890.11
Goto, Kin'yu Tokei, p. 56.
These ordinary banks had the following notable characteristics: Although deposits into ordinary banks grew rapidly, the ratio of banks' equity to deposits remained high until the early twentieth century. In 1901 equity accounted for 36 percent of the total liabilities of ordinary banks.
12 Calculated from the data in Goto, Kin'yu Tokei, pp. 86–87.
Also, at the beginning of the twentieth century, ordinary banks depended heavily on borrowings from the BOJ.
13 Ishii, “Hyaku Sanju Ginko.”
In this sense, ordinary banks differed from the typical modern bank, which is funded by deposits.
The ratio of deposits to total bank liabilities increased in the 1900s. This was primarily due to a change in the BOJ policy. Until 1897 the BOJ was open-handed in lending to private banks, and the banks earned substantial profits from the interest rate spread between borrowings from the BOJ and loans to nonbanking companies. However, in 1897 the BOJ initiated direct lending to nonbanking companies, in order to prevent banks from earning profits from the interest rate spread.14
Bank of Japan. Nihon Ginko Hyakunen Shi, vol. 2, p. 16.
This policy change was aimed at pressuring banks to decrease their borrowings from the BOJ, and to focus on attracting deposits. At the same time, the number of ordinary banks began declining, due to bank failures and mergers.
In the 1910s the First World War had a substantial impact on the banking sector, and on the Japanese economy as a whole. Deposits increased rapidly, due to economic growth and an expansionary monetary policy. Consequently, the average equity-liability ratio of ordinary banks fell below 20 percent. Ordinary banks began resembling typical modern banks, at least in terms of the composition of liabilities. Meanwhile, during the war boom, many ordinary banks advanced large amounts to industrial companies, especially those in the heavy and chemical industries. In many cases, these companies faced difficulties when the war ended and international competition revived, which in turn led to a considerable number of bank loans becoming nonperforming. Because the equity-liabilities ratio of banks had substantially declined during the 1910s, the deterioration of banks' assets seriously damaged their financial positions. This was the fundamental cause of the instability of the financial system in the 1920s.
The bank panic of 1920 saw many banks, particularly smaller ones, close down. In order to secure stability of the financial market, the government initiated an organizational reform of the banking sector in the early 1920s, imposing entry regulations and promoting mergers.15
Goto, Ginko Godo, p. 19; and Okazaki, “Ginkogyo.”
The 1923 Great Earthquake in Tokyo further destabilized the financial market, because the earthquake, many of the assets that had been used as collateral for bank loans, or were expected to generate cash flow to repay the loans, were destroyed or burnt.
In 1926 the government decided to implement fundamental measures to restructure the financial system, and proposed two draft bills designed to dispose of the bad loans. However, the Diet opposed these bills on the grounds that they favored capitalists connected to the government. During the Diet deliberations, the Minister of Finance made a notorious slip of the tongue concerning the closure of certain banks, which triggered the Showa Financial Crisis of 1927. This was the largest financial crisis in Japanese economic history.16
See Hoshi and Kashyap, Corporate Financing, for details.
Forty-five banks closed as a result of runs in 1927. They represented 2.91 percent of all ordinary and savings banks in terms of numbers, and 9.02 percent in terms of value of deposits. Among them were Jugo Bank and the Bank of Taiwan. Jugo Bank was one of the ten largest banks, and the Bank of Taiwan was a special bank that was established for developing the Taiwan area in 1899. The magnitude of the financial crisis can be indicated by the shift of deposits away from banks to the Postal Bureau. In 1927, while the total outstanding deposits of all banks decreased, Postal Bureau deposits increased by 30.1percent.
17 Toyo Keizai Shinposha, Kanketsu Showa Kokusei, p. 365, p. 401.
Several studies have suggested that a basic cause of the crisis was the organ bank relationship.18
Kato, Honpo Ginkoshi; Takahashi and Morigaki, Showa Kinyu Kyoko; and Ishii, “Hyaku Sanju Ginko.”
There had been no effective regulation of either director interlocking or maximum loan exposure to a single customer prior to enactment of the Bank Law in 1928. Hence, nonbanking companies were free to control certain banks for the purposes of raising funds.
19 The Bank Act, enacted in 1893, imposed a regulation that restricted loans and discounts by a bank to a single customer to no more than 10 percent of the bank's capital. However, due to the objections of bankers and industrialists, this regulation was rescinded in 1895 (Patrick, “Japan”).
Comprehensive data on loans by banks and by borrowers are not available, but, the BOJ did record the data of those banks that closed during the Showa Financial Crisis.
With respect to the closed banks, detailed data on the loans are available in the documents of the BOJ.20
Bank of Japan, “Sho Kyugyo.”
Panel
A of
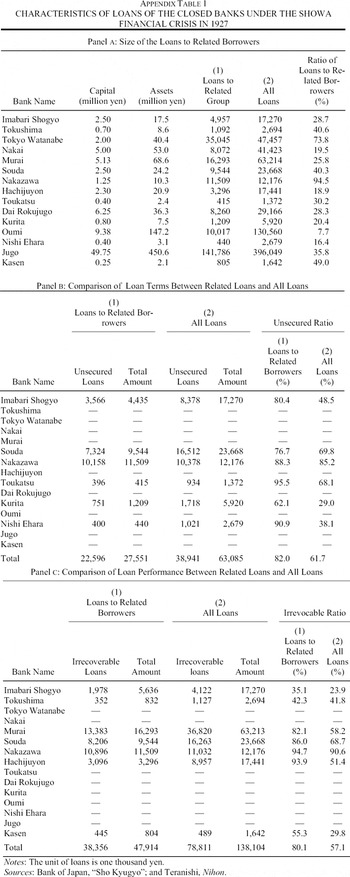
Appendix Table 1 shows that most of the closed banks engaged in lending to related groups that were connected to the banks through shareholding or director interlocking. Panels
B and
C compare the terms and
ex post performances of the related loans and total loans.
21 “All loans minus loans to related borrowers” might not be equal to actual loans to the unrelated borrowers, because we cannot always get the data for loans to all the related borrowers.
There was a larger proportion of unsecured loans among the related loans, and the percentage of irrecoverable loans was higher among related loans than among total loans. Thus, at least with respect to the closed banks, lending to related groups was likely to be based on some degree of corrupt relationship, beyond proper financial judgment.
22 Moreover, we can confirm that 13 of the 15 banks in Appendix Table 1 had director interlocking with nonbanking companies, according to the data of Ginko Kaisha Yoroku.
For a more detailed insight into how and why these banks failed, we looked at two cases, Nakazawa Bank and Murai Bank, from the documents of the BOJ.23
Bank of Japan, “Sho Kyugyo Ginko.”
Nakazawa Bank was established in 1897 by Hikokichi Nakazawa. At the end of 1925 the Nakazawa family still owned more than 90 percent of the bank's shares. When Yoshikazu Nakazawa became the third president of the bank, he was the second largest shareholder. At the same time, he was a director of seven nonbanking companies owned by him and his family.
24 Bank of Japan, “Sho Kyugyo” provided no information on the ownership structure of Nakazawa-related companies. So, we checked the ownership structure of the four related companies whose business reports were available, namely Kinsen Inryo, Sapporo Mokuzai, Taiwan Takushoku and Toshin Gomukogyo. It is confirmed that Yoshikazu Nakazawa was the major shareholder in all four companies.
Over 90 percent of Nakazawa Bank's loans were made to the Nakazawa group (panel
A of
Appendix Table 1). However, in the 1920s the businesses of the Nakazawa group got into trouble, and some group companies failed as a result of speculative investment in stock. Nakazawa Bank had no option but to continue lending money to the Nakazawa group. Finally, as the business situation of the Nakazawa group steadily worsened, Nakazawa Bank was forced to close during the Showa Financial Crisis of 1927.
Murai Bank was established in 1904 by the Murai family. At the end of 1926 Murai Bank was still wholly owned by the Murai family, which also provided all the bank's board members. As in the case of Nakazawa Bank, the Murai family operated several nonbanking businesses, including trading, mining, agriculture, and real estate enterprises. As a result, the loan portfolio of Murai Bank was skewed toward four nonbanking companies owned by the Murai family (panel A of Appendix Table 1). Despite the Murai Group foundering in the 1920s, Murai Bank continued to lend them money. Eventually, Murai Bank was forced to close in 1927, due to a combination of defaults on bad loans to the Murai group and the Great Earthquake.
The government perceived that the organ bank relationship was inimical to a sound banking system. The Bank Law of 1928 compelled ordinary banks to be registered as joint-stock companies, and to be capitalized at not less than one million yen.25
A bank was required to have capital of at least two million yen in Tokyo and Osaka, and at least 500,000 yen in towns and villages with populations of less than 10,000.
According to the Bank Law, existing banks whose capital was currently below the minimum limit (“unqualified banks”) had to meet the capital criterion within seven years. In addition, executive directors and managers of ordinary banks were prohibited from engaging in other businesses without the approval of the Minister of Finance.
26 Bank of Japan, Nihon Ginko Hyakunen, vol. 3, pp. 273–74; and Shiratori, “1920 Nendai.”
INTERLOCKING BETWEEN BANKS AND NONBANKING COMPANIES
In prewar Japan, wealth distribution was far from equal, and there were a number of wealthy individuals who were large shareholders of many companies concurrently.27
Mizoguchi, “Nihon no Shotoku”; and Minami and Ono,“Senzen Nihon.”
Furthermore, in many cases those large shareholders held directorships in the companies in which they invested.
28 Morikawa, Nihon Keieishi; Miyamoto, “Sangyo”; Okazaki, “Corporate Governance”; Okazaki, Mochikabu; and Miyamoto and Abe “Kogyoka.”
The ownership and governance structure of banks was part of this picture. Large investors owned shares and held directorships in banks as well as industrial companies. To put it another way, they created business groups that included banks as well as industrial companies. It is said that, in many of these cases, the banks were not managed for their own profitability but rather for the primary purpose of generating funding for companies within the same group.
29 Bank of Japan, “Sho Kyugyo”; and Takahashi and Morigaki, Showa Kinyu.
In this section, we measure the pervasiveness of close bank-firm relationships among ordinary banks. We approached this task by compiling a comprehensive database of directors and auditors of banks and nonbanking companies in 1926. The data source is the material of Tokyo Koshinjo.30
Tokyo Koshinjo, Ginko Kaisha Youroku, 1926 issue.
Tokyo Koshinjo, one of the largest private credit bureaus in prewar Japan, published a directory of corporate directors,
Ginko Kaisha Youroku, every year from 1897 to 1942. We used the 1926 edition to identify bank-company connections immediately prior to the Showa Financial Crisis of 1927.
From Ginko Kaisha Youroku, we have taken the names of the directors and auditors of each bank and nonbanking firm whose paid-in capital was 200,000 yen or more. Conveniently, this source includes an index by person.31
We identified interlocking between banks and non-banking companies through the following procedure: If, for example, a person who was a director of a given bank was concurrently a director of a particular nonbanking company, we identified that as “one interlock.” If a director of a given bank was simultaneously a director of two nonbanking companies, we classified that as “two interlocks.”
The financial data for each bank are taken from Ginkokyoku Nenpo published by the Ministry of Finance, which covers 1,417 ordinary banks in Japan, excluding colonies, at the end of 1926. Complete financial data are available for 1,398 of the 1,417 banks.32
Ministry of Finance, Ginkokyoku Nenpo, 1926 issue.
The data on directors and auditors are available in
Ginko Kaisha Youroku for 1,007 of the 1,398 banks whose capital was not less than 200,000 yen. Hereinafter, we use these 1,007 banks as our basic sample banks.
33 Tokyo Koshinjo, Ginko Kaisha Youroku, 1926 issue. In the following section, we discuss the possibility of selection bias in our data sampling.
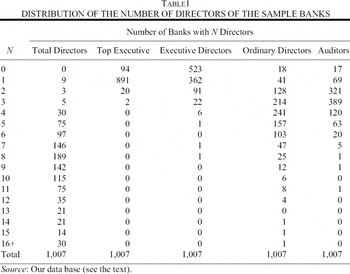
Table 1 shows the distribution of numbers of directors and auditors per bank. The average was around eight (mean = 8.57, median = 8.00). And more than 80 percent of the sample banks had between 5 and 11. Table 1 also shows the distribution, in cases where we classified the positions of the directors and auditors into four categories, namely top executives (president and chairman), executive directors, ordinary directors, and auditors.34
Some companies did not have a president or a chairman. In these cases, we identified the executive director as the top executive.
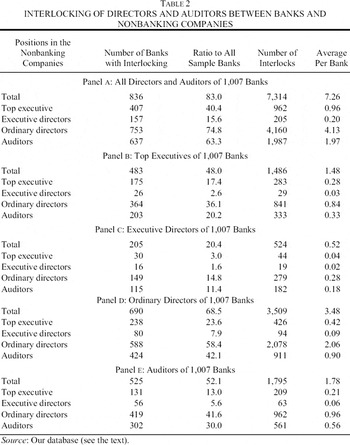
Panel A of Table 2 summarizes the basic findings on director interlocking between banks and nonbanking companies. A total of 836 banks, comprising 83 percent of total observations, had at least one director or auditor who held at least one position of director or auditor in a nonbanking company. The average number of interlocking positions per bank was 7.26. Panel A of Table 2 shows the data broken down by position in the nonbanking companies, classified into four categories, as in Table 1. For example, banks in which at least one director or auditor had the position of top executive of a nonbanking company numbered 407, or 40.4 percent of total observations.
Panels B to E of Table 2 show the data broken down by position with the bank. For 48 percent of total observations, the top executives of the banks held at least one position of director or auditor of a nonbanking company, and the average number of interlocks in which the banks' top executives were involved was 1.48. On the other hand, as shown in Panel D, the percentage of banks in which at least one ordinary director held a position of director or auditor of a nonbanking company was 68.5 percent, and the average number of interlocks of the banks' ordinary directors was 3.48. From these results, we can safely say that most ordinary banks were connected with nonbanking companies through the interlocking of directors and auditors.
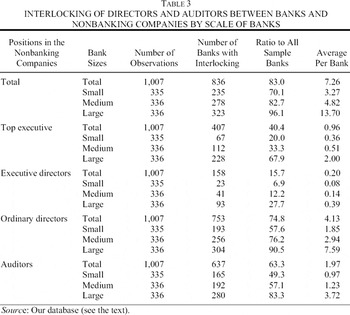
Table 3 is a breakdown of panel A of Table 2 by scale of banks. We split the 1,007 observations into three equal groups in terms of bank assets. We defined smaller banks as banks in the 0–33.3 percentile in terms of asset level, medium-sized banks as banks in the 33.3–66.7 percentile, and large banks as banks in the 66.7–100 percentile. The first point to note is that the interlocking of directors and auditors with nonbanking companies pervaded all three groups. However, in a relative sense, interlocking with nonbanking companies was more pervasive among the large banks. This remains true when we break down the data by positions with nonbanking companies. In all subcategories of the data, both the percentage of banks with interlocking positions and the average number of interlocks were greatest in the large banks.35
Breaking down the data by position in the bank, we confirmed that the situation was almost the same (not reported in table).
The results from our database are striking, and the facts support the conjecture of Kato on the pervasiveness of the organ bank relationship.36
Kato, Honpo Ginkoshi Ron.
More than 80 percent of the ordinary banks were connected to nonbanking companies through the interlocking of directors and auditors.
37 We also checked the extent of director interlocking among nonbanking companies. Although the number of nonbanking companies that had at least one interlocking director with a ordinary bank was 3,113, Tokyo Koshinjo, Ginko Kaisha covered 9,644 nonbanking companies. Therefore, 32.2 percent of nonbanking companies covered in Tokyo Koshijo, Ginko Kaisha had at least one interlocked director with a ordinary bank.
Moreover, the interlocking was more pervasive in the large banks. However, the fact of interlocking does not by itself mean that there was an organ bank relationship in the sense discussed previously. It is necessary to examine in more detail the nature and influence of the interlocking shown by
Tables 2 and
3.
For this purpose, we looked first at the cases of the ten banks with the greatest number of interlocks, namely Yokohama Koshin Bank (88), Bushu Bank (74), Meiji Bank (67), Yokkaichi Bank (67), Mitsui Bank (64), Mitsubishi Bank (60), Shimotsuke Chuo Bank (53), Jugo (49), Yasuda Bank (45), and Joshu Bank (43).38
The numbers in parentheses denote the number of interlocks.
In seven of the ten banks the presidents were one of the ten largest shareholders of these banks. In this sense, management of those banks was not distinct from ownership. Furthermore, in many of the cases where bank presidents directed or audited nonbanking companies, they were also major shareholders of those companies. Therefore, we can say that the interlocking of directors and auditors between banks and nonbanking companies was based primarily on shared common major shareholders.
This also implies that the nature of director interlocking between banks and nonbanking companies in prewar Japan was essentially different from that in the main bank relationship in postwar Japan.39
Because seconded directors usually resign from the bank's board, the director interlocking that we focus on is not observed in the postwar main bank system.
In postwar Japan, the main bank, not its major shareholders, seconds employees as directors of the borrowing companies for the purpose of monitoring their performance. In addition, “contingent governance” is a characteristic of corporate governance under the main bank relationship. Contingent governance means that the governance of a company is contingent on its financial state. If a company runs into financial problems, the main bank initiates management intervention to restructure the bank, by seconding directors.
40 Aoki, Sheard, and Patrick, “Main Bank.”
Hence, under the postwar main bank system, it is the poor financial position of a company that motivates the personal connection with its main bank. The cases of the ten banks under discussion suggest that this causality was not usual in prewar Japan, because director interlocking essentially reflected the common ownership between the banks and nonbanking companies.
INFLUENCE OF GOVERNANCE STRUCTURE ON BANK PERFORMANCE
Interlocking and Bank Profitability
In this section we quantitatively examine the influence of interlocking on bank performance. Because the following analysis in this subsection focuses on bank profitability, and specifically the return on equity (ROE), as a measure for bank performance, we initially considered using a simple model for bank returns. There are many studies on the determinants of bank profitability that propose various models, according to the kinds of problems the authors were analyzing. However, most of the literature considers three factors as important determinants of bank profitability: economies of scale, the level of external competition, and the attitude to risk.
41 Smirlock, “Evidence”; Bouke, “Concentration”; Berger, “Profit-Structure Relationship”; Goddard, Molyneux, and Wilson, European Banking; and Goddard, Molyneux, and Wilson, “Profitability.”
In addition to these three factors, we consider loan quality to be a factor affecting the profitability of a bank, because we cannot assume that loan quality was homogeneous among banks in prewar Japan. Actually, it is the essence of the organ bank hypothesis that the quality of loans of those banks controlled by nonbanking companies was low. Therefore, the baseline model is as follows:
where LQ, COM, RISK, and ES refer to the variables indicating loan quality, level of competition, attitude to risk, and economies of scale, respectively. We now briefly discuss these four variables, and the control variables used in estimation.
LOAN QUALITY (LQ)
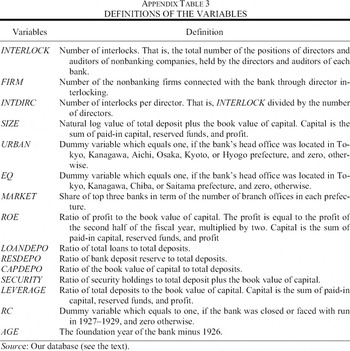
Loan quality (loan performance, rate of recovery of bad loans, etc.) is a factor that directly affects bank profitability. According to the organ bank hypothesis, banks with strong ties to business groups engaged in unsound lending to the related companies. To capture the organ bank relationship, we use the variable, INTERLOCK, which indicates the number of interlocks for each bank, as defined in the previous section. Here, we assume that the larger the INTERLOCK value, the stronger the connection with the related business group. Therefore, if the organ bank hypothesis holds, the effect of INTERLOCK on ROE is negative. In addition, we take into account the effect of the Great Kanto Earthquake of 1923 on loan quality, because many banks in the South Kanto area suffered from bad loan problems as a result of this natural disaster.42
Losses from this earthquake amounted to about 5 billion yen, which was equivalent to about 30 percent of GNP at that time (Hoshi and Kashyap, Corporate Financing).
To capture this effect, we use the earthquake dummy variable,
EQ, which takes the value “one” if the headquarters of the bank was located in the South Kanto area, i.e., Tokyo, Kanagawa, Chiba, or Saitama prefectures. Accordingly, we expect the coefficient of
EQ to be negative.
LEVEL OF COMPETITION (COM)
According to the standard oligopoly theory in the industrial organization literature, banks in highly concentrated markets are able to enjoy higher interest rates charged on loans and lower interest rates paid on deposits. Most studies on the determinants of bank profitability in the United States and Europe focus on the effects of market concentration.43
See Goddard, Molyneux, and Wilson, European Banking, chapter 4, which provides a review of literature on the relationship between market structure and bank performance.
However, it should be noted that in the case of prewar Japan the extent of competition in the banking industry differed by operating region.
44 Imuta, “Nihon”; and Teranishi, Nihon no Keiza Hatten.
Therefore, it is necessary to measure the effects of market concentration by region. In the following analysis, we class a prefecture as a separate market. Then, in order to capture the effect of market concentration, we use the variable,
MARKET, which is the market share of the top three banks, defined as their number of branch offices as a proportion of all bank branch offices in the prefecture.
45 Unfortunately, we could not access information on the individual amounts of loans or deposits by prefecture, with respect to banks operating in multiple prefectures. Even if we replace the share of the top three banks with the share of the top single bank, the effect of market concentration is positive and statistically insignificant, as is the case if we use the share of the top three banks.
The coefficient of
MARKET is expected to be positive.
ATTITUDE TO RISK (RISK)
The attitude of banks to risk has been regarded as an important determinant of bank profitability.46
Bouke, “Concentration”; Berger, “Profit-Structure Relationship”; Goddard, Molyneux, and Wilson, European Banking; and Goddard, Molyneux, and Wilson, “Profitability.”
If the management and shareholders of a bank are strongly risk-averse and maintain a high proportion of safe assets, the bank is unlikely to earn large profits, but is also less likely to be exposed to risk. To capture the effect of asset risk, we include the variable
SECURITY, which is the ratio of security holdings to assets.
47 Imuta,“Taishoki,” confirmed that stocks accounted for only 10.9 percent of total security holdings on average, in respect of 60 banks whose data for 1925 were available.
Here, we assume that securities were relatively safe assets, because they were mainly government bonds and debentures issued by major companies. However, the indications of this coefficient are not clear
a priori, because its value depends on the relative average returns of loans and securities. Indeed, it is quite possible that when overall corporate performance slowed down after the collapse of the wartime boom in 1920, the profitability of a bank holding more safe assets would have been higher than that of a bank holding more risky assets. Actually, Takeo Hoshi confirmed that banks forced to close in 1927 and 1930–1932 had relatively low proportions of security holdings.
48 Hoshi, “Back to the Future.”
It is also necessary to take into account the effect of the capital structure. We use the variable,
LEVERAGE, indicating the financial leverage of a bank, following Modigliani and Miller's Proposition 2, which states that the expected return on equity increases relative to increasing financial leverage.
49 See Brealey and Myers, Principles of Corporate Finance, chapter 17.
ECONOMIES OF SCALE (ES)
Most studies on bank profitability use bank size to capture economies of scale. Because depositors were not protected by a deposit insurance system in prewar Japan, large banks might have benefited from their greater credibility when it came to attracting deposits. To capture the effect of bank size, we use the variable, SIZE, indicating the natural log value of the bank's assets. If a large bank benefited from economies of scale, the coefficient of SIZE would be positive. In sum, the equation to be estimated is as follows:
where ln(INTERLOCK) is the natural log value of INTERLOCK.
50 The natural log value of INTERLOCK plus one is used in the estimation, because INTERLOCK sometimes takes the value zero.
is the error term, and the other variables are as defined above. We estimated equation 2 by the tobit model, as the profit data available from the Ministry of Finance archives were censored at zero.
51 Ministry of Finance, Ginkokyoku Nenpo, 1926 issue.
That is, even when a bank's profitability was negative, we had only the value zero.
In addition to the estimation using full samples, we estimated equation 2 using subsamples grouped by bank size. This is because the functions and performance of banks in prewar Japan differed significantly according to size.52
This structure is sometimes called a multi-layered financial structure. See Kato, Honpo Ginkoshi Ron; Imuta, “Nihon”; and Teranishi, Nihon no Keizai Hatten.
Furthermore, bank size could have been associated with the organ bank relationship. Kazuo Shibagaki stressed that banks affiliated to major zaibatsu (Mitsui, Mitsubishi, Sumitomo, Yasuda), which were the largest banks, had a policy of not making substantial loans to companies within the same zaibatsu group.
53 Shibagaki, Nihon Kin'yu. “Zaibatsu banks” usually refer to Mitsubishi Bank, Mitsui Bank, Sumitomo Bank, and Yasuda Bank. We also found that all of the 19 largest banks with assets of more than one hundred million yen, including zaibatsu banks, had their headquarters in the urban area (Tokyo, Kanagawa, Aichi, Kyoto, Osaka, and Hyogo prefectures).
From the contributions of Toshimitsu Imuta and Kazuo Sugiyama there has come to be a consensus that, apart from certain exceptional periods, the banks of major zaibatsu were not organ banks as defined by Kato.
54 Imuta, “Taishoki”; Sugiyama, “Gomeigaisha”; and Murakami, “Futsu Ginko.” Hoshi, “Back to the Future,” found that the percentage of loans by zaibatsu banks to companies within the same business groups was lower than that of typical organ banks that closed during the Showa Financial Crisis, according to data of Mitsui, Mitsubishi, and Sumitomo Banks covering the period 1921–1943. Imuta, “Taishoki”; Sugiyama, “Gomeigaisha”; and Murakami, “Futsu Ginko.”
In contrast, Juro Teranishi pointed out that small and medium-sized banks in rural areas were closely connected with regional industries, because most were established to fund regional industry.
55 Teranishi, Nihon no Keizai Hatten.
Keishi Shiratori showed that most of the banks that failed in the 1920s due to improper management by the directors were small and medium-sized banks in rural areas.
56 Shiratori, “1920 Nendai.”
Therefore, it is worthwhile to estimate equation 2 separately by bank size. This allows us to check the differences caused by the organ bank relationship, and also by control variables, between large banks and smaller banks. The total 1,007 observations were divided into three percentile subsamples: large, medium and small, as seen in
Table 3.
57 Alternatively, we could have checked the difference in effects of director interlocking by bank size, by adding the interaction term, SIZE * INTERLOCK to equation 2. However, this formulation is more restrictive, because it assumes a linear relationship between the marginal effect of director interlocking on bank profitability and bank size.
Percentile criteria are preferable to criteria based on particular asset levels, in order to avoid arbitrariness.
58 In addition to the subsample analyses by bank size, we also conducted several tests, distinguishing urban areas from rural areas. However, because the differences in the estimated results of subsample analyses by area were not as pronounced as those by bank size, we report only the latter in the table.
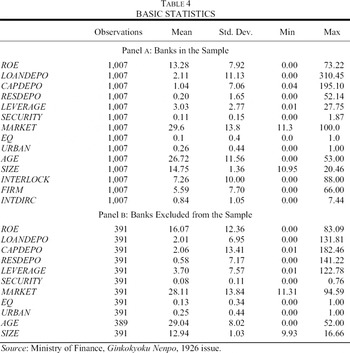
Table 4 presents basic statistics on the banks in our samples (panel A), as well as on the banks excluded from our samples (panel B).59
As for the definition of the variables, see Appendix Table 3.
It is difficult to quantify the sample selection bias precisely, because we have no information on director interlocking among excluded banks, but it is useful to have a comparison between the basic characteristics of our sample banks and those of the excluded banks. As stated previously, the data in
Ginko Kaisha Youroku are basically limited to banks whose paid-in capital was greater than 200,000 yen.
60 Tokyo Koshinjo, Ginko Kaisha Youroku, 1926 issue.
Hence, banks in the samples are much larger in terms of the natural log of assets (
SIZE) than excluded banks. As regards profitability, the excluded banks were more profitable than banks in the samples, especially in terms of
ROE.
61 Here, we regard the value of ROE as zero, if a bank's profit is censored at zero.
Also, the standard deviation of excluded banks is extremely high compared to that of the banks in the samples. This is consistent with the work of Teranishi, who noted that, because smaller banks frequently made unsecured loans or loans based on real estate to their customers, their profit structures tended to be high risk/high return. It should be noted that in the case of left-censored data, the expected value of a sample with high variance is statistically higher than that of a sample with low variance, even if they have the same mean.
62 See Green, Econometric Analysis, chapter 20. It is shown that the expected value of a left (right) censored variable increases (decreases) with its variance.
Therefore, we cannot rule out the possibility that the higher
ROE of excluded banks is due to left censoring, given that the variance in
ROE of the excluded banks is higher than that of the banks in the samples. For most of the other variables, we cannot statistically reject the null hypothesis that the banks in the samples equal the excluded banks.
63 We conducted both a t-test and a Wilcoxon rank sum test. In both tests, SECURITY is statistically not equal between banks in the samples and excluded banks.
In sum, at least there is no strong evidence that our sample selection is prebiased in order to lend weight to the organ bank hypothesis.
64 We estimated equation 2 by sample selection model, where the selection equation included SIZE, SECURITY, and area dummies. Then, it was confirmed that the results were fairly similar to those of the baseline analysis (Table 5).
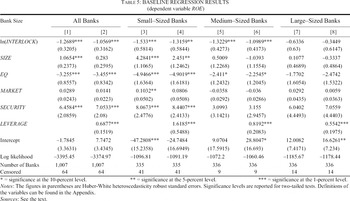
Table 5 presents the estimation results of equation 2. Columns 1 and 2 report the results for the full samples. It can be confirmed from column 1 that the coefficient of ln(INTERLOCK) is negative and statistically significant, indicating that director interlocking between banks and nonbanking companies had a negative effect on bank profitability. The positive coefficient of SIZE implies the economies of scale. As we expected, the earthquake dummy (EQ) had a negative effect on bank profitability. The effect of market concentration (MARKET) is positive, as standard oligopoly theory predicts, but its statistical significance is not high. Finally, banks that ranked higher on proportion of security holdings were more profitable. One interpretation is that this reflects the low return on loans due to the poor performance of industrial companies during the long depression that followed World War I.
In column 2 we include the variable of LEVERAGE. The coefficient of ln(INTERLOCK) still showed a strong negative effect on bank profitability. Consistent with Modigliani and Miller's Proposition 2, the coefficient of LEVERAGE is positive. Alternatively, this positive effect could be explained by differences in individual funding costs of deposits, given that high financial leverage reflects strong ability to attract deposits. Actually, it is noted that banks that were less able to attract deposits offered higher interest rates on deposits, in order to prevent an outflow of their existing deposits.65
Teranishi, Nihon no Keizai Hatten.
On the other hand, the positive effect of bank size is no longer significant. This may be because
LEVERAGE is highly correlated with
SIZE (
ρ = 0.49). Hence, it is likely that
LEVERAGE partially absorbs the effect of bank size. As for other variables, the estimated results are qualitatively the same as those of column 1.
These results support the organ bank hypothesis. From the coefficient of ln(INTERLOCK) in column 2 and the average number of interlocks in Table 3, we can calculate that director interlocking lowered the ROE of a bank by 1.66 percent on average.66
It is calculated from the difference of the predicted values when the value of INTERLOCK is changed from zero to the mean, evaluated at the means of the other variables.
Interlocked directors tended to make a bank lend to the related firms beyond proper financial judgment, as in the cases we saw in the previous section, and consequently lowered a bank's profitability.
67 We conducted a multivariate outlier test (Hadi, “Identifying”), and identified 22 outliers. After eliminating these outliers, the estimated results indicated that the negative effect of INTERLOCK was slightly attenuated, but still statistically significant at the 5-percent or 1-percent levels, whereas the effects of other variables were not substantially changed.
Now we discuss the estimated results for three subsamples, grouped by bank size. The results for smaller banks (0–33.3 percentile), medium-sized banks (33.3–66.7 percentile), and large banks (66.7–100 percentile) are reported in Columns 3–4, 5–6, and 7–8, respectively. The coefficient of ln(INTERLOCK) is negative and statistically significant for smaller and medium-sized banks. On the other hand, director interlocking had no significant effect on large banks. Furthermore, the magnitude of the effect is substantially greater for the smaller and medium-sized banks than for the large banks. These results indicate that the unfavorable nature of director interlocking with nonbanking companies was specific to medium-sized and smaller banks.68
Alternatively, we can add the interaction term of INTERLOCK and SIZE in equation 2, in order to examine the relationship between the effect of director interlocking and bank size. If, as bank size increased, the negative effect of director interlocking were attenuated, the coefficient of the interaction term should be positive. The estimated results indicate that the coefficient of INTERLOCK * SIZE was positive in all specifications, but statistically insignificant in some cases. Therefore, it is likely that bank size had some relationship to the nature of director interlocking, but the continuous relationship is not robust. Furthermore, we re-estimated equation 2, adding the square of INTERLOCK to account for potential nonmonotonicity. We found that the relation between ROE and INTERLOCK was U-shaped (decreasing for low values of INTERLOCK and increasing for relatively high values of INTERLOCK). However, this relationship disappeared when we added the interaction term, INTERLOCK * SIZE.
Finally, we address some potential problems with these results to check their robustness. First, it is possible that nonbanking companies might have seconded directors and auditors to poor-performing banks in an attempt to rescue and restructure them.69
In other words, director interlocking might be endogenous. Taking this possibility into account, we conducted two stage estimation of equation 2. See the Appendix.
However, none of the many case studies of organ banks report that nonbanking companies seconded directors and auditors to banks in order to rescue them. The Bank of Japan reports the histories, from establishment to bankruptcy, of the 20 banks that closed during the Showa Financial Crisis.
70 Bank of Japan, “Sho Kyugyo.”
Twelve of the 20 banks failed due more or less to unsound loans related to their directors, and that in none of these 12 cases had the related nonbanking companies seconded directors to those banks when their performance changed for the worse.
71 Shibuya, “Ginko Jiko,” investigated the causes of 213 bank failures in the period 1910–1915, using Ginko Jiko Shirabe (Investigation into Bank Accidents) by the Ministry of Finance. According to Shibuya,“Ginko Jiko,” one fourth of those bank failures were related to unsound activities by the directors of the banks.
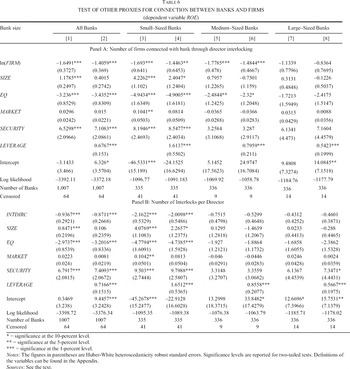
Second, it is useful to check the results using alternative measures of director interlocking. In the previous analyses, we used the number of director interlocks (INTERLOCK), i.e., the total number of director or auditor positions held in nonbanking companies by the directors and auditors of each bank, as a proxy of the strength of connection between banks and companies. Here, we consider two other proxies. The first candidate is the number of nonbanking companies related to each bank via director interlocking (FIRM). The second candidate is the number of interlocks per director (INTDIRC), which means that we normalized the number of interlocks by the total number of directors.72
We also ran regressions using the number of interlocks normalized by bank assets and the natural log of bank assets, and confirmed that the effects of these two variables were still negative and statistically significant at the 5-percent level or the 1-percent level.
reports the estimated results of equation 2 using these two other proxies in place of ln(
INTERLOCK). Panel A reports the results of estimation when we replaced ln(
INTERLOCK) by the natural log of
FIRM (ln(
FIRM)).
73 In estimation, we used ln(FIRM + 1).
It shows that the results are qualitatively the same as those for the baseline regressions.
74 We also estimated equation 2, substituting ROA (the ratio of profit to total deposit plus the book value of capital) and the loan deposit ratio for ROE. ln(INTERLOCK) had a negative effect on ROA and a positive effect on loan-deposit ratios.
Interlocking and Bank Closure
Next, we focus on evaluation of banks in the financial market. As stock price data are available for only a small number of banks, we use the data on bank runs and closures, which were analyzed by Shiro Yabushita and Atsushi Inoue.
75 Yabushita and Inoue, “Stability.”
They proposed a simple model in which the probability of closure principally increased with a fall in the net liquidity position of a bank. Using this model, they investigated the relationship between individual banks' financial positions and the probability of closure during the Showa Financial Crisis. They confirmed the fundamental bank-runs view that the poor performance of bank portfolios increased the probability of closure due to bank runs.
76 Gorton, “Bank Suspension.” During the Showa Financial Crisis, two waves of bank runs occurred. Korenaga, Nagase, and Teranishi. “1927 nen,” found that bank runs in the first wave were information-based but that the second was triggered by self-fulfilling beliefs of depositors, using the data of deposit growth. However, with respect to bank closures, they could not provide evidence of self-fulfilling bank runs.
Based on their model, we estimate the cumulative distribution function
F of the probability of bank runs by the LOGIT model.
77 We also conducted ordered LOGIT regressions, considering the possibility that a closure was worse than a run. The result was similar to that in Table 7.
The dependent variable, RC, is a dummy variable, which equals one if the bank was closed or faced with a run in the period 1927–1929, or zero otherwise.
78 Unlike Yabushita and Inoue, “Stability,” we focused not only on bank closures during the Showa Financial Crisis in 1927, but also on bank closures and runs in ordinary years (1928 and 1929), in order to obtain a broad perspective on evaluation of the financial market.
The information on bank closures and runs was from various issues of
Ginko Jiko Geppo (Monthly Report on Bank Issues) by the Bank of Japan.
79 Bank of Japan. “Ginko Jiko Geppo.”
CAPDEPO is defined as the book value of capital divided by total deposits. A high value for this ratio means that the ratio of liability exposed to withdrawal by depositors is low. Hence, we expect that CAPDEPO would have negative effects on the probability of a run or closure. RESDEPO and LOANDEPO are defined as bank deposit reserves, and total loans divided by total deposits, respectively. These two ratios are directly related to the liquidity position of a bank. If a bank has sufficient bank deposit reserves, it is unlikely to be faced with a run or closure, because it can accommodate withdrawal demands by depositors. On the other hand, because it is not easy to liquidate bank loans immediately, a bank with a high LOANDEPO is likely to be exposed to a run or closure even in the event of minor liquidity shocks.
The other independent variables retain their earlier definitions. A bank with a high value of ROE is unlikely to be exposed to a run or closure. SIZE and EQ are included to control the credit risk factor, which could increase a bank's probability of a run or closure. The larger the bank, the more likely it is to diversify its loan portfolio or be able to withstand certain negative shocks. Therefore, large banks are generally considered to have low credit risk, compared to smaller banks. As for EQ, banks operating in the area damaged by the Great Kanto Earthquake in 1923 were expected to suffer from bad loan problems. Hence, such banks were considered to have high credit risk. In sum, we predicted that the coefficient of SIZE would be negative and that of EQ would be positive.80
Yabushita and Inoue, “Stability,” used the Tokyo area dummy instead of EQ. However, the Tokyo area dummy was positive but statistically insignificant in cases where we substitute it for EQ.
Finally, ln(
INTERLOCK) was included to test the organ bank hypothesis. If the market perceived director interlocking between a bank and companies as unfavorable, the coefficient of ln(
INTERLOCK) would be positive.
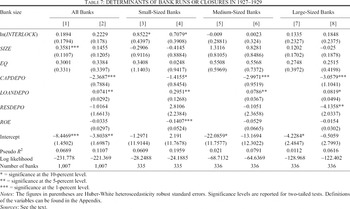
Table 7 reports the results of the logit estimation. Columns 1 and 2 are the results for all banks. In column 1, the coefficient of ln(INTERLOCK) is positive but not significant. Furthermore, column 2 shows that this coefficient is positive but statistically insignificant, after we adjust for the four financial ratios. Therefore, in respect of all banks, we could not obtain strong evidence that the market negatively assessed the connection of banks with nonbanking companies. As for other control variables, whereas the coefficient of SIZE is positive in column 1, this positive effect disappears after adjusting for financial ratios (column 2). EQ shows no significant effect. On the other hand, the indications of all the coefficients of the financial ratios were as expected, and the coefficients of CAPDEPO and LOANDEPO were statistically significant. These results imply that, basically, the financial position of a bank better explains the probability of closure or a run than other factors, which is consistent with Yabushita and Inoue's work81
Yabushita and Inoue, “Stability.”
Columns 3 and 4 report the results for smaller banks. In column 3, it is confirmed that the coefficient of ln(INTERLOCK) is positive and statistically significant. Also, the magnitude is much greater compared with that of column 1. In column 4, the positive effect of ln(INTERLOCK) is still significant after adjusting for financial ratios. These results indicate that, for smaller banks, director interlocking was evaluated as negative information by the market, in addition to poor financial position. On the other hand, it is confirmed in columns 5–8 that director interlocking had no effect on the probability of closure or a run for medium-sized and large banks. In sum, the finding that the effects of director interlocking were harmful to smaller banks but not to larger banks, is still robust, even if we use probability of closure or a run as a performance measure.
CONCLUDING REMARKS
More than 40 years ago, Kato proposed the organ bank hypothesis: that in prewar Japan many banks controlled by industrial companies through capital and personal relationships, engaged in unsound lending to their related companies, which damaged the banks' financial positions, and consequently destabilized the financial system.82
Kato, Honpo Ginkoshi Ron.
This view has become one of the fundamental hypotheses on Japanese financial history, but has not been examined quantitatively.
In this article, we examined the organ bank hypothesis, using the data on director interlocking between banks and nonbanking companies. We found that more than 80 percent of ordinary banks had at least one director or auditor who was also a director or auditor of a nonbanking company. Also, through regression analyses, we confirmed that director interlocking had negative effects on bank performance, and that these effects were serious, especially for smaller banks. Our findings support the organ bank hypothesis.
As stated in the first section, the organ bank relationship can be regarded as a case of related lending suffered from “looting,” which is widely observed in present-day developing countries.83
LaPorta, Lopez-Silanes, and Zamarrip, “Related Lending.”
This perception leads us to an interesting future research topic. That is the fate of the organ bank relationship in the process of economic and financial development. Did the organ bank relationship disappear after the 1920s? If so, how did that come about? One hypothesis we have in mind is a “natural selection” hypothesis.
84 Given that the organ bank relationship compromised the soundness of bank loans, we can expect that organ banks would be more likely to be forced out of the market than other banks. In other words, if the mechanism of selection by market forces was effective, surviving banks would be expected to demonstrate fewer characteristics of organ banks. Because there were many banks in prewar Japan, this is a good opportunity to examine whether such “natural selection” actually worked, which would have a substantial implication to understand the evolution of institutions. At the same time, if the natural selection did not work effectively, it might imply that some government regulation on related lending is needed in present developing countries. These issues remain to be addressed by future studies.
Appendix: Two Stage Estimation of Equation 2
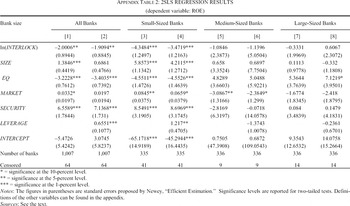
In order to deal with the potential endogeneity, we estimated equation 2 using a two-stage least squares method, using the age of a bank and the prefecture dummies as instrumental variables for INTERLOCK. The basic idea is that because an organ bank was, by definition, established to fund related nonbanking companies, arguably an organ bank in its early stages would have been firmly controlled by its founders, who were bank directors. Then, as the banks matured, the influence of the founders generally would be attenuated, as compared with the early stage situation.85
Morikawa, Nihon Keieishi, defined a professional manager as a manager who was not a major shareholder of the company where he worked, but was expected to play only a management role, and investigated the ratio of professional managers among the board members, in respect of large companies, including banks, in 1905, 1912, and 1930. According to his calculations, the number of professional managers gradually increased during this period.
Hence, bank age was expected to have a negative effect on
INTERLOCK. For prefecture dummies, we considered that director interlocking between banks and nonbanking companies was affected to a greater or lesser extent by the structures of individual regional economies.
86 According to Shiratori, “1920 Nendai,” the reason for the Bank Law of 1927 not completely prohibiting director interlocking between banks and companies was that the government took account of the situation in some rural areas, where it was unavoidable that some powerful and reputable persons held directorships in banks as well as in nonbanking companies.
In the first stage,
INTERLOCK was regressed on bank age, prefecture dummies, and other exogenous variables by OLS. The coefficient of bank age was negative and statistically significant. In the second stage, we estimated equation 2, using the results of the first stage regression.
87 In the second stage estimation of tobit model, we use the asymptotically efficient estimator proposed by Newey, “Efficient Estimation.”
reports the results of the second stage regressions. For all banks (columns 1 and 2), the coefficients of ln(
INTERLOCK) are still negative and statistically significant. Also, the effect of interlocking was particularly negative for smaller banks.
This article is a revised version of Okazaki and Yokoyama, “Measuring.” Research supports from the Asian Development Bank Institute (ADBI), Research Institute of Economy Industry and Trade (RIETI) and Ministry of Education and Science are gratefully acknowledged. Juro Teranishi and Takafumi Korenaga kindly provided us with the data set they constructed from Ministry of Finance, Ginkokyoku Nenpo, 1926 issue. We would like to thank Masahiko Aoki, Patrick Fridenson, Hiroshi Fujiki, Yukiko Fukagawa, Avner Greif, Yasushi Hamao, Takeo Hoshi, Kazuto Ikeo, Satoru Kano, Anil Kashyap, Makoto Kasuya, Yukinobu Kitamura, Matao Miyamoto, Kunio Okina, Makoto Saito, Masanori Sato, Yuri Sato, Ulrike Shaede, Masato Shizume, Akira Suehiro, Masayuki Tanimoto, Meredith Woo-Cumings, Tsutomu Watanabe, Gavin Wright, Masaru Yoshitomi, and other participants in the seminars at ADBI, RIETI, Stanford University, UC San Diego, Ecole des Hautes Etudes en Sciences Sociales, The University of Tokyo, the Bank of Japan, the Financial Services Agency, NBER Japan Project Meeting, the Meeting of the Socio-Economic History Society, and the Meeting of the Japan Society of Monetary Economics, for their helpful comments and suggestions. Comments and suggestions of the editor of this JOURNAL and anonymous referees were very helpful. All errors are the authors' responsibility.