





1 Introduction
Shock-wave/turbulent boundary-layer interactions (SWBLI) occur in a wide range of practical flow devices, such as supersonic air intakes, turbomachine cascades, overexpanded nozzles and high-speed aerodynamic applications in general, and are often critical for the system performance. Although SWBLI have been an active research field for more than 60 years (Dolling Reference Dolling2001), there are still many open questions, in particular regarding unsteady effects of interactions where the adverse pressure gradient imposed by the shock leads to boundary-layer separation. Such interactions form a complex dynamical system with a broad range of temporal and spatial scales. Unsteady pressure and friction forces may couple to resonant frequencies of the structure and may result in failure due to fatigue (Dolling Reference Dolling2001; Délery & Dussauge Reference Délery and Dussauge2009). Of particular interest is the low-frequency unsteadiness of the reflected shock observed in SWBLI with mean boundary-layer separation. This phenomenon occurs at frequencies typically one to two orders of magnitude lower than the characteristic frequency of the integral scales within the incoming turbulent boundary layer
 $U_{0}/\unicode[STIX]{x1D6FF}_{0}$
, where
 $U_{0}$
is the free stream velocity and
 $\unicode[STIX]{x1D6FF}_{0}$
the upstream
 $99\,\%$
velocity-based boundary-layer thickness. While experiments and numerical investigations for canonical SWBLI (e.g. compression ramp, impinging oblique shock, blunt fin, forward-facing step) unanimously confirm the existence of broadband low-frequency shock motions, the precise mechanism that explains the separation in time scales remains unknown. Since the first high-frequency measurements by Kistler (Reference Kistler1964), the mechanism responsible for low-frequency large-scale shock oscillations has been the main research focus with the outcome of theories typically categorised as upstream or downstream mechanisms (see also the recent review paper by Clemens & Narayanaswamy (Reference Clemens and Narayanaswamy2014) for a summary).
Upstream mechanisms link the source of unsteadiness to flow phenomena or events in the upstream turbulent boundary layer (TBL). Experimentally, Andreopoulos & Muck (Reference Andreopoulos and Muck1987) were among the first to find a direct correlation between bursting events of the incoming TBL and shock motions for their Mach
 $3$
compression ramp flow. Similarly, Erengil & Dolling (Reference Erengil and Dolling1993) observed a direct response of the reflected shock to upstream pressure fluctuations, which however results in a high-frequency smaller-scale jitter motion that could not explain the large-scale low-frequency oscillations. Adams (Reference Adams2000) performed a direct numerical simulation (DNS) of a Mach
 $3$
compression ramp flow and found the bursting frequency being very close to the shock-crossing frequency, supporting the earlier experimental findings of Andreopoulos & Muck (Reference Andreopoulos and Muck1987). Ünalmis & Dolling (Reference Ünalmis and Dolling1994) proposed that a low-frequency thickening/thinning of the upstream TBL causes an upstream/downstream motion of the shock. Later, Beresh, Clemens & Dolling (Reference Beresh, Clemens and Dolling2002) and Hou, Clemens & Dolling (Reference Hou, Clemens and Dolling2003) used particle image velocimetry (PIV) and verified that the upstream conditionally averaged velocity profiles were fuller when the shock foot was downstream (and vice versa). Using time-resolved PIV on a streamwise–spanwise plane and applying Taylor’s hypothesis, Ganapathisubramani, Clemens & Dolling (Reference Ganapathisubramani, Clemens and Dolling2009) found low-velocity fluid upstream of their compression ramp flow that remained coherent for approximately
 $50$
boundary-layer thicknesses. The authors found a strong correlation between these so-called superstructures and an instantaneous separation line surrogate. Based on the length of such a structure
 $\unicode[STIX]{x1D706}=50\unicode[STIX]{x1D6FF}_{0}$
and
 $U_{0}$
, the authors propose that the superstructure-induced low frequency scales like
 $U_{0}/2\unicode[STIX]{x1D706}$
. Since this value is of the order of
 $O(0.01U_{0}/\unicode[STIX]{x1D6FF}_{0})$
which is typically found for the shock motion, they conclude that the passage of these superstructures is responsible for the low-frequency unsteadiness in their interaction. Contrary to this, Wu & Martín (Reference Wu and Martín2008) did not find any significant low-frequency correlation between the true separation point (defined through the zero skin-friction coefficient) and upstream turbulent structures for their DNS of a Mach
 $2.9$
compression ramp configuration. Only when using a similar instantaneous separation surrogate as that of Ganapathisubramani et al. (Reference Ganapathisubramani, Clemens and Dolling2009) were the authors able to detect significant correlations, demonstrating the uncertainty of such methods when applied to experimental measurements. At the same time the authors found a high-frequency/small-amplitude spanwise wrinkling of the shock which correlated with the mass flux in the incoming TBL. Applying tomographic PIV to a Mach
 $2.1$
impinging SWBLI, Humble et al. (Reference Humble, Elsinga, Scarano and van Oudheusden2009) further observed that the passage of upstream coherent structures results in a spanwise wrinkling of the shock foot.
Theories of the second category relate the separation-shock motion to mechanisms originating downstream of it, thus basically connecting the dynamics of the separation bubble to unsteady shock movements. This idea traces back to early experimental findings of Dolling & Erengil (Reference Dolling and Erengil1991) and Thomas, Putnam & Chu (Reference Thomas, Putnam and Chu1994) for compression ramp configurations, and more recent investigations by Dupont, Haddad & Debiève (Reference Dupont, Haddad and Debiève2006) for impinging SWBLI. These studies showed that wall-pressure fluctuations measured close to the shock foot and near reattachment are correlated at frequencies connected to the separation-shock motion. The measured phase shift indicates that the separation bubble expands and contracts periodically. Similarly, based on conditionally averaged PIV velocity fields for small and large bubbles, Piponniau et al. (Reference Piponniau, Dussauge, Debiève and Dupont2009) found that the position of the reflected shock is located more downstream and upstream, respectively. They proposed a self-sustaining mechanism to explain the low-frequency shock motions based on fluid entrainment by the shear layer generated downstream of the reflected shock above the closed separation bubble. A similar entrainment/recharge mechanism consisting of a feedback loop between the separation bubble, the detached shear layer and the shock system is proposed by Wu & Martín (Reference Wu and Martín2008). Pirozzoli & Grasso (Reference Pirozzoli and Grasso2006) conducted a short-duration DNS of a Mach
 $2.25$
impinging SWBLI and proposed an acoustic feedback mechanism as a possible driver of low-frequency unsteadiness. They assume that shear-layer vortices interacting with the incident-shock tip generate acoustic disturbances that propagate upstream through the subsonic layer while subsequently inducing an oscillatory motion of the separation point, similar to Rossiter modes in cavity flows. Touber & Sandham (Reference Touber and Sandham2009) performed large-eddy simulations (LES) of the impinging SWBLI experiment by Dupont et al. (Reference Dupont, Haddad and Debiève2006) for a weak deflection angle of
 $8^{\circ }$
. Their linear-stability analysis of the mean flow revealed a two-dimensional, zero-frequency, globally unstable mode which could be linked to the low-frequency unsteadiness. Further, the authors detected upstream-travelling acoustic waves within the separation bubble, confirming the possibility of the acoustic feedback mechanism proposed by Pirozzoli & Grasso (Reference Pirozzoli and Grasso2006). Starting from the Navier–Stokes equations and incorporating LES results, Touber & Sandham (Reference Touber and Sandham2011) derived a stochastic ordinary differential equation for the shock foot low-frequency motions, whose final form was found to be mathematically equivalent to the one postulated by Plotkin (Reference Plotkin1975). They further argued that the low-frequency unsteadiness is an intrinsic low-pass filter due to the interaction and not necessarily an imposed property due to upstream or downstream forcing. However, some coherent or incoherent (white noise) forcing must be present at low frequency for the system to manifest low-frequency shock oscillations.
Based on conflicting observations in many studies with respect to the source of low-frequency shock motions, Clemens & Narayanaswamy (Reference Clemens and Narayanaswamy2009) and Souverein et al. (Reference Souverein, Dupont, Debiève, Dussauge, van Oudheusden and Scarano2010) argued that both mechanisms (upstream and downstream) are probably always present, with a weighting function depending on the state of the SWBLI. For interactions with a separation length smaller or equal to
 $2\unicode[STIX]{x1D6FF}_{0}$
, the shock unsteadiness is highly correlated with upstream TBL fluctuations, while stronger interactions are most probably dominated by downstream mechanisms inherent to the shock/bubble system itself (Clemens & Narayanaswamy Reference Clemens and Narayanaswamy2014).
Numerical investigations (DNS, LES) for impinging SWBLI that reached sufficiently long integration times, suitable for addressing the low-frequency unsteadiness, are rare in the literature. DNS results by Pirozzoli & Grasso (Reference Pirozzoli and Grasso2006) covered an integration time of only
 $25\unicode[STIX]{x1D6FF}_{0}/U_{0}$
. Priebe, Wu & Martín (Reference Priebe, Wu and Martín2009) studied the case of a Mach
 $2.9$
impinging SWBLI at a Reynolds number of
 $Re_{\unicode[STIX]{x1D6FF}_{0}}\approx 38\times 10^{3}$
and deflection angle of
 $12^{\circ }$
by means of DNS, matching experimental flow conditions of Bookey et al. (Reference Bookey, Wyckham, Smits and Martín2005). Their simulation covers approximately
 $800\unicode[STIX]{x1D6FF}_{0}/U_{0}$
and addressed low-frequency aspects of the interaction. However, a direct comparison with experimental unsteady measurements is missing. Touber & Sandham (Reference Touber and Sandham2009) were probably among the first to publish a successful comparison between their long-time (
 $10^{4}\unicode[STIX]{x1D6FF}_{0}/U_{0}$
) narrow-domain LES results and experimental data with respect to the unsteady shock motion. Further LES studies for impinging SWBLI with a focus on low-frequency aspects of the interaction have been published thereafter (Pirozzoli et al.
Reference Pirozzoli, Larsson, Nichols, Morgan and Lele2010; Agostini et al.
Reference Agostini, Larchevêque, Dupont, Debiève and Dussauge2012; Hadjadj Reference Hadjadj2012; Aubard, Gloerfelt & Robinet Reference Aubard, Gloerfelt and Robinet2013; Morgan et al.
Reference Morgan, Duraisamy, Nguyen, Kawai and Lele2013; Pasquariello et al.
Reference Pasquariello, Grilli, Hickel and Adams2014; Nichols et al.
Reference Nichols, Larsson, Bernardini and Pirozzoli2016). All of these studies, however, predominantly focused on weak interactions (with respect to the absence of a distinct pressure plateau within the separated flow) and/or low Reynolds numbers being typically below
 $Re_{\unicode[STIX]{x1D6FF}_{0}}\approx 60\times 10^{3}$
. High Reynolds number compression corner experiments (Dolling & Murphy Reference Dolling and Murphy1983; Dolling & Or Reference Dolling and Or1985) have shown that the wall-pressure signal near the separation-shock foot is highly intermittent and basically reflects the inviscid pressure jump across the oscillating shock. For low Reynolds number studies, the reflected shock foot does not penetrate as deeply into the TBL as it does in the high Reynolds number case. Increased viscous effects diffuse the separation-shock foot into a compression fan, which in turn results in a broader range of frequencies with attenuated shock intermittency (Ringuette et al.
Reference Ringuette, Bookey, Wyckham and Smits2009). This behaviour is well documented for compression corner flows, but has not been addressed so far in numerical studies for impinging SWBLI.
The purpose of the current study is to extend the available numerical database for high Reynolds number impinging SWBLI by a case with strong flow separation from wall-resolved long-time integrated LES. We adopt the experimental flow configuration of Daub, Willems & Gülhan (Reference Daub, Willems and Gülhan2015), where the incoming TBL (
 $Ma=3$
,
 $Re_{\unicode[STIX]{x1D6FF}_{0}}\approx 200\times 10^{3}$
) interacts with an oblique shock that is strong enough to cause a very large separation bubble with a length of
 $15.5\unicode[STIX]{x1D6FF}_{0}$
. The long integration time of
 $3805\unicode[STIX]{x1D6FF}_{0}/U_{0}$
allows us to analyse low-frequency aspects of the interaction in detail. A spectral analysis of wall-pressure probes serves as a starting point and provides the dominant frequencies involved in the interaction. Further, a modal decomposition of the flow by dynamic mode decomposition (DMD) (Rowley et al.
Reference Rowley, Mezić, Bagheri, Schlatter and Henningson2009; Schmid Reference Schmid2010) is used to relate global flow phenomena to frequencies identified by the (local) wall-pressure spectra. Similar DMD studies can be found in the literature based on spanwise-averaged snapshots (Pirozzoli et al.
Reference Pirozzoli, Larsson, Nichols, Morgan and Lele2010; Grilli et al.
Reference Grilli, Schmid, Hickel and Adams2012; Nichols et al.
Reference Nichols, Larsson, Bernardini and Pirozzoli2016). We adopt this methodology in a first step, and discuss similarities/differences. Subsequently we investigate three-dimensional effects based on snapshots of the two-dimensional skin-friction coefficient. The article is organised as follows: in § 2 we provide details of the numerical approach, describe the experimental flow configuration and discuss numerical details for the LES. The main results of this study are summarised in § 3. A grid- and spanwise-domain-sensitivity study is presented in § 3.1, together with a validation of the incoming TBL. The mean-flow field and a first comparison with experimental wall-pressure measurements are presented in § 3.2. Three-dimensional modulations of the nominally two-dimensional interaction will be highlighted in the same section. A spectral analysis of wall-pressure probes is presented in § 3.3 and compared with unsteady experimental measurements by Daub et al. (Reference Daub, Willems and Gülhan2015). Furthermore, high Reynolds number effects with respect to the intermittent character of the interaction are analysed. A detailed DMD analysis is provided in § 3.4, giving access to the flow organisation of dominant low- and medium-frequency modes. Finally, we summarise our results and discuss the physical origin of the low-frequency unsteadiness in § 4.
2 Numerical approach and flow configuration
2.1 Governing equations and numerical approach
We solve the three-dimensional compressible Navier–Stokes equations in conservative form on Cartesian grids
 $$\begin{eqnarray}\displaystyle \unicode[STIX]{x2202}_{t}\boldsymbol{U}+\unicode[STIX]{x1D735}\boldsymbol{\cdot }\boldsymbol{F}(\boldsymbol{U})-\unicode[STIX]{x1D735}\boldsymbol{\cdot }\boldsymbol{D}(\boldsymbol{U})=0, & & \displaystyle\end{eqnarray}$$
with the state vector
 $\boldsymbol{U}=[\unicode[STIX]{x1D70C},\unicode[STIX]{x1D70C}u_{1},\unicode[STIX]{x1D70C}u_{2},\unicode[STIX]{x1D70C}u_{3},E]$
consisting of density
 $\unicode[STIX]{x1D70C}$
, momentum
 $\unicode[STIX]{x1D70C}u_{i}$
and total energy
 $E$
. In the above equation the total flux is split into an inviscid part
 $\boldsymbol{F}=[\,\boldsymbol{f}_{1},\boldsymbol{f}_{2},\boldsymbol{f}_{3}]^{\text{T}}$
following
 $$\begin{eqnarray}\displaystyle \boldsymbol{f}_{i}(\boldsymbol{U})=[u_{i}\unicode[STIX]{x1D70C},u_{i}\unicode[STIX]{x1D70C}u_{1}+\unicode[STIX]{x1D6FF}_{i1}p,u_{i}\unicode[STIX]{x1D70C}u_{2}+\unicode[STIX]{x1D6FF}_{i2}p,u_{i}\unicode[STIX]{x1D70C}u_{3}+\unicode[STIX]{x1D6FF}_{i3}p,u_{i}(E+p)]^{\text{T}}, & & \displaystyle\end{eqnarray}$$
and a viscous contribution
 $\boldsymbol{D}=[\boldsymbol{d}_{1},\boldsymbol{d}_{2},\boldsymbol{d}_{3}]^{\text{T}}$
following
 $$\begin{eqnarray}\displaystyle \boldsymbol{d}_{i}(\boldsymbol{U})=[0,\unicode[STIX]{x1D70F}_{i1},\unicode[STIX]{x1D70F}_{i2},\unicode[STIX]{x1D70F}_{i3},u_{k}\unicode[STIX]{x1D70F}_{ik}-q_{i}]^{\text{T}}, & & \displaystyle\end{eqnarray}$$
where
 $u_{i}$
is the velocity vector and
 $\unicode[STIX]{x1D70F}_{ij}$
the viscous stress tensor, which according to the Stokes hypothesis for a Newtonian fluid is
 $$\begin{eqnarray}\displaystyle \unicode[STIX]{x1D70F}_{ij}=\unicode[STIX]{x1D707}(\unicode[STIX]{x2202}_{j}u_{i}+\unicode[STIX]{x2202}_{i}u_{j}-2/3\unicode[STIX]{x1D6FF}_{ij}\unicode[STIX]{x2202}_{k}u_{k}). & & \displaystyle\end{eqnarray}$$
The heat flux
 $q_{i}$
due to conduction follows from the Fourier law
 $$\begin{eqnarray}\displaystyle q_{i}=-\unicode[STIX]{x1D705}\unicode[STIX]{x2202}_{i}T. & & \displaystyle\end{eqnarray}$$
We model air as a perfect gas with a specific heat ratio of
 $\unicode[STIX]{x1D6FE}=1.4$
and a specific gas constant of
 ${\mathcal{R}}=287.05~\text{J}~(\text{kg}~\text{K})^{-1}$
. Pressure
 $p$
and temperature
 $T$
are determined by the ideal-gas equation of state
 $$\begin{eqnarray}\displaystyle p=\unicode[STIX]{x1D70C}{\mathcal{R}}T, & & \displaystyle\end{eqnarray}$$
and the definition of total energy
 $E$
 $$\begin{eqnarray}\displaystyle E=\frac{p}{\unicode[STIX]{x1D6FE}-1}+\frac{1}{2}\unicode[STIX]{x1D70C}u_{i}u_{i}. & & \displaystyle\end{eqnarray}$$
Temperature dependences of dynamic viscosity
 $\unicode[STIX]{x1D707}$
and thermal conductivity
 $\unicode[STIX]{x1D705}$
are modelled through Sutherland’s law and constant Prandtl number,
 $$\begin{eqnarray}\displaystyle & \displaystyle \unicode[STIX]{x1D707}=\unicode[STIX]{x1D707}_{ref}\frac{T_{ref}+C}{T+C}\left(\frac{T}{T_{ref}}\right)^{1.5}, & \displaystyle\end{eqnarray}$$
 $$\begin{eqnarray}\displaystyle & \displaystyle \unicode[STIX]{x1D705}=\frac{\unicode[STIX]{x1D6FE}{\mathcal{R}}}{(\unicode[STIX]{x1D6FE}-1)Pr}\unicode[STIX]{x1D707}, & \displaystyle\end{eqnarray}$$
with
 $Pr=0.72$
,
 $T_{ref}=293.15$
K,
 $C=122$
K and
 $\unicode[STIX]{x1D707}_{ref}=18.21\times 10^{-6}$
Pa s.
The compressible Navier–Stokes equations are solved using the adaptive local deconvolution method (ALDM) for the discretisation of the convective fluxes (Hickel, Adams & Domaradzki Reference Hickel, Adams and Domaradzki2006; Hickel, Egerer & Larsson Reference Hickel, Egerer and Larsson2014). ALDM is a nonlinear finite volume method that provides a physically consistent subgrid-scale (SGS) turbulence model for implicit LES. Employing a shock sensor based on the sensor functional of Ducros et al. (Reference Ducros, Ferrand, Nicoud, Weber, Darracq, Gacherieu and Poinsot1999) to detect discontinuities and switch on the shock dissipation mechanism, ALDM can capture shock waves, while smooth waves and turbulence are propagated accurately without excessive numerical dissipation (Hickel et al. Reference Hickel, Egerer and Larsson2014). Although the physically consistent implicit turbulence model (based on the eddy damped quasi-normal Markovian (EDQNM) theory (Lesieur, Métais & Comte Reference Lesieur, Métais and Comte2005)) implies a second-order truncation error, ALDM provides a similar spectral resolution of linear waves (modified wavenumber) as sixth-order central difference schemes. The interested reader is referred to Hickel et al. (Reference Hickel, Egerer and Larsson2014) for a detailed validation based on canonical shock–turbulence cases and a modified wavenumber analysis. The viscous flux is discretised using a second-order central difference scheme, and the third-order Runge–Kutta scheme of Gottlieb & Shu (Reference Gottlieb and Shu1998) is used for time integration. This numerical method has been successfully applied to a wide range of LES involving shock–turbulence interaction, ranging from canonical test cases (Hickel et al. Reference Hickel, Egerer and Larsson2014) to SWBLI at a compression–expansion ramp (Grilli et al. Reference Grilli, Schmid, Hickel and Adams2012; Grilli, Hickel & Adams Reference Grilli, Hickel and Adams2013), flow control of SWBLI on a flat plate (Pasquariello et al. Reference Pasquariello, Grilli, Hickel and Adams2014), shock train in a divergent nozzle (Quaatz et al. Reference Quaatz, Giglmaier, Hickel and Adams2014) and transition analysis between regular and irregular shock patterns of SWBLI (Matheis & Hickel Reference Matheis and Hickel2015).
2.2 Experimental and numerical set-up
Schematic of the experimental and numerical set-up. An instantaneous numerical schlieren image is included.

The flow configuration for the present study has been adopted from recent experiments conducted by Daub et al. (Reference Daub, Willems and Gülhan2015), a schematic of which is shown in figure 1. The test facility is a blowdown wind tunnel with a continuously adjustable nozzle, enabling a Mach number range of
 $Ma=[0.5,4.5]$
, and a closed test section of
 $0.6\times 0.6\,\text{m}$
. A wedge is mounted on a shaft and deflects the incoming flow by
 $\unicode[STIX]{x1D717}=19.6^{\circ }$
, resulting in a steady incident shock that interacts with a spatially developing flat plate TBL. For fluid–structure interaction (FSI) experiments, the baseplate can be optionally equipped with an elastic panel and the shock generator may be pitched, inducing a time-varying load on the panel (Daub, Willems & Gülhan Reference Daub, Willems and Gülhan2016). The shock generator as well as the baseplate span the wind tunnel width. The wide test section together with the full-span model (shock generator and baseplate) lead to a nearly two-dimensional SWBLI, which is demonstrated in Daub et al. (Reference Daub, Willems and Gülhan2015). They show that the streamwise wall-pressure evolution measured at the centreline and
 $90~\text{mm}$
off centre coincide (see figure 5 in the respective publication). The TBL is tripped close to the leading edge of the baseplate by a 5 mm wide strip of F
 $150$
-macrogrits with mean diameter of
 $60~\unicode[STIX]{x03BC}\text{m}$
. Figure 1 includes an instantaneous numerical schlieren image obtained from the LES. The adverse pressure gradient imposed by the incident shock is sufficient to cause strong flow separation. Note that the incident shock is curved due to the interaction with the characteristics emanating from the centred Prandtl–Meyer expansion (PME). This interaction results from the short wedge length
 $w$
, which was a deliberate experimental design to facilitate actuation in FSI experiments employing the wedge as fast-pitching shock generator (Daub et al.
Reference Daub, Willems and Gülhan2016). The theoretical incident-shock path is also shown to reflect the degree of shock curvature and to further indicate the nominal inviscid impingement location
 $x_{imp}=0.311~\text{m}$
.
Main flow parameters for the LES are summarised in table 1 and are set in accordance with the reference experiment. The flat plate TBL is characterised by a free stream Mach number of
 $Ma=3$
, a stagnation temperature of
 $T_{0}=273.7~\text{K}$
and a stagnation pressure of
 $p_{0}=582~\text{kPa}$
. Note that the stagnation conditions differ slightly from the ones reported in Daub et al. (Reference Daub, Willems and Gülhan2015) since the values summarised in table 1 refer to the specific SWBLI experimental realisation with wedge angle
 $\unicode[STIX]{x1D717}=19.6^{\circ }$
and resulting shock angle
 $\unicode[STIX]{x1D6FD}=37.3^{\circ }$
, while in the referred publication an ensemble average over multiple runs is reported. The TBL thickness, based on
 $99\,\%$
of the free stream velocity
 $U_{0}$
, is estimated to be
 $\unicode[STIX]{x1D6FF}_{0}=4~\text{mm}$
at the LES-domain inlet. The compressible momentum thickness is
 $\unicode[STIX]{x1D703}_{0}=0.28~\text{mm}$
. The Reynolds number based on the incoming boundary-layer thickness is
 $Re_{\unicode[STIX]{x1D6FF}_{0}}=U_{0}\unicode[STIX]{x1D6FF}_{0}/\unicode[STIX]{x1D708}_{0}=203\times 10^{3}$
, where
 $\unicode[STIX]{x1D708}_{0}$
is the free stream kinematic viscosity. Based on the compressible momentum thickness the Reynolds number is
 $Re_{\unicode[STIX]{x1D703}_{0}}=U_{0}\unicode[STIX]{x1D703}_{0}/\unicode[STIX]{x1D708}_{0}=14\times 10^{3}$
. The wedge width is
 $w=21.75\unicode[STIX]{x1D6FF}_{0}$
and the channel height to wedge width ratio equals
 $g^{+}=g/w=1.8$
, see also figure 1. For a given shock-generator position the non-dimensional quantity
 $g^{+}$
implicitly determines the relative impingement position of the first PME characteristic on the baseplate with respect to
 $x_{imp}$
, a quantity often referred to when dealing with transition studies between regular and irregular SWBLI (Naidoo & Skews Reference Naidoo and Skews2011; Matheis & Hickel Reference Matheis and Hickel2015).
Main flow parameters.

The experimental database includes mean and unsteady wall-pressure measurements within the interaction region. The former are realised through
 $48$
Pressure Systems, Inc. (PSI) pressure ports placed at the
 $xy$
-centreplane and
 $90~\text{mm}$
off centre, while fluctuating wall-pressure measurements are collected through
 $10$
high-speed Kulite Semiconductor, Inc. (Model XCQ-
 $062$
) pressure transducers placed at the
 $xy$
-centreplane. The natural frequency of the sensors is
 $240~\text{kHz}$
. Data acquisition is performed with a National Instruments
 $24$
-bit bridge module PXIe
 $4331$
at a sampling rate of
 $100~\text{kHz}$
, thus limiting the frequency response of the unsteady measurements to about
 $50~\text{kHz}$
. Please refer to Daub et al. (Reference Daub, Willems and Gülhan2015) for a more detailed discussion on applied measurement techniques.
2.3 Boundary conditions, grid distribution and numerical parameters
The LES domain in the
 $xy$
-plane is shown in figure 1 and covers a rectangular box with dimensions
 $L_{x}=50\unicode[STIX]{x1D6FF}_{0}$
in the streamwise and
 $L_{y}=20\unicode[STIX]{x1D6FF}_{0}$
in the wall-normal direction. The spanwise width is varied in conjunction with a domain-sensitivity study (see table 3 and § 3.1) and covers
 $L_{z}=[2.25,4.5,9]\unicode[STIX]{x1D6FF}_{0}$
. At the domain inlet a digital filter based boundary condition is used (Klein, Sadiki & Janicka Reference Klein, Sadiki and Janicka2003), for which first and second-order statistical moments have been prescribed through a precursor zero pressure gradient temporal boundary-layer simulation with target TBL thickness of
 $\unicode[STIX]{x1D6FF}_{0}$
and otherwise same flow conditions as the SWBLI simulations. The digital filter technique is particularly suitable for the present studies as it does not generate spurious correlations of the inflow data, a drawback exhibited by recycling–rescaling techniques (Stolz & Adams Reference Stolz and Adams2003). The only delicate requirement when using synthetic turbulence generators is to specify realistic integral length scales for all three velocity components and coordinate directions to avoid laminarisation issues (Touber & Sandham Reference Touber and Sandham2009). The digital filter technique induces a spatial transient downstream of the inflow which depends on the chosen integral length scales and additionally constraints the streamwise domain extent. By inspecting mean and root-mean-square (r.m.s.) profiles we found that a transient distance of approximately
 $10\unicode[STIX]{x1D6FF}_{0}$
is sufficient. Similar values can be found in the literature for supersonic TBL, e.g. Grilli et al. (Reference Grilli, Hickel and Adams2013) report a transient length of
 $8\unicode[STIX]{x1D6FF}_{0}$
for their LES of a compression–expansion ramp configuration and Wang et al. (Reference Wang, Sandham, Hu and Liu2015) find a transient length of
 $12\unicode[STIX]{x1D6FF}_{0}$
for their three-dimensional SWBLI studies including side walls.
Linear extrapolation of all flow variables is used at the outlet and the flat plate is modelled as an adiabatic no-slip wall. Spanwise periodicity is enforced, which is a legitimate assumption for the present flow configuration as discussed in § 2.2. Confinement effects as extensively studied by Bermejo-Moreno et al. (Reference Bermejo-Moreno, Campo, Larsson, Bodart, Helmer and Eaton2014) are not expected to be relevant for the SWBLI under investigation. As shown in figure 1 the LES domain does not include the shock generator. We rather chose the domain height in such a way that the first characteristic from the PME does not intersect the incident shock, thus requiring
 $x_{0}<x_{1}$
. We neglect the boundary layer on the wedge surface and analytically prescribe the aerodynamic and thermodynamic states upstream of the incident shock
 $(0)$
, downstream of the incident shock and upstream of the PME
 $(1)$
and within the PME (i) in terms of Riemann invariants. The incident shock is introduced by imposing a jump of the flow variables at
 $x_{0}$
that satisfies the Rankine–Hugoniot relations for the shock angle
 $\unicode[STIX]{x1D6FD}=37.3^{\circ }$
. The locations
 $x_{0}$
and
 $x_{1}$
with respect to the
 $xy$
coordinate system can be calculated from
 $$\begin{eqnarray}\displaystyle \left.\begin{array}{@{}c@{}}x_{0}=x_{exp}-\cos \unicode[STIX]{x1D717}\cdot w+{\displaystyle \frac{y_{exp}-L_{y}+\sin \unicode[STIX]{x1D717}\cdot w}{\tan \unicode[STIX]{x1D6FD}}}\\ x_{1}=x_{exp}+{\displaystyle \frac{y_{exp}-L_{y}}{\tan (\unicode[STIX]{x1D707}_{1}+\unicode[STIX]{x1D717})}},\end{array}\right\} & & \displaystyle\end{eqnarray}$$
where
 $(x_{exp},y_{exp})=(0.149,0.157)~\text{m}$
denotes the location of the PME, and
 $\unicode[STIX]{x1D707}_{1}$
is the Mach angle in flow region
 $(1)$
. For the present configuration we obtain
 $x_{0}=0.206~\text{m}$
and
 $x_{1}=0.215~\text{m}$
, thus resulting in a gap of
 $2.25\unicode[STIX]{x1D6FF}_{0}$
between the incident shock and the first characteristic of the PME on the top boundary patch.
In order to derive the flow states for an individual grid point
 $x_{i}$
within the PME region, it is useful to introduce an additional coordinate system
 $\hat{x}{\hat{y}}$
which is aligned with the wedge surface and has its origin at
 $(x_{exp},y_{exp})$
. Each grid point on the top boundary patch can be associated with an individual Mach line inside the PME, which itself is characterised by the angle
 $\unicode[STIX]{x1D702}_{i}$
. One can find the solution on the Mach line (i) by considering an imaginary wall at an angle
 $\unicode[STIX]{x1D717}_{i}$
for which the Mach line (i) defines the trailing edge characteristic of this auxiliary PME. The Mach number on ray (i) can be explicitly calculated from
 $$\begin{eqnarray}\displaystyle Ma_{i}=\sqrt{1+{\displaystyle \frac{\unicode[STIX]{x1D6FE}+1}{\unicode[STIX]{x1D6FE}-1}}\cdot \tan ^{2}z_{i}}, & & \displaystyle\end{eqnarray}$$
where
 $z_{i}$
replaces
 $\unicode[STIX]{x1D702}_{i}$
by means of
 $$\begin{eqnarray}\displaystyle z_{i}=\left({\displaystyle \frac{\unicode[STIX]{x1D6FE}-1}{\unicode[STIX]{x1D6FE}+1}}\right)^{0.5}\cdot (\unicode[STIX]{x1D708}_{(1)}+\unicode[STIX]{x03C0}/2-\unicode[STIX]{x1D702}_{i}),\quad 0\leqslant z_{i}\leqslant \unicode[STIX]{x03C0}/2. & & \displaystyle\end{eqnarray}$$
Herein
 $\unicode[STIX]{x1D708}_{(1)}$
denotes the Prandtl–Meyer function for the known flow state
 $(1)$
which in its general form is given by
 $$\begin{eqnarray}\displaystyle \unicode[STIX]{x1D708}_{(\bullet )}=\sqrt{{\displaystyle \frac{\unicode[STIX]{x1D6FE}+1}{\unicode[STIX]{x1D6FE}-1}}}\cdot \tan ^{-1}\sqrt{{\displaystyle \frac{\unicode[STIX]{x1D6FE}-1}{\unicode[STIX]{x1D6FE}+1}}(Ma_{(\bullet )}^{2}-1)}-\tan ^{-1}\sqrt{Ma_{(\bullet )}^{2}-1}. & & \displaystyle\end{eqnarray}$$
Once the Mach number
 $Ma_{i}$
has been calculated, the state vector
 $\boldsymbol{U}$
at
 $x_{i}$
is obtained by considering the flow state
 $(1)$
, the local flow angle with respect to the
 $xy$
coordinate system
 $(\unicode[STIX]{x1D717}-\unicode[STIX]{x1D707}_{i}-\unicode[STIX]{x1D702}_{i})$
and isentropic relations. An auxiliary two-dimensional Reynolds-averaged Navier–Stokes (RANS) simulation including the shock generator has been used to verify the boundary condition as well as the assumption of neglecting the boundary-layer growth on the wedge surface. By comparing the streamwise evolution of flow variables at a specific wall-normal distance we found that the boundary-layer growth and its influence on the trailing edge PME can be neglected.
Numerical parameters for the grid-sensitivity study.

Numerical parameters for the domain-sensitivity study.

Table 2 summarises simulation parameters for the computations that have been performed for a grid-sensitivity study. In total four different grid resolutions were considered. For all configurations the streamwise and spanwise directions are uniformly discretised, whereas a hyperbolic grid stretching is applied in the wall-normal direction following
 $$\begin{eqnarray}\displaystyle \left.y_{j}=L_{y}\cdot \tanh \left({\displaystyle \frac{\unicode[STIX]{x1D6FD}_{y}(j-1)}{N_{y}-1}}\right)\!\right/\!\tanh (\unicode[STIX]{x1D6FD}_{y}). & & \displaystyle\end{eqnarray}$$
Herein,
 $j$
is the grid point index and
 $\unicode[STIX]{x1D6FD}_{y}$
is a stretching factor which is the same for all configurations studied (see table 2). The number of cells in wall-normal direction
 $N_{y}$
is the same for all cases and chosen in such a way that in combination with a given
 $\unicode[STIX]{x1D6FD}_{y}$
at least
 $10$
cells reside within the streamwise Reynolds normal stress peak of the incoming TBL and at the same time guarantees a grid resolution in wall units of
 $\unicode[STIX]{x0394}y_{min}^{+}<1$
for the first wall cell.
The incoming TBL thickness
 $\unicode[STIX]{x1D6FF}_{0}$
is discretised with
 $162$
cells. Non-dimensionalisation is performed with respect to the inner length scale
 $l^{+}=\unicode[STIX]{x1D708}_{w}/u_{\unicode[STIX]{x1D70F}}$
measured at a reference plane
 $12.5\unicode[STIX]{x1D6FF}_{0}$
downstream of the LES inflow, where
 $u_{\unicode[STIX]{x1D70F}}=\sqrt{\unicode[STIX]{x1D70F}_{w}/\unicode[STIX]{x1D70C}_{w}}$
is the friction velocity and
 $\unicode[STIX]{x1D70F}_{w}=\unicode[STIX]{x1D707}_{w}(\unicode[STIX]{x2202}u/\unicode[STIX]{x2202}y)|_{w}$
is the wall shear stress. The coarsest grid configuration
 ${\mathcal{G}}^{1}$
results in streamwise and spanwise resolutions of
 $\unicode[STIX]{x0394}x^{+}=78$
and
 $\unicode[STIX]{x0394}z^{+}=19.6$
, respectively. For
 ${\mathcal{G}}_{z}^{1}$
the number of cells in the spanwise direction
 $N_{z}$
is doubled, resulting in
 $\unicode[STIX]{x0394}z^{+}=9.8$
. For grid level
 ${\mathcal{G}}^{2}$
, both the
 $x$
and
 $z$
resolutions are halved simultaneously when compared to
 ${\mathcal{G}}^{1}$
, thus leading to
 $\unicode[STIX]{x0394}x^{+}=39$
and
 $\unicode[STIX]{x0394}z^{+}=9.8$
. Finally, the number of cells in streamwise direction
 $N_{x}$
is doubled for
 ${\mathcal{G}}_{x}^{2}$
which leads to
 $\unicode[STIX]{x0394}x^{+}=19.5$
. A total amount of
 $90.9$
,
 $181.8$
,
 $363.6$
and
 $727.3$
million cells is used for
 ${\mathcal{G}}^{1}$
,
 ${\mathcal{G}}_{z}^{1}$
,
 ${\mathcal{G}}^{2}$
and
 ${\mathcal{G}}_{x}^{2}$
, respectively. Statistics were gathered by averaging instantaneous three-dimensional snapshots of the flow every
 $20$
steps (both in time and spanwise direction if not stated otherwise), excluding an initial transient of approximately
 $594\unicode[STIX]{x1D6FF}_{0}/U_{0}$
(or
 $11$
flow-through times, FTT). After this transient we collect samples for a time period of
 $446\unicode[STIX]{x1D6FF}_{0}/U_{0}$
for the grid-sensitivity study. It will be shown in § 3.1 that grid configuration
 ${\mathcal{G}}^{2}$
is sufficient to capture accurately the interaction zone. For corroborations of the low-frequency analysis this case has been additionally run for a much longer time period of
 $3805\unicode[STIX]{x1D6FF}_{0}/U_{0}$
(or
 $76$
FTT). Besides investigating the sensitivity of statistical results with respect to the grid resolution, we perform a domain-sensitivity study in the spanwise direction based on
 ${\mathcal{G}}^{2}$
, see table 3. The reference span of
 $L_{z}=4.5\unicode[STIX]{x1D6FF}_{0}$
(
 ${\mathcal{D}}^{2}$
) is halved (
 ${\mathcal{D}}^{1}$
) and doubled (
 ${\mathcal{D}}^{3}$
), resulting in three domain configurations
 ${\mathcal{D}}^{i}$
.
3 Results
3.1 Grid- and domain-sensitivity study
Grid-sensitivity study with respect to (a) skin-friction coefficient and (b) wall-pressure evolution. Reported quantities are time and spanwise averaged. (- - - -)
 ${\mathcal{G}}^{1}$
, (– ⋅ – ⋅ –)
 ${\mathcal{G}}_{z}^{1}$
, (——)
 ${\mathcal{G}}^{2}$
, (–
 $\cdot \cdot$
–
 $\cdot \cdot$
)
 ${\mathcal{G}}_{x}^{2}$
, (● (grey))
 ${\mathcal{G}}^{2}$
averaged over
 $446\unicode[STIX]{x1D6FF}_{0}/U_{0}$
, (
 $\cdots \cdots$
) inviscid interaction. The plateau pressure prediction according to Zukoski (Reference Zukoski1967) is also shown. See table 2 for reference.

A sensitivity study with respect to the chosen grid resolution as well as the spanwise domain extent is provided in the following. We start with the grid-sensitivity study for which table 2 summarises the main parameters. Figure 2(a,b) gives a comparison of time- and spanwise-averaged skin-friction coefficient
 $\langle C_{f}\rangle$
and wall-pressure evolution
 $\langle p_{w}\rangle /p_{\infty }$
. Comparing the coarsest grid resolution
 ${\mathcal{G}}^{1}$
(
 $\unicode[STIX]{x0394}x^{+}=78$
,
 $\unicode[STIX]{x0394}y_{min}^{+}=0.9$
,
 $\unicode[STIX]{x0394}z^{+}=19.6$
) with the next level
 ${\mathcal{G}}_{z}^{1}$
(refinement in spanwise direction) one can state that the overall wall-pressure evolution coincides, while larger deviations can be observed in the post-interaction region for the skin-friction coefficient. Mean separation and reattachment locations (defined through
 $\langle C_{f}\rangle =0$
) and thus the resulting separation length
 $L_{sep}$
remain unaltered. Note that the pressure strongly decreases in the relaxation zone due to the influence of the PME, resulting in a significantly higher skin-friction level than for the incoming TBL. The inviscid wall-pressure evolution (dotted line in figure 2
a) clearly deviates from the stepwise pressure signal characteristic of a canonical inviscid shock reflection without PME. Characteristics emanating from the centred expansion in the current SWBLI already influence the incident shock (see shock curvature in figure 1), shifting the nominal inviscid shock impingement location downstream to
 $(x-x_{imp})/\unicode[STIX]{x1D6FF}_{0}=2.35$
. Note that the wall pressure in the post-interaction zone for
 $(x-x_{imp})/\unicode[STIX]{x1D6FF}_{0}>20$
asymptotically reaches the inviscid solution. The next grid level
 ${\mathcal{G}}^{2}$
differs from the previous one
 ${\mathcal{G}}_{z}^{1}$
in the number of cells in streamwise direction, resulting in a grid resolution of
 $\unicode[STIX]{x0394}x^{+}=39$
,
 $\unicode[STIX]{x0394}y_{min}^{+}=0.9$
and
 $\unicode[STIX]{x0394}z^{+}=9.8$
in streamwise, wall-normal and spanwise directions, respectively. A strong effect is found for the skin friction and wall pressure, which is related to a significant change in separation length (relative increase of
 $14.8\,\%$
compared to
 ${\mathcal{G}}_{z}^{1}$
) and probably caused by the slightly different development of synthetic turbulence in the upstream TBL (see also the discussion related to Reynolds stresses in figure 4
b). Note that the location of reattachment remains the same, while the mean separation point moves upstream.
Having identified an influence on the results by the streamwise resolution, we doubled the number of cells in this direction, which results in grid configuration
 ${\mathcal{G}}_{x}^{2}$
(
 $\unicode[STIX]{x0394}x^{+}=9.8$
) with a total number of
 $727.3$
million cells. Both the mean wall pressure and skin friction now do not show significant changes any more. Note that we also include results on
 ${\mathcal{G}}^{2}$
for the same integration time of
 $446\unicode[STIX]{x1D6FF}_{0}/U_{0}$
as for the remaining grid resolutions (see grey bullets (●) in figure 2
a,b). The results suggest that the number of samples used in this study are sufficient to consider the results to be statistically converged with respect to the skin friction and wall pressure. Touber & Sandham (Reference Touber and Sandham2009) also investigated the sensitivity of their results to the grid resolution by refining the grid in each coordinate direction separately. They did not find significant dependencies of the size of the separation bubble with respect to the chosen grid resolution. While our results may imply a different conclusion it must be noted that their reference grid has a similar resolution expressed in wall units (
 $\unicode[STIX]{x0394}x^{+}=40.6$
,
 $\unicode[STIX]{x0394}y_{min}^{+}=1.6$
,
 $\unicode[STIX]{x0394}z^{+}=13.5$
) as our configuration
 ${\mathcal{G}}^{2}$
, for which we have identified that a further refinement does not change the overall results.
To further address the effect of grid resolution, we analyse the prediction of the plateau pressure by applying the free interaction concept. Carrière, Sirieix & Solignae (Reference Carrière, Sirieix and Solignae1969) report a generalised correlation function
 $\widetilde{{\mathcal{F}}}$
independent of Mach and Reynolds number. It accounts for non-uniformities in the incoming outer flow as well as for wall curvature effects and is especially suited for SWBLI featuring strong streamline curvature in the free interaction zone (Matheis & Hickel Reference Matheis and Hickel2015). While the pressure plateau value is around
 $\widetilde{{\mathcal{F}}}_{p}=6.4$
on
 ${\mathcal{G}}^{1}$
and
 ${\mathcal{G}}_{z}^{1}$
, we find a value of
 $\widetilde{{\mathcal{F}}}_{p}=6.0$
for the grid configurations
 ${\mathcal{G}}^{2}$
and
 ${\mathcal{G}}_{x}^{2}$
. The latter value is in perfect agreement with Erdos & Pallone (Reference Erdos and Pallone1963) who proposed a value of
 $6.0$
for the pressure plateau in turbulent flow. Figure 2(b) includes the plateau pressure prediction by Zukoski (Reference Zukoski1967). The prediction again matches the numerical results on grid levels
 ${\mathcal{G}}^{2}$
and
 ${\mathcal{G}}_{x}^{2}$
, suggesting that the Reynolds number in our studies (
 $Re_{\unicode[STIX]{x1D6FF}_{0}}\approx 2\times 10^{5}$
) is high enough such that the plateau pressure ratio essentially depends on the upstream Mach number.
Finally, we investigate the sensitivity of statistical results to the domain width. In total three configurations based on the grid resolution
 ${\mathcal{G}}^{2}$
have been considered. The reference span of
 $L_{z}=4.5\unicode[STIX]{x1D6FF}_{0}$
(
 ${\mathcal{D}}^{2}$
) is halved for
 ${\mathcal{D}}^{1}$
(
 $L_{z}=2.25\unicode[STIX]{x1D6FF}_{0}$
) and doubled for
 ${\mathcal{D}}^{3}$
(
 $L_{z}=9\unicode[STIX]{x1D6FF}_{0}$
), see table 3 for simulation parameters and figure 3 for corresponding results. While the small span LES (
 ${\mathcal{D}}^{1}$
) reveals a slightly smaller separation bubble (downstream and upstream shift of the separation and reattachment location, respectively) and a different skin-friction recovery, the results for the reference span (
 ${\mathcal{D}}^{2}$
) and the large span (
 ${\mathcal{D}}^{3}$
) are nearly undistinguishable.
Domain-sensitivity study with respect to (a) skin-friction coefficient and (b) wall-pressure evolution. Reported quantities are time and spanwise averaged. (- - - -)
 ${\mathcal{D}}^{1}$
, (——)
 ${\mathcal{D}}^{2}$
, (– ⋅ – ⋅ –)
 ${\mathcal{D}}^{3}$
. See table 3 for reference.

(a) van Driest transformed mean velocity profile and (b) r.m.s. of Reynolds stresses with density scaling
 $\unicode[STIX]{x1D709}=\sqrt{\langle \unicode[STIX]{x1D70C}\rangle /\langle \unicode[STIX]{x1D70C}_{w}\rangle }$
for all grid resolutions at
 $Re_{\unicode[STIX]{x1D70F}}=1523$
and
 $(x-x_{imp})/\unicode[STIX]{x1D6FF}_{0}=-15.25$
: (- - - -)
 ${\mathcal{G}}^{1}$
, (– ⋅ – ⋅ –)
 ${\mathcal{G}}_{z}^{1}$
, (——)
 ${\mathcal{G}}^{2}$
, (–
 $\cdot \cdot$
–
 $\cdot \cdot$
)
 ${\mathcal{G}}_{x}^{2}$
. See table 2 for reference. (
 $\odot$
(grey)) Incompressible DNS data adopted from Schlatter & Örlü (Reference Schlatter and Örlü2010) at
 $Re_{\unicode[STIX]{x1D70F}}=1271$
.

Incompressible skin-friction distribution. (——) Present LES (
 ${\mathcal{G}}^{2}$
), (- - - -) Blasius, (– ⋅ – ⋅ –) Kármán–Schoenherr (both adopted from Hopkins & Inouye (Reference Hopkins and Inouye1971)), (–
 $\cdot \cdot$
–
 $\cdot \cdot$
) Smits, Matheson & Joubert (Reference Smits, Matheson and Joubert1983), (
 $\boxdot$
) Pirozzoli & Bernardini (Reference Pirozzoli and Bernardini2011), (
 $\odot$
) Komminaho & Skote (Reference Komminaho and Skote2002), (▵) Schlatter & Örlü (Reference Schlatter and Örlü2010), (▿) Simens et al. (Reference Simens, Jiménez, Hoyas and Mizuno2009), (
 $\unicode[STIX]{x2B20}$
) Pirozzoli, Grasso & Gatski (Reference Pirozzoli, Grasso and Gatski2004),
 $(\times )$
Maeder, Adams & Kleiser (Reference Maeder, Adams and Kleiser2001), (
 $+$
) Guarini et al. (Reference Guarini, Moser, Shariff and Wray2000), (♢) Coles (Reference Coles1953) (CAT5301, from Fernholz & Finley (Reference Fernholz and Finley1977)).

In figure 4, we report the van Driest transformed mean velocity profile as well as the r.m.s. of Reynolds stresses in Morkovin scaling for all grid resolutions and evaluated at the streamwise location
 $(x-x_{imp})/\unicode[STIX]{x1D6FF}_{0}=-15.25$
, which corresponds to a friction Reynolds number of
 $Re_{\unicode[STIX]{x1D70F}}=\unicode[STIX]{x1D70C}_{w}u_{\unicode[STIX]{x1D70F}}\unicode[STIX]{x1D6FF}/\unicode[STIX]{x1D707}_{w}=1523$
. The figure also includes incompressible DNS data of Schlatter & Örlü (Reference Schlatter and Örlü2010) at their highest available friction Reynolds number of
 $Re_{\unicode[STIX]{x1D70F}}=1271$
. The inner layer and log-law region are in good agreement with the logarithmic law of the wall (with
 $\unicode[STIX]{x1D705}=0.41$
and
 $C=5.2$
) and the DNS data, with small differences recognisable in the wake region. The strength of the wake component increases with increasing momentum thickness Reynolds number and remains nearly constant above a value of approximately
 $6000$
(Coles Reference Coles1962; Smits & Dussauge Reference Smits and Dussauge2006; Gatski & Bonnet Reference Gatski and Bonnet2009). For the incompressible DNS data a momentum thickness Reynolds number of
 $4061$
is reported. In order to compare with incompressible data we compute
 $Re_{\unicode[STIX]{x1D703}_{i}}=(\unicode[STIX]{x1D707}_{0}/\unicode[STIX]{x1D707}_{w})Re_{\unicode[STIX]{x1D703}}=\unicode[STIX]{x1D70C}_{\infty }\unicode[STIX]{x1D703}U_{0}/\unicode[STIX]{x1D707}_{w}=6500$
, explaining the higher wake velocity observed in figure 4(a) for the present LES. The streamwise Reynolds stress on grid levels
 ${\mathcal{G}}^{1}$
and
 ${\mathcal{G}}_{z}^{1}$
, see figure 4(b), shows a significant overestimation of the peak value situated around
 $y^{+}\approx 10.5$
when compared to the DNS data. On grid level
 ${\mathcal{G}}^{2}$
the agreement with the reference data is very good, both in the inner and log layer. Further improvement within the log layer is obtained with
 ${\mathcal{G}}_{x}^{2}$
for the streamwise Reynolds stress. Note that the friction Reynolds number
 $Re_{\unicode[STIX]{x1D70F}}$
for the reference DNS is slightly lower, resulting in an earlier drop of the r.m.s. profiles at the wake region.
Finally we compare the skin-friction evolution obtained by the LES on grid level
 ${\mathcal{G}}^{2}$
with well-established correlations for incompressible flows, reference data from DNS and experimental data at different Mach numbers. A direct comparison with incompressible data is possible after applying the van Driest II transformation to the compressible results (van Driest Reference van Driest1956). Figure 5 shows the incompressible skin-friction coefficient
 $\langle C_{f_{i}}\rangle$
as a function of
 $Re_{\unicode[STIX]{x1D703}_{i}}$
. Our present LES results agree well with the incompressible relations of Smits et al. (Reference Smits, Matheson and Joubert1983), Blasius and Kármán–Schoenherr (both adopted from Hopkins & Inouye (Reference Hopkins and Inouye1971)), and available high Reynolds number data of Fernholz & Finley (Reference Fernholz and Finley1977).
The above grid- and domain-sensitivity studies have shown that the grid resolution
 ${\mathcal{G}}^{2}$
with a reference span of
 $L_{z}=4.5\unicode[STIX]{x1D6FF}_{0}$
properly resolves the incoming TBL and accurately predicts the interaction region. Small improvements of the streamwise Reynolds stress prediction within the log layer are possible by further increasing the streamwise grid resolution (
 ${\mathcal{G}}_{x}^{2}$
). However, the interaction region is unaffected by further refinement and thus we are confident that the grid resolution
 ${\mathcal{G}}^{2}$
is sufficiently fine. The analyses in the following are based on
 ${\mathcal{G}}^{2}$
.
3.2 Instantaneous and mean-flow organisation
(a) Instantaneous contours of temperature in the
 $xy$
midplane together with isolines indicating mean (—— (black)) and instantaneous (—— (blue)) reversed flow. (b) Time- and spanwise-averaged contours of temperature. The shock system is visualised by isolines of pressure gradient magnitude
 $|\unicode[STIX]{x1D735}p|\unicode[STIX]{x1D6FF}_{0}/p_{\infty }=\{1.08,3.28\}$
. (—— (red))
 $\langle \unicode[STIX]{x1D6FF}\rangle$
, (—— (black))
 $\langle Ma\rangle =1$
, (—— (blue))
 $\langle u\rangle =0$
.

A first impression of the flow field is provided in figure 6, where we show both instantaneous and mean contours of temperature. Isolines in figure 6(a) indicate the instantaneous and mean reversed flow (defined through
 $u/u_{\infty }=0$
and
 $\langle u\rangle /u_{\infty }=0$
, respectively). Additional isolines in figure 6(b) represent the shock system, the sonic line and the boundary-layer edge, where the latter is defined through an isovalue of mean spanwise vorticity
 $\langle \unicode[STIX]{x1D714}_{z}\rangle$
that gives the same boundary-layer thickness as the velocity-valued definition upstream of the interaction. Clearly, the adverse pressure gradient imposed by the incident shock is strong enough to cause a large flow separation and a separation shock originating well ahead of the inviscid impingement location. Note that
 $x_{imp}$
is related to the theoretical location at which a straight incident shock would impinge on the flat plate in the absence of a centred PME, thus neglecting shock curvature effects. The separation shock intersects the incident shock well outside the TBL, indicating the strong character of the interaction. Délery & Marvin (Reference Délery and Marvin1986) further characterised a strong interaction through the presence of three inflection points in the wall-pressure evolution, which are associated with the separation, the onset of reattachment and the reattachment compression. For even stronger interactions with an extended separated flow, a noticeable pressure plateau develops, as is the case for the present study (see figure 2
b,c). The separation-shock foot penetrates deeply into the incoming TBL, a phenomenon associated with the high Reynolds number of the flow (Loginov, Adams & Zheltovodov Reference Loginov, Adams and Zheltovodov2006; Ringuette et al.
Reference Ringuette, Bookey, Wyckham and Smits2009). As will be discussed later in § 3.3, this feature causes a stronger footprint on the fluctuating wall-pressure signal as compared to SWBLI at lower Reynolds number and same Mach number (Adams Reference Adams2000; Pasquariello et al.
Reference Pasquariello, Grilli, Hickel and Adams2014; Nichols et al.
Reference Nichols, Larsson, Bernardini and Pirozzoli2016). In the same figure the formation of a detached turbulent shear layer originating from the separation shock is visible and contains the separated-flow area. Compression waves are formed along with the reattachment process, which finally coalesce into the reattachment shock. The instantaneous separation bubble is strongly perturbed near the initial part of the interaction zone, probably being related to fluid entrainment through the shear-layer vortices in this region (Piponniau et al.
Reference Piponniau, Dussauge, Debiève and Dupont2009). The TBL grows significantly across the interaction, reaching a maximum of approximately
 $3\unicode[STIX]{x1D6FF}_{0}$
in the vicinity of the separation-bubble apex, see figure 6(b). The subsequent PME reduces the TBL thickness, which settles down to a value of
 $2\unicode[STIX]{x1D6FF}_{0}$
downstream of the interaction.
(a) Skin-friction and (b) wall-pressure evolution: (——) present LES (averaged in time and spanwise direction; spanwise minimum and maximum values of the time-averaged data are indicated by the grey shaded area for the long integration time of
 $3805\unicode[STIX]{x1D6FF}_{0}/U_{0}$
and by dots for the short integration time of
 $446\unicode[STIX]{x1D6FF}_{0}/U_{0}$
), (●) experimental static pressure measurements and (
 $\unicode[STIX]{x2B20}$
) mean experimental unsteady pressure measurements from Daub et al. (Reference Daub, Willems and Gülhan2015). Error bar indications are only approximate experimental estimates due to Willems (Reference Willems2016).

The mean separation length is determined from the skin-friction distribution shown in figure 7(a) and results in
 $L_{sep}=15.5\unicode[STIX]{x1D6FF}_{0}$
. Mean separation
 $x_{s}$
and reattachment
 $x_{r}$
locations are indicated by vertical dashed lines and are located at
 $(x-x_{imp})/\unicode[STIX]{x1D6FF}_{0}=-11.25\unicode[STIX]{x1D6FF}_{0}$
and
 $4.25\unicode[STIX]{x1D6FF}_{0}$
, respectively. Priebe & Martín (Reference Priebe and Martín2012) found in their compression corner results that the separation is not uniformly strong in the sense that the skin-friction coefficient varies within the separated-flow region. More precisely, their skin-friction distribution (see figure 4(a) in their publication) reveals a less strong separated flow approximately
 $1/3L_{sep}$
downstream of the mean separation location, resulting in a local
 $\langle C_{f}\rangle$
maximum. They related this behaviour to collapse events of the separation bubble during the low-frequency unsteadiness and found a positive skin-friction coefficient in this region for conditional averages of collapsing bubbles. Our results, however, show a rather uniformly strong separation over a streamwise length of approximately
 $2/3L_{sep}$
, which is probably related to the intensity of the present SWBLI. The pressure distribution reported in Priebe & Martín (Reference Priebe and Martín2012) does not exhibit a pressure plateau and the overall separation length of
 $3\unicode[STIX]{x1D6FF}_{0}$
is considerably smaller compared to our results. Furthermore, Clemens & Narayanaswamy (Reference Clemens and Narayanaswamy2014) have shown by a simple scaling analysis that the upstream momentum fluctuations may be large enough to provoke a bubble collapse in case of weakly separated flows but not for strong separations.
The grey shaded area in figure 7(a) indicates three-dimensional structures in the nominally two-dimensional interaction by considering spanwise minimum and maximum values of the time-averaged data
 $(3805\unicode[STIX]{x1D6FF}_{0}/U_{0})$
. In the incoming TBL, a very low spanwise variation of
 $\langle C_{f}\rangle$
is found, indicating statistical convergence. Two regions can be identified where evidence of stationary or slowly evolving three-dimensional flow structures exists: in the proximity of the mean separation location at
 $-11.25<(x-x_{imp})/\unicode[STIX]{x1D6FF}_{0}<-7.5$
and downstream of the inviscid impingement location at
 $(x-x_{imp})/\unicode[STIX]{x1D6FF}_{0}>0$
. Note that we also include results of the short duration LES (the dotted lines correspond to an integration time of
 $446\unicode[STIX]{x1D6FF}_{0}/U_{0}$
). Our results imply that a significant spanwise modulation of the flow is present close to the separation and reattachment location. The underlying flow structures provoking this variation are unsteady in nature, as the time-averaged spanwise minimum and maximum values reduce with longer integration times. Time scales associated with such flow phenomena are considerably longer than the characteristic time scale of the incoming TBL (
 $\unicode[STIX]{x1D6FF}_{0}/U_{0}$
), since spanwise variations are still visible for the long-duration LES close to the separation and reattachment locations but vanish upstream of the interaction. We will provide support for this assumption in the course of this section and later in § 3.4.
A similar analysis has been conducted by Loginov et al. (Reference Loginov, Adams and Zheltovodov2006) for their LES of a compression corner flow. Their results cover an integration time of
 $703\unicode[STIX]{x1D6FF}_{0}/U_{0}$
, possibly explaining the strong spanwise variation of
 $\pm 2.4\times 10^{-4}$
found in their incoming TBL. Note that our short time LES shows a significantly lower variation of
 $\pm 5.0\times 10^{-5}$
. They found two pairs of possibly steady counter-rotating streamwise vortices originating in the proximity of the compression corner and termed them Görtler-like vortices, bearing similarities with the instability mechanism found experimentally for laminar boundary layers developing on sufficiently concave surfaces (Görtler Reference Görtler1941; Floryan Reference Floryan1991). We will resume this discussion later in this section and show that a similar mechanism exists for the current SWBLI. Figure 7(b) shows the wall-pressure distribution for both LES and experiment. Similar to the findings of Loginov et al. (Reference Loginov, Adams and Zheltovodov2006), a less strong spanwise variation is observed for the wall pressure. Experimental uncertainties have been estimated taking into account the accuracy of the sensors, uncertainties in wind tunnel flow conditions (total pressure, Mach number) and geometric uncertainties (alignment of the shock generator and the baseplate), see Willems (Reference Willems2016). Both datasets are in good agreement, with a relative error with respect to the maximum pressure of
 $\langle p_{max,LES}\rangle /\langle p_{max,exp}\rangle -1=-0.029$
. For demonstration, the mean wall pressure obtained through unsteady pressure measurements is shown for an upstream position and close to the separation location.
Time- and spanwise-averaged Reynolds normal stress components. The shock system is visualised by isolines of pressure gradient magnitude
 $|\unicode[STIX]{x1D735}p|\unicode[STIX]{x1D6FF}_{0}/p_{\infty }=\{1.08,3.28\}$
. (—— (red))
 $\langle \unicode[STIX]{x1D6FF}\rangle$
, (—— (black))
 $\langle Ma\rangle =1$
, (—— (blue))
 $\langle u\rangle =0$
, (—— (grey)) dividing streamline
 $y_{ds}$
. A star (
 $\star$
) indicates the location of maximum contour level. Eight discrete contour levels are shown by dashed lines.

The effect of the SWBLI on the normal Reynolds stress components is analysed in figure 8. In each figure, we again indicate the shock system, boundary-layer thickness, sonic line and reverse flow region by individual isolines. Additionally, the grey isoline indicates the dividing streamline defined by the set of points
 $y_{ds}(x)$
for which
 $\int _{0}^{y_{ds}}\langle \unicode[STIX]{x1D70C}u\rangle \,\text{d}y=0$
. The region of highest Reynolds stress is indicated by a star and eight contour levels are superimposed by dashed lines. A high level of streamwise Reynolds stress
 $\langle u^{\prime }u^{\prime }\rangle$
is found along the detached shear layer with its maximum located at the separation-shock foot, see figure 8(a). The strong convex streamline curvature near the bubble apex considerably damps the Reynolds stresses (see Smits & Dussauge Reference Smits and Dussauge2006, e.g.). A similar observation was made by Sandham (Reference Sandham2016). A second branch of increased
 $\langle u^{\prime }u^{\prime }\rangle$
is found in the proximity of the reattachment location but located farther away from the wall. Shear-layer vortices in this region are convected downstream with the flow and interact with the reattachment compression, possibly explaining this local maximum of streamwise Reynolds stress. For the wall-normal Reynolds stress component
 $\langle v^{\prime }v^{\prime }\rangle$
, see figure 8(b), increased levels are found along the separation and reattachment shocks and are directly associated with their unsteady motion. The spanwise Reynolds stress component
 $\langle w^{\prime }w^{\prime }\rangle$
shares some similarities with the streamwise component, but one remarkable difference is observed: in the proximity of reattachment, where the dividing streamline shows a high level of concave curvature, another area of increased Reynolds stress is observed with its maximum located approximately
 $3\unicode[STIX]{x1D6FF}_{0}$
downstream and attached to the wall. This region of increased spanwise Reynolds stress covers
 $3.5<(x-x_{imp})/\unicode[STIX]{x1D6FF}_{0}<12.5$
. To the authors’ knowledge, no such phenomenon has been previously reported for impinging SWBLI. Similarities with the compression corner results of Loginov et al. (Reference Loginov, Adams and Zheltovodov2006) discussed previously suggest that a similar centrifugal instability plays a role for the current SWBLI, which would explain the increased spanwise Reynolds stress found in figure 8(c). Furthermore, the PME centred at the bubble apex, the dividing streamline and the downstream recompression correspond to a two-dimensional supersonic backward-facing step flow, for which streamwise vortices have been found experimentally in laminar, transitional and turbulent flows over a large range of Mach numbers (Ginoux Reference Ginoux1971).
Instantaneous visualisation of the reversed flow and the Görtler-like vortices at two uncorrelated times. Translucent isosurface of streamwise velocity
 $u=0$
(blue) and isosurfaces of streamwise vorticity
 $\unicode[STIX]{x1D714}_{x}=\pm 0.4U_{0}/\unicode[STIX]{x1D6FF}_{0}$
(white/black) are shown.

Numerical oil paint imitation together with mean skin-friction contours. Thick solid lines indicate time-averaged separation and reattachment locations defined by
 $\langle C_{f}\rangle =0$
. Contour cutoff level is
 $\langle C_{f}\rangle =2\times 10^{-3}$
. Time integration covers (a)
 $446\unicode[STIX]{x1D6FF}_{0}/U_{0}$
and (b)
 $3805\unicode[STIX]{x1D6FF}_{0}/U_{0}$
.

In figure 9, we show the instantaneous structure of the flow at two uncorrelated time instants. The blue isosurface indicates the reverse flow region (
 $u=0$
), while the white and black isosurfaces correspond to a positive and negative value of streamwise vorticity (
 $\unicode[STIX]{x1D714}_{x}=\pm 0.4U_{0}/\unicode[STIX]{x1D6FF}_{0}$
). As other authors have already pointed out (Loginov et al.
Reference Loginov, Adams and Zheltovodov2006; Grilli et al.
Reference Grilli, Hickel and Adams2013), the circulation of the Görtler-like vortices found in compression corner studies is rather small, which makes it difficult to extract them from background turbulent structures. For visualisation purposes we apply both a temporal and spatial filter on three-dimensional snapshots of the flow. Temporal filtering is accomplished by a simple moving-average filter. Although the roll-off capabilities and the frequency response for such a filter are very poor, the noise suppression in the time domain is excellent. The LES database consists of
 $n_{s}=7614$
three-dimensional snapshots recorded at a sampling interval of
 $\unicode[STIX]{x0394}t_{s}=0.5\unicode[STIX]{x1D6FF}_{0}/U_{0}$
. We select a filter width of
 $n_{f}=51$
snapshots for the moving-average frame. Subsequently, a top-hat filter is applied to the temporally averaged data with a constant filter width in streamwise and spanwise direction equal to
 $\unicode[STIX]{x0394}x_{f}=0.22\unicode[STIX]{x1D6FF}_{0}$
and
 $\unicode[STIX]{x0394}z_{f}=0.07\unicode[STIX]{x1D6FF}_{0}$
, while in wall-normal direction the filter width is spanned by four computational cells.
The following qualitative observations can be made from figure 9(a,b): two pairs of counter-rotating streamwise vortices develop in the reattachment region. These Görtler-like vortices are not fixed at a specific spanwise position, contrary to the results of Loginov et al. (Reference Loginov, Adams and Zheltovodov2006). Note that the inflow boundary condition in their LES contained low-amplitude steady structures, which may lock the spanwise position of the streamwise vortices, similar to model imperfections in experimental configurations (Floryan Reference Floryan1991). Another aspect is their short integration time, which might not capture low-frequency modulations of such flow structures. In accordance with experimental observations (Görtler Reference Görtler1941; Floryan Reference Floryan1991; Schülein & Trofimov Reference Schülein and Trofimov2011) as well as numerical findings (Loginov et al.
Reference Loginov, Adams and Zheltovodov2006; Grilli et al.
Reference Grilli, Hickel and Adams2013), the spanwise width of each vortex pair is approximately
 $2\unicode[STIX]{x1D6FF}_{0}$
. The spanwise width of our computational domain of
 $L_{z}=4.5\unicode[STIX]{x1D6FF}_{0}$
in combination with periodic boundary conditions allow flow structures with a spanwise wavelength of at most
 $4.5\unicode[STIX]{x1D6FF}_{0}$
to be captured. We investigated the wavelength on our large-span configuration
 ${\mathcal{D}}^{3}$
with
 $L_{z}=9\unicode[STIX]{x1D6FF}_{0}$
and found the same width of about
 $2\unicode[STIX]{x1D6FF}_{0}$
for a vortex pair. The effect of the streamwise vortices on the separated flow is clearly visible in figure 9(b): vortex-induced upwash decreases the shear stress at this specific spanwise location and directly influences the reattachment position by shifting it further downstream. Indeed, at
 $z/\unicode[STIX]{x1D6FF}_{0}\approx -0.4$
such a flow configuration can be observed. Vortex-induced downwash (
 $z/\unicode[STIX]{x1D6FF}_{0}\approx 1$
) increases the local shear stress and subsequently shifts the reattachment position further upstream. The above findings suggest a direct coupling between the separated-flow dynamics and the streamwise vortices. As pointed out by Floryan (Reference Floryan1991), such vortices in turbulent flow have no spanwise preference position and thus meander in time. Steady non-uniformities, e.g. when small vortex generators are placed in the settling chamber of a wind tunnel, might induce a preferred lateral position around which the spanwise motion occurs. In case that the level of unsteady disturbances of the oncoming flow is large compared to that of the steady disturbances, however, no preferred spanwise position can be observed for Görtler-like vortices (Kottke Reference Kottke1988; Floryan Reference Floryan1991). An animation of figure 9 reveals that the streamwise vortices tend to meander in the lateral direction. At the same time the vortices appear and disappear, coalesce and separate in an apparently random manner. Consequently, the effect of the Görtler-like vortices on the mean spanwise flow modulation diminishes with increasing averaging time. This is also evident when looking at figure 10, where we show a numerical oil flow visualisation together with mean skin-friction contours evaluated for the wall plane. While figure 10(a) is obtained for the short-duration LES, figure 10(b) includes a large number of low-frequency oscillations of the separation bubble. Characteristic node and saddle points close to the reattachment location can be observed for the former. Convergence and divergence lines associated with regions of vortex-induced upwash and downwash indicate a strong spanwise modulation of the flow for the time frame considered. While figure 10(a) might suggest a system of steady streamwise vortices to be present, the results for the long-run LES clearly suggest the streamwise vortices to be unsteady. Node and saddle points as well as convergence and divergence lines appear suppressed in figure 10(b), indicating a less strong spanwise modulation of the mean flow with increasing averaging time.
(a) Curvature parameter
 $\unicode[STIX]{x1D6FF}/R$
and (b) Görtler number
 $G_{T}$
evaluated along a mean-flow streamline passing through
 $(x-x_{imp})/\unicode[STIX]{x1D6FF}_{0}=-15$
and
 $y/\unicode[STIX]{x1D6FF}_{0}=0.75$
. (- - - -) stability limits according to Görtler (Reference Görtler1941) and Smits & Dussauge (Reference Smits and Dussauge2006).
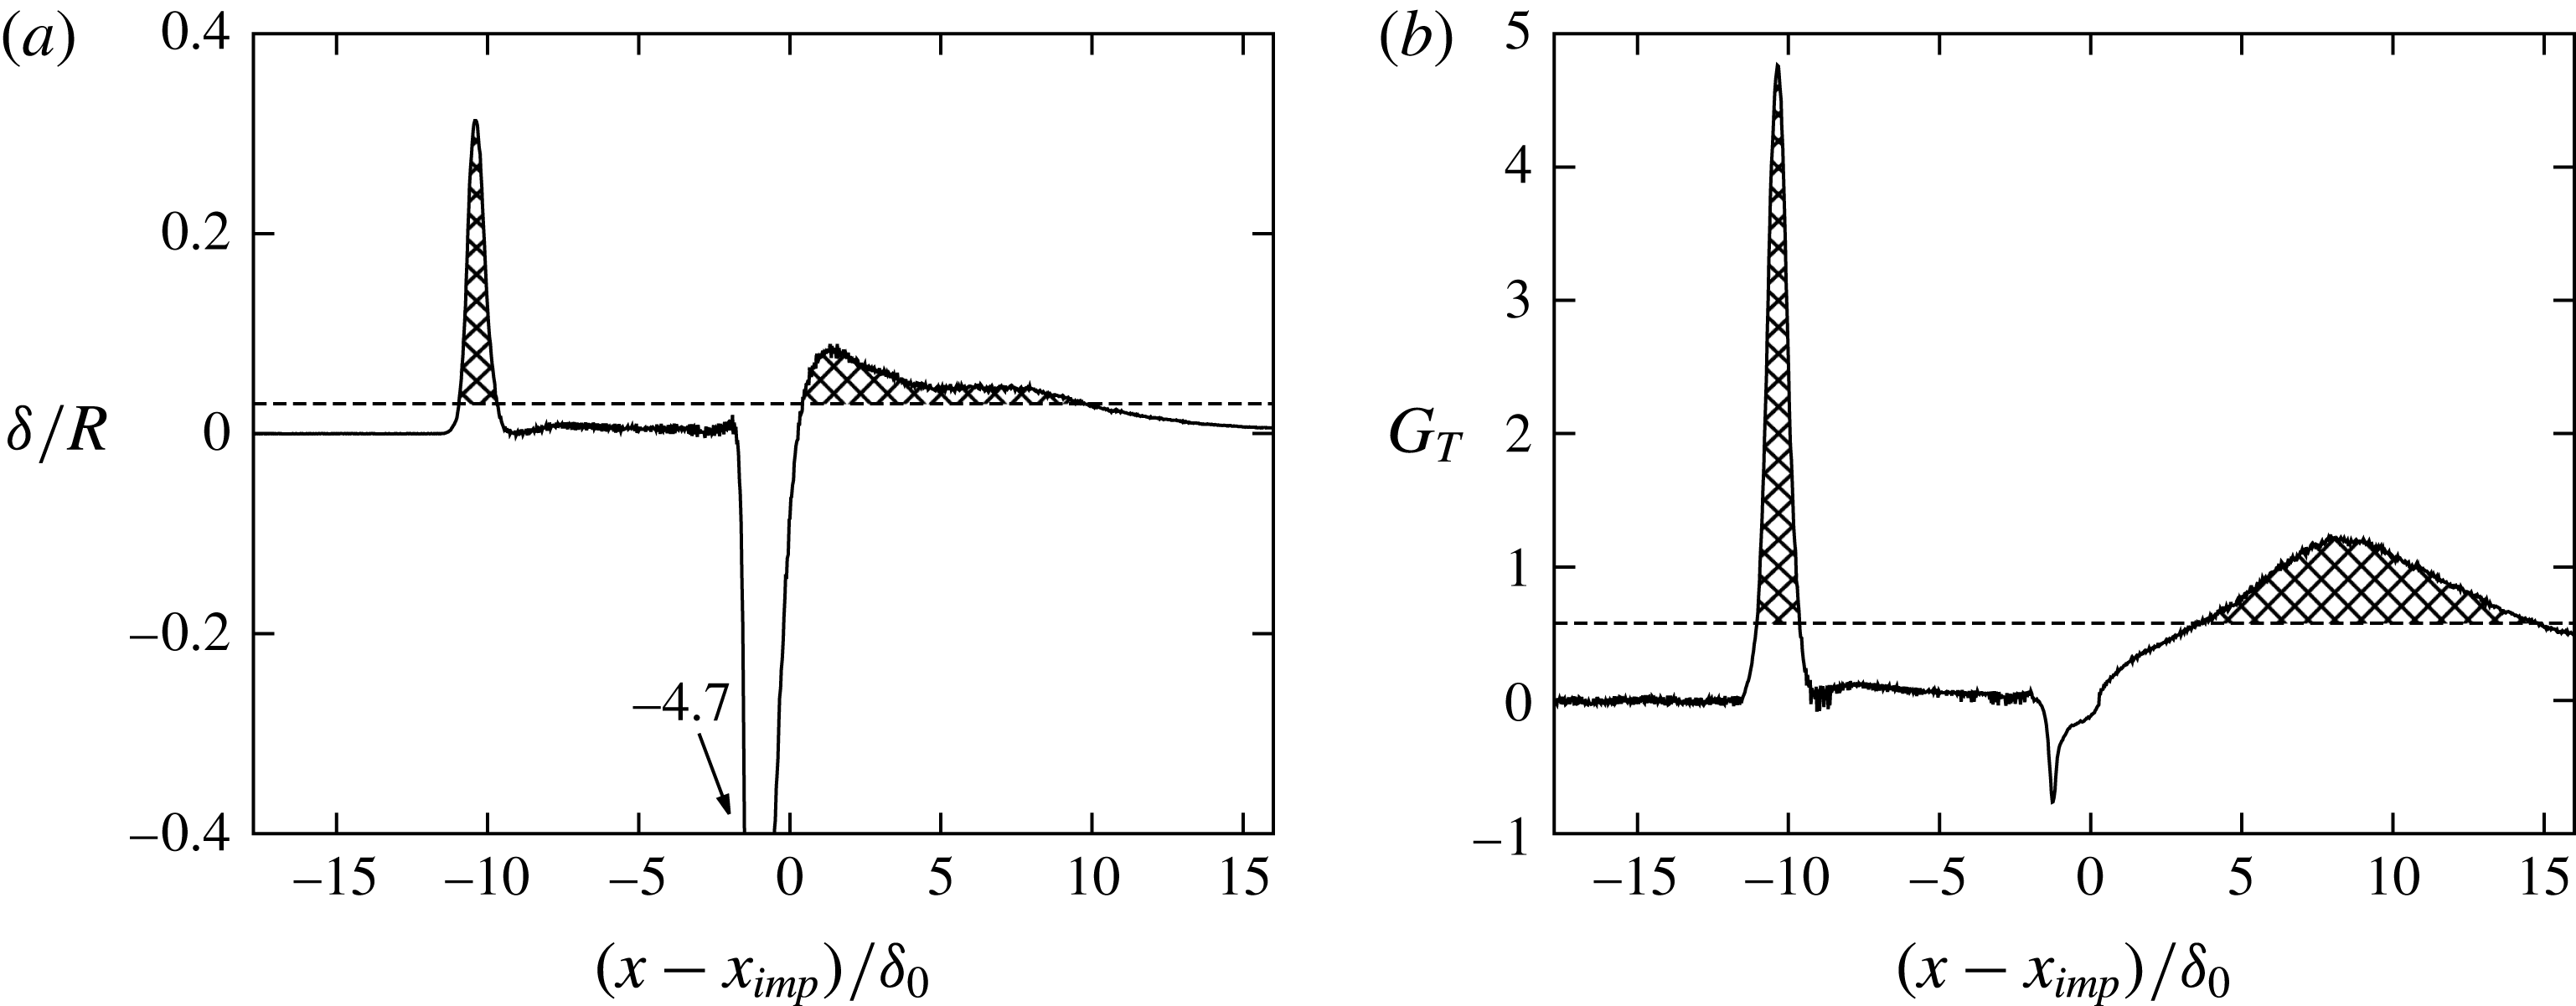
Figure 11 analyses the curvature parameter
 $\unicode[STIX]{x1D6FF}/R$
and the Görtler number
 $G_{T}$
for a mean-flow streamline passing through
 $(x-x_{imp})/\unicode[STIX]{x1D6FF}_{0}=-15$
and
 $y/\unicode[STIX]{x1D6FF}_{0}=0.75$
. According to Loginov et al. (Reference Loginov, Adams and Zheltovodov2006) and Smits & Dussauge (Reference Smits and Dussauge2006), the Görtler number for a compressible turbulent flow may be defined as
 $$\begin{eqnarray}\displaystyle G_{T}={\displaystyle \frac{\unicode[STIX]{x1D703}}{0.018\unicode[STIX]{x1D6FF}_{1}}}\sqrt{{\displaystyle \frac{\unicode[STIX]{x1D703}}{|R|}}}\cdot \text{sgn}(R). & & \displaystyle\end{eqnarray}$$
Therein
 $\unicode[STIX]{x1D6FF}_{1}$
,
 $\unicode[STIX]{x1D703}$
and
 $R$
denote the displacement thickness, the momentum thickness and the streamline curvature radius of the mean flow, respectively. Note that we have modified the above expression to indicate convex and concave curvature. Smits & Dussauge (Reference Smits and Dussauge2006) report a lower limit for the curvature parameter above which longitudinal vortices are expected to develop, this being
 $\unicode[STIX]{x1D6FF}/R\approx 0.03$
for a
 $Ma=3$
flow. In laminar flow the critical Görtler number is
 $G_{T}=0.58$
(Görtler Reference Görtler1941). Both limits are significantly exceeded within a short region close to the separation point as well as within a long region at reattachment (see filled patterns in figure 11(a,b). Although it is unclear whether such stability criteria hold also for turbulent flow, the high values within the reattachment region, which last over a significantly long streamwise distance of
 $11\unicode[STIX]{x1D6FF}_{0}$
, indicate a centrifugal instability to be a plausible mechanism for the generation of Görtler-like vortices.
3.3 Spectral analysis
(a) Numerical and (b) experimental wall-pressure signal near the separation-shock foot. The numerical probe is located at mean separation
 $x_{s}$
, low-pass filtered with a finite impulse rate filter (cutoff Strouhal number of
 $St_{\unicode[STIX]{x1D6FF}}=0.33$
, filter order of
 $900$
) and subsequently projected on the experimental time axis via linear interpolation. Locations of the experimental and numerical pressure probe are indicated in figure 7. (c) Weighted power spectral density
 $f\cdot {\mathcal{P}}(f)$
for the raw pressure signals without low-pass filtering. Experimental data from Daub et al. (Reference Daub, Willems and Gülhan2015) with (—— (grey))
 $T_{seg}=374L_{sep}/U_{0}$
(
 $n_{seg}=130$
) and (- - - - (grey))
 $T_{seg}=51L_{sep}/U_{0}$
(
 $n_{seg}=973$
). (——) LES with
 $T_{seg}=51L_{sep}/U_{0}$
(
 $n_{seg}=12$
).

The unsteadiness of the present SWBLI is studied in this section by means of spectral analysis. For this purpose,
 $1230$
equally spaced wall-pressure probes have been placed in streamwise direction along the midplane of the computational domain. The probes span the region
 $-17.74<(x-x_{imp})/\unicode[STIX]{x1D6FF}_{0}<17.18$
and are sampled at a frequency of approximately
 $f_{s}=60U_{0}/\unicode[STIX]{x1D6FF}_{0}$
, which corresponds to
 $8.9~\text{MHz}$
. Figure 12(a,b) compares a section of the experimental wall-pressure measurement (Daub et al.
Reference Daub, Willems and Gülhan2015) with the LES signal. Both signals have been evaluated near the separation-shock foot, i.e. the experimental location is given by the unsteady pressure transducer indicated in figure 7(b), whereas the LES signal has been extracted at the mean separation location
 $x_{s}$
. As mentioned in § 2.2, the cutoff frequency of the experimental measurements is
 $50~\text{kHz}(0.33U_{0}/\unicode[STIX]{x1D6FF}_{0})$
. Consequently, scales in the incoming TBL, whose characteristic frequency is of the order of
 $U_{0}/\unicode[STIX]{x1D6FF}_{0}$
, are undersampled. In order to mimic the experimental cutoff effect, we low-pass filter the LES signal with a finite impulse rate (FIR) filter of order
 $900$
and a
 $-6~\text{dB}$
cutoff Strouhal number of
 $St_{\unicode[STIX]{x1D6FF}}=0.33$
. Subsequently, the filtered signal is projected on the experimental time axis via linear interpolation. Qualitative similarities between both datasets can be observed in terms of intermittency, occurring time scales and wall-pressure amplitudes. In contrast to previous low Reynolds numerical studies (Adams Reference Adams2000; Touber & Sandham Reference Touber and Sandham2009; Priebe & Martín Reference Priebe and Martín2012; Pasquariello et al.
Reference Pasquariello, Grilli, Hickel and Adams2014), our filtered signal shows the well-known intermittent character typically observed in high Reynolds number experiments, that is, the wall-pressure jumps from the incoming TBL value to that behind the separation shock and back again. This effect is attributed to the high Reynolds number of the flow as shown experimentally by Dolling & Murphy (Reference Dolling and Murphy1983) and Dolling & Or (Reference Dolling and Or1985). At lower Reynolds number the separation shock does not penetrate as far into the TBL as it does at high Reynolds number. In fact, the separation shock is diffused by increased viscous effects when approaching the wall. Since its motion is no longer associated with a single, well-defined shock wave, its intermittency is attenuated (Adams Reference Adams2000; Ringuette et al.
Reference Ringuette, Bookey, Wyckham and Smits2009).
A more quantitative comparison of both signals is given in figure 12(c), where we show the weighted power spectral density (PSD) of the two signals. Note that the LES signal is not low-pass filtered for this comparison, thus retaining the high-frequency TBL content. Welch’s algorithm with Hamming windows is used to estimate the PSD. For the LES signal (black solid line), a total number of
 $n_{seg}=12$
segments is used with
 $65\,\%$
overlap. These parameters lead to a segment length of approximately
 $783\unicode[STIX]{x1D6FF}_{0}/U_{0}(51L_{sep}/U_{0})$
. For the available experimental signal two segmentation configurations have been used. The grey solid line reflects a total number of
 $n_{seg}=130$
segments with
 $65\,\%$
overlap. This leads to an individual window length of
 $5797\unicode[STIX]{x1D6FF}_{0}/U_{0}(374L_{sep}/U_{0})$
and should resolve all expected low-frequency dynamics properly. The parameters for the grey dashed line are chosen in such a way that the individual segment length is the same as for the LES, leading to a total number of
 $n_{seg}=973$
segments. The good qualitative agreement between both signals observed in figure 12(a,b) is also confirmed by their spectra. Both spectra indicate the presence of a dominant low-frequency peak around a non-dimensional frequency of
 $St_{L_{sep}}=fL_{sep}/U_{0}\approx 0.04$
. This value agrees well with experimental studies for different flow geometries and upstream conditions by Dussauge, Dupont & Debiève (Reference Dussauge, Dupont and Debiève2006), who found that the unsteadiness occurs at frequencies centred about
 $St_{L_{sep}}=0.02{-}0.05$
. While the peak amplitude for the shock unsteadiness is captured very well by the LES, we observe a lower energy level for frequencies below the low-frequency peak. We have computed the PSD for a reduced number of segments
 $n_{seg}$
in order to allow for increased low-frequency resolution. We find that the energy content of the LES signal at frequencies below
 $St_{L_{sep}}<0.04$
essentially is unaffected. We believe that the observed discrepancies may be caused by side wall effects in the experiment which mainly show up at low frequencies. The LES data show an additional bump centred around
 $f\unicode[STIX]{x1D6FF}_{0}/U_{0}\approx 1$
, associated with the most energetic scales of the TBL. The experimental cutoff frequency of
 $0.33U_{0}/\unicode[STIX]{x1D6FF}_{0}$
excludes this range from the experimental data.
Weighted power spectral density map. At each streamwise location the weighted spectra are normalised by
 $\int {\mathcal{P}}(f)\,\text{d}f$
. Mean separation and reattachment locations are highlighted by vertical dashed lines.

The wall-pressure spectrum for all numerical probes is shown in figure 13. Mean separation and reattachment locations are indicated by vertical dashed lines. Note that no energetically significant low-frequency content is apparent in the upstream TBL, proving the suitability of the digital filter technique. In accordance with previous numerical (Touber & Sandham Reference Touber and Sandham2009; Priebe & Martín Reference Priebe and Martín2012; Grilli et al.
Reference Grilli, Schmid, Hickel and Adams2012) and experimental (Thomas et al.
Reference Thomas, Putnam and Chu1994; Dupont et al.
Reference Dupont, Haddad and Debiève2006) studies, the broadband peak associated with energetic scales in the incoming TBL shifts towards significantly lower frequencies close to the mean separation location and moves back again to higher frequencies downstream of the interaction. Within the rear part of the separation bubble so-called medium frequencies around
 $St_{L_{sep}}\approx 0.5$
develop, which are probably related to shear-layer vortices convected over the recirculation (Dupont et al.
Reference Dupont, Haddad and Debiève2006). While the low-frequency activity is concentrated around the mean separation location, another significant level of unsteadiness is found slightly upstream and at frequencies around
 $0.1U_{0}/L_{sep}$
. Associated time scales of approximately
 $10L_{sep}/U_{0}$
can be found in the wall-pressure signal, see figure 12(a,b), and are related to the intermittent character of the separation shock as will be shown in figure 15.
The streamwise variation in r.m.s. wall-pressure fluctuations is shown in figure 14. The distributions are obtained by integrating the power spectra over a given frequency range
 $$\begin{eqnarray}\displaystyle \langle p^{\prime }p^{\prime }\rangle |_{f_{1}-f_{2}}=\int _{f_{1}}^{f_{2}}{\mathcal{P}}(f)\,\text{d}f. & & \displaystyle\end{eqnarray}$$
We focus on the low-frequency contributions of pressure fluctuations and thus select
 $f_{2}=1U_{0}/L_{sep}$
, see also figure 12(c). At the same time this value is sufficiently far away from the experimental cutoff frequency of
 $5.2U_{0}/L_{sep}$
, hence avoiding aliasing effects. The lower limit
 $f_{1}$
is chosen to be the smallest resolved frequency, individually selected for experiment (filled bullets) and LES (solid line). The overall agreement within the separated-flow region and after reattachment is satisfactory, while the peak value associated with the separation shock motion is underestimated by the LES. This effect can be attributed to the longer sampling time for the experiment, thus resolving much lower frequencies that contribute to the overall energy level. In fact, when restricting the integration of the experimental data to the same lower value
 $f_{1}$
as for the LES (open symbols in figure 14
a), the peak r.m.s. value reproduces the numerical result without affecting the other measurement locations.
(a) Band-limited root mean square of wall-pressure fluctuations. (——) LES data obtained by integrating the PSD for
 $St_{L_{sep}}<1$
, (●) experimental data from Daub et al. (Reference Daub, Willems and Gülhan2015) obtained by integrating the PSD for
 $St_{L_{sep}}<1$
and (
 $\unicode[STIX]{x2B20}$
) by integrating the PSD for
 $0.014<St_{L_{sep}}<1$
. (b) Band-limited (
 $St_{L_{sep}}<1$
) relative root mean square of wall-pressure fluctuations for the present LES. (▴) indicate locations which will be discussed in conjunction with figure 15.

Similarly to experimental observations (Dolling & Murphy Reference Dolling and Murphy1983; Dolling & Or Reference Dolling and Or1985; Selig et al.
Reference Selig, Andreopoulos, Muck, Dussauge and Smits1989), the high Reynolds number of the flow leads to a distinct r.m.s. peak centred around
 $x_{s}$
. Directly downstream a plateau region develops, followed by a continuous increase in pressure fluctuations until a second maximum is reached. Note that the second maximum is located
 $2.4\unicode[STIX]{x1D6FF}_{0}$
downstream of the mean reattachment location. This position apparently coincides with the reattaching shear layer, see figure 6(a), for which a characteristic frequency of the reattaching large-scale vortices is usually found around
 $0.5U_{0}/L_{sep}$
(Dupont et al.
Reference Dupont, Haddad and Debiève2006). In figure 14(b) we further investigate the band-limited low-frequency contribution of pressure fluctuations to the total fluctuation energy for the present LES. In the incoming TBL approximately
 $10\,\%$
of the total r.m.s. of wall-pressure fluctuations reside in the lower-frequency range of
 $f<1U_{0}/L_{sep}$
. A similar value has been found experimentally by Thomas et al. (Reference Thomas, Putnam and Chu1994). When approaching the mean separation point, almost the complete (
 $95\,\%$
) pressure-fluctuation intensity is associated with such low frequencies. Thomas et al. (Reference Thomas, Putnam and Chu1994) investigated experimentally a compression corner flow at a free stream Mach number of
 $1.5$
and a Reynolds number of
 $Re_{\unicode[STIX]{x1D6FF}}\approx 178\times 10^{3}$
. They found that the fraction of fluctuation intensity that is associated with separation-shock oscillation increases with increasing ramp angle. For their largest ramp angle of
 $12^{\circ }$
a ratio of
 $55\,\%$
is reported, which is significantly lower than our value and possibly related to the considerably lower Mach number and weaker interaction in their study. Close to reattachment the low-frequency contribution is still responsible for
 $55\,\%$
of the total wall-pressure-fluctuation intensity and composed of a superposition of separation-bubble dynamics and reattaching shear-layer vortices convected downstream.
Wall-pressure signals (a) and corresponding normalised probability density distributions (b) evaluated at
 $(x-x_{imp})/\unicode[STIX]{x1D6FF}_{0}=\{-17.74,-11.66,-11.34,4.25,6.61,17.18\}$
. Refer to the text and figure 14 for a physical interpretation of the wall-pressure positions. The mean wall pressure is indicated by a horizontal dashed line. Arrows together with vertical bars indicate the mean wall pressure and its standard deviation. Values of skewness
 $\unicode[STIX]{x1D6FC}_{3}$
and flatness
 $\unicode[STIX]{x1D6FC}_{4}$
coefficients and a Gaussian distribution are included for reference.

(a) Streamwise intermittency distribution
 $\unicode[STIX]{x1D6FE}_{i}(x)$
. The mean separation location
 $x_{s}$
is indicated. (
 $\unicode[STIX]{x2B20}$
) highlight
 $1\,\%$
and
 $99\,\%$
intermittency boundaries and define the intermittent length scale
 $L_{i}=1.2\unicode[STIX]{x1D6FF}_{0}$
. (b) Skewness coefficient
 $\unicode[STIX]{x1D6FC}_{3}$
as a function of intermittency
 $\unicode[STIX]{x1D6FE}_{i}$
. (——) LES. Symbols represent experimental data from Dolling & Or (Reference Dolling and Or1985) for a compression ramp flow at a Mach number of
 $Ma=2.9$
and a Reynolds number of
 $Re_{\unicode[STIX]{x1D6FF}_{0}}=1.43\times 10^{6}$
with wedge angles (
 $\blacklozenge$
)
 $\unicode[STIX]{x1D717}=12^{\circ }$
(attached flow), (●)
 $\unicode[STIX]{x1D717}=16^{\circ }$
(incipient separation), (▴)
 $\unicode[STIX]{x1D717}=20^{\circ }$
(separated flow) and (▪)
 $\unicode[STIX]{x1D717}=24^{\circ }$
(separated flow).

The intermittent character of the wall pressure is further analysed in figure 15. On the left we show the normalised wall-pressure evolution for six different streamwise locations. On the right the corresponding normalised probability density functions (PDFs) computed from
 $228\,681$
samples grouped into
 $478$
bins, together with a standard Gaussian distribution are shown. The individual positions are indicated in the r.m.s. plot of wall-pressure fluctuations, see figure 14. From top to bottom they refer to the undisturbed TBL, the onset of interaction, the location of maximum wall-pressure fluctuation intensity, the mean reattachment position, the reattaching shear layer and the post-interaction location. The incoming TBL signal is effectively Gaussian, which is also reflected by the skewness
 $\unicode[STIX]{x1D6FC}_{3}$
and flatness
 $\unicode[STIX]{x1D6FC}_{4}$
coefficients.
The next probe is located
 $0.41\unicode[STIX]{x1D6FF}_{0}$
upstream of the mean separation location at a pressure level of
 $\langle p_{w}\rangle /\langle p_{w,0}\rangle =1.07$
. The signal is strongly intermittent. This is also confirmed by the associated PDF which is highly skewed and has a single mode at
 $-0.5\unicode[STIX]{x1D70E}_{p_{w}}$
, thus reflecting the probability of finding pressures in the range of the incoming TBL. Close to the mean separation location, at a pressure level of
 $\langle p_{w}\rangle /\langle p_{w,0}\rangle =1.27$
, the signal is still intermittent. Its PDF is highly left skewed with tendencies to develop a bimodal shape whose centres are located around
 $\pm 1\unicode[STIX]{x1D70E}_{p_{w}}$
. These two pressure probes have been evaluated at a very similar pressure ratio as done by Dolling & Murphy (Reference Dolling and Murphy1983). The reported wall-pressure signals and PDF qualitatively agree with experimental observations by Dolling & Murphy (Reference Dolling and Murphy1983) (see figure 6 in the respective publication) and Dolling & Or (Reference Dolling and Or1985) (see figure 3 in their publication), which again confirms the high Reynolds number character of the present SWBLI. The bimodal character is more pronounced in their studies, which is probably because of the even higher Reynolds number of
 $Re_{\unicode[STIX]{x1D6FF}_{0}}=1.43\times 10^{6}$
in their experiment. At the mean reattachment position the signal is slightly left skewed, see also Adams (Reference Adams2000). Wall-pressure fluctuations increase for the next downstream probe, which is located in the proximity of the reattaching shear layer. At the same time the skewness coefficient increases. Further downstream the signal has returned to an almost Gaussian shape with relaxed pressure fluctuations.
In figure 16(a) we show the intermittency factor
 $\unicode[STIX]{x1D6FE}_{i}(x)$
. According to Dolling & Or (Reference Dolling and Or1985) it is defined as
 $$\begin{eqnarray}\displaystyle \unicode[STIX]{x1D6FE}_{i}={\displaystyle \frac{\displaystyle \int _{t_{1}}^{t_{2}}\left\{\begin{array}{@{}l@{}}1,p_{w}>\langle p_{w,0}\rangle +3\unicode[STIX]{x1D70E}_{p_{w,0}}\\ 0,\text{ else}\end{array}\right.\text{d}t}{t_{2}-t_{1}}}, & & \displaystyle\end{eqnarray}$$
which describes the fraction of time that the wall pressure is above the threshold value defined by the undisturbed incoming TBL. A high intermittency level of
 $\unicode[STIX]{x1D6FE}_{i}(x_{s})=0.84$
is found at the mean separation location. Based on the
 $1\,\%$
and
 $99\,\%$
intermittency boundaries we can derive an intermittent length scale of
 $L_{i}=1.2\unicode[STIX]{x1D6FF}_{0}$
. For comparison, Loginov et al. (Reference Loginov, Adams and Zheltovodov2006) reported a value of
 $\unicode[STIX]{x1D6FE}_{i}(x_{s})=0.88$
and
 $L_{i}=1.3\unicode[STIX]{x1D6FF}_{0}$
. According to Dolling & Or (Reference Dolling and Or1985), higher-order moments such as
 $\unicode[STIX]{x1D6FC}_{3}$
are only a function of
 $\unicode[STIX]{x1D6FE}_{i}$
and do not depend on the flow geometry. Their compression corner results at
 $Re_{\unicode[STIX]{x1D6FF}_{0}}=1.43\times 10^{6}$
and four different ramp angles are shown in figure 16(b). The overall correlation is satisfactory and our LES results (solid line) support the experimental findings. Dolling & Or (Reference Dolling and Or1985) also analysed data for a different flow geometry (blunt fin) and a variety of Reynolds numbers. These results generally support the free interaction concept and suggest a Reynolds number dependency for the peak value of
 $\unicode[STIX]{x1D6FC}_{3}$
.
3.4 Dynamic mode decomposition
The previous section addressed the unsteady character of the interaction by means of local flow diagnostics. The aim of the following modal analysis is to relate global flow phenomena to the frequencies found in § 3.3. We will start with a two-dimensional DMD in terms of spanwise-averaged snapshots. This is motivated by the successful application of the DMD method to similar SWBLI problems by Pirozzoli et al. (Reference Pirozzoli, Larsson, Nichols, Morgan and Lele2010), Grilli et al. (Reference Grilli, Schmid, Hickel and Adams2012), Tu (Reference Tu2013) and Nichols et al. (Reference Nichols, Larsson, Bernardini and Pirozzoli2016), the analysis of low-pass filtered and spanwise-averaged flow fields by Priebe & Martín (Reference Priebe and Martín2012) and the global stability analysis by Touber & Sandham (Reference Touber and Sandham2009). Three-dimensional effects are however present for the current study as already shown in the previous sections. Therefore we will subsequently apply the DMD to snapshots of the two-dimensional skin-friction data, which will enable us to conclude whether three-dimensional modulations of the separated-flow region are present.
A short overview of the DMD is given in the following. DMD is a Koopman-operator-based spectral analysis technique that decomposes the flow field into coherent spatial structures sharing the same temporal frequency (Rowley et al.
Reference Rowley, Mezić, Bagheri, Schlatter and Henningson2009; Schmid Reference Schmid2010). It operates on a discrete sequence of snapshots and can be used to extract a reduced-order representation of the underlying dynamical system. Starting point is a given sequence of snapshots
 $\boldsymbol{V}_{1}^{n}=\{\boldsymbol{v}_{1},\boldsymbol{v}_{2},\ldots ,\boldsymbol{v}_{n}\}\in \mathbb{R}^{m\times n}$
sampled at constant time intervals
 $\unicode[STIX]{x0394}t_{s}$
, where each
 $\boldsymbol{v}_{i}$
is a column vector with
 $m$
entries (e.g. velocities on the computational grid). A linear, time-invariant operator is assumed to relate two consecutive snapshots, that is
 $\boldsymbol{v}_{i+1}=\boldsymbol{A}\boldsymbol{v}_{i}$
. The dynamics of the underlying system is determined once the eigenvalues and eigenvectors of this operator
 $\boldsymbol{A}\in \mathbb{R}^{m\times m}$
are found. Note that in case of a nonlinear system this assumption is equivalent to a linear approximation. The time-invariant mapping allows to formulate a Krylov sequence of the data of the form
 $\boldsymbol{V}_{1}^{n}=\{\boldsymbol{v}_{1},\boldsymbol{A}\boldsymbol{v}_{1},\boldsymbol{A}^{2}\boldsymbol{v}_{1},\ldots ,\boldsymbol{A}^{n-1}\boldsymbol{v}_{1}\}$
. In general
 $m$
is so large that we cannot compute eigenvalues of
 $\boldsymbol{A}$
directly, which is why we seek for a low-order representation. A method that does not require explicit knowledge of
 $\boldsymbol{A}$
is based on the assumption that we can express
 $\boldsymbol{v}_{n}$
as a linear combination of the previous
 $n-1$
linearly independent vectors
 $\boldsymbol{v}_{i}$
according to
 $$\begin{eqnarray}\displaystyle \boldsymbol{v}_{n}=a_{1}\boldsymbol{v}_{1}+a_{2}\boldsymbol{v}_{2}+\cdots +a_{n-1}\boldsymbol{v}_{n-1}+\boldsymbol{r}. & & \displaystyle\end{eqnarray}$$
Following the work of Schmid (Reference Schmid2010), the above relation can be applied to the snapshot sequence to obtain
 $$\begin{eqnarray}\displaystyle \boldsymbol{A}\boldsymbol{V}_{1}^{n-1}=\boldsymbol{V}_{2}^{n}=\boldsymbol{V}_{1}^{n-1}\boldsymbol{S}+\boldsymbol{r}\boldsymbol{e}^{\text{T}}, & & \displaystyle\end{eqnarray}$$
where
 $\boldsymbol{e}=(0,\ldots ,1)\in \mathbb{R}^{n-1}$
. The matrix
 $\boldsymbol{S}\in \mathbb{R}^{(n-1)\times (n-1)}$
is a companion matrix with the only unknowns
 $a_{i}$
. It is a lower-dimensional representation of
 $\boldsymbol{A}$
and shares a subset of approximate eigenvalues, which are often referred to as Ritz values (Rowley et al.
Reference Rowley, Mezić, Bagheri, Schlatter and Henningson2009). In case of a linear system the residual
 $\boldsymbol{r}$
vanishes. We will later use (3.4) in our analysis to verify whether enough snapshots have been collected. The companion matrix
 $\boldsymbol{S}$
can be obtained by solving (3.4) in a least-squares sense. The resulting decomposition in terms of eigenvalues and eigenvectors of
 $\boldsymbol{S}$
, however, often produces an ill-conditioned and noise-sensitive algorithm, which is why Schmid (Reference Schmid2010) proposed a more robust implementation based on a singular value decomposition (SVD) of
 $\boldsymbol{V}_{1}^{n-1}=\boldsymbol{U}\unicode[STIX]{x1D72E}\boldsymbol{V}^{\text{T}}$
. The SVD of
 $\boldsymbol{V}_{1}^{n-1}$
in combination with (3.5) yields the approximate matrix
 $\widetilde{\boldsymbol{S}}=\boldsymbol{U}^{\text{T}}\boldsymbol{V}_{2}^{n}\boldsymbol{V}\unicode[STIX]{x1D72E}^{-1}=\boldsymbol{U}^{\text{T}}\boldsymbol{A}\boldsymbol{U}$
, which is the same result as when the linear operator
 $\boldsymbol{A}$
is projected onto the proper orthogonal decomposition (POD) basis implicitly contained in the matrix
 $\boldsymbol{U}$
. Finally, the individual DMD modes
 $\unicode[STIX]{x1D753}_{i}\in \mathbb{C}^{m}$
are obtained by
 $$\begin{eqnarray}\displaystyle \unicode[STIX]{x1D753}_{i}=\boldsymbol{U}\boldsymbol{y}_{i}, & & \displaystyle\end{eqnarray}$$
where
 $\boldsymbol{y}_{i}\in \mathbb{C}^{n-1}$
denotes the
 $i$
th eigenvector of
 $\widetilde{\boldsymbol{S}}$
, that is
 $\widetilde{\boldsymbol{S}}\boldsymbol{y}_{i}=\unicode[STIX]{x1D707}_{i}\boldsymbol{y}_{i}$
with
 $\unicode[STIX]{x1D707}_{i}\in \mathbb{C}$
being the associated eigenvalue. With the above decomposition it is possible to approximate experimental or numerical snapshots using a linear combination of the DMD modes
 $$\begin{eqnarray}\displaystyle \boldsymbol{v}_{m}\approx \mathop{\sum }_{i=1}^{n-1}\unicode[STIX]{x1D753}_{i}\unicode[STIX]{x1D707}_{i}^{m}\unicode[STIX]{x1D6FC}_{i},\quad m\in \{1,\ldots ,n-1\}, & & \displaystyle\end{eqnarray}$$
where
 $\unicode[STIX]{x1D6FC}_{i}\in \mathbb{C}$
can be recognised as the amplitude of the individual DMD mode. In matrix form we obtain
 $$\begin{eqnarray}\displaystyle \boldsymbol{V}_{1}^{n-1}\approx \underbrace{[\unicode[STIX]{x1D753}_{1},\unicode[STIX]{x1D753}_{2},\ldots ,\unicode[STIX]{x1D753}_{n-1}]}_{\unicode[STIX]{x1D753}}\underbrace{\left[\begin{array}{@{}cccc@{}}\unicode[STIX]{x1D6FC}_{1} & & & \\ & \unicode[STIX]{x1D6FC}_{2} & & \\ & & \ddots & \\ & & & \unicode[STIX]{x1D6FC}_{n-1}\end{array}\right]}_{\boldsymbol{D}_{\unicode[STIX]{x1D736}}}\underbrace{\left[\begin{array}{@{}cccc@{}}1 & \unicode[STIX]{x1D707}_{1} & \cdots \, & \unicode[STIX]{x1D707}_{1}^{n-1}\\ 1 & \unicode[STIX]{x1D707}_{2} & \cdots \, & \unicode[STIX]{x1D707}_{2}^{n-1}\\ \vdots & \vdots & \ddots & \vdots \\ 1 & \unicode[STIX]{x1D707}_{n-1} & \cdots \, & \unicode[STIX]{x1D707}_{n-1}^{n-1}\end{array}\right]}_{\boldsymbol{V}_{and}}. & & \displaystyle\end{eqnarray}$$
The choice of the DMD amplitudes
 $\unicode[STIX]{x1D6FC}_{i}$
is not unique. Here we follow the strategy by Jovanović, Schmid & Nichols (Reference Jovanović, Schmid and Nichols2014), who proposed to solve the following optimisation problem for the unknown amplitudes
 $$\begin{eqnarray}\displaystyle \unicode[STIX]{x1D736}_{opt}=\underset{\unicode[STIX]{x1D736}}{\text{arg}\,\text{min}}|\boldsymbol{V}_{1}^{n-1}-\unicode[STIX]{x1D753}\boldsymbol{D}_{\unicode[STIX]{x1D6FC}}\boldsymbol{V}_{and}|_{F}^{2}, & & \displaystyle\end{eqnarray}$$
where
 $|\cdot |_{F}$
denotes the Frobenius norm. Resulting amplitudes
 $\unicode[STIX]{x1D736}_{opt}$
in combination with (3.7) optimally approximate the entire data sequence. Note that the above optimisation problem reduces to the classical first snapshot scaling (Tu & Rowley Reference Tu and Rowley2012) for a full-rank system.
One of the main problems when applying the DMD algorithm is to properly select the dynamically most important and robust modes of the underlying dataset. The amplitude of a mode
 $\unicode[STIX]{x1D6FC}_{i}$
might be a good indicator for modes having an almost zero growth rate, but could be misleading for transient modes associated with large negative growth rates. We therefore use a more sophisticated and automated mode selection algorithm developed by Jovanović et al. (Reference Jovanović, Schmid and Nichols2014). Their sparsity-promoting DMD (SPDMD) algorithm augments the optimisation problem (3.9) by a regularisation term that penalises the
 $\ell _{1}$
-norm of the vector of DMD amplitudes
 $\unicode[STIX]{x1D6FC}_{i}$
 $$\begin{eqnarray}\displaystyle \widetilde{\unicode[STIX]{x1D736}}=\underset{\unicode[STIX]{x1D736}}{\text{arg}\,\text{min}}|\boldsymbol{V}_{1}^{n-1}-\unicode[STIX]{x1D753}\boldsymbol{D}_{\unicode[STIX]{x1D6FC}}\boldsymbol{V}_{and}|_{F}^{2}+\unicode[STIX]{x1D6FE}\mathop{\sum }_{i=1}^{n-1}|\unicode[STIX]{x1D6FC}_{i}|, & & \displaystyle\end{eqnarray}$$
where
 $\unicode[STIX]{x1D6FE}$
is a given positive regularisation parameter that for large values enforces a sparse vector
 $\widetilde{\unicode[STIX]{x1D736}}$
, while for
 $\unicode[STIX]{x1D6FE}=0$
the conventional optimisation problem (3.9) is recovered. When for a given
 $\unicode[STIX]{x1D6FE}$
a desired sparsity structure is achieved, the amplitudes for the non-zero entries of
 $\widetilde{\unicode[STIX]{x1D736}}$
are adjusted according to (3.9). For algorithmic details on how to effectively solve this convex optimisation problem please refer to Jovanović et al. (Reference Jovanović, Schmid and Nichols2014). Besides the mode selection algorithm via SPDMD we will also look at the magnitude of a mode
 $|\unicode[STIX]{x1D753}_{i}|$
, which has been shown to correlate with the spectral behaviour of the underlying flow field when compared to local measurements (Rowley et al.
Reference Rowley, Mezić, Bagheri, Schlatter and Henningson2009).
Finally, dynamic information of an individual DMD mode in terms of growth rate
 $\unicode[STIX]{x1D6FD}_{i}$
and angular frequency
 $\unicode[STIX]{x1D714}_{i}$
are implicitly available through the eigenvalues
 $\unicode[STIX]{x1D707}_{i}$
after applying a logarithmic mapping
 $$\begin{eqnarray}\displaystyle \unicode[STIX]{x1D706}_{i}=\ln \unicode[STIX]{x1D707}_{i}/\unicode[STIX]{x0394}t_{s}\quad \rightarrow \quad \begin{array}{@{}l@{}}\unicode[STIX]{x1D6FD}_{i}=\text{Re}(\unicode[STIX]{x1D706}_{i})=\ln |\unicode[STIX]{x1D707}_{i}|/\unicode[STIX]{x0394}t_{s}\\ \unicode[STIX]{x1D714}_{i}=\text{Im}(\unicode[STIX]{x1D706}_{i})=\text{arg}(\unicode[STIX]{x1D707}_{i})/\unicode[STIX]{x0394}t_{s}\end{array}. & & \displaystyle\end{eqnarray}$$
Our database for the spanwise-averaged DMD analysis consists of
 $n=7000$
snapshots of pressure and velocity fields
 $\{p,u,v\}$
, equispaced in time with an interval of
 $\unicode[STIX]{x0394}t_{s}=0.5\unicode[STIX]{x1D6FF}_{0}/U_{0}$
. Only a subdomain of the full computational box is used for the modal analysis, which covers the region
 $-15.25<(x-x_{imp})/\unicode[STIX]{x1D6FF}_{0}<19.75$
and
 $0<y/\unicode[STIX]{x1D6FF}_{0}<7.5$
. We thus focus on the dynamically interesting interaction region. This leads to a snapshot matrix of
 $\boldsymbol{V}_{1}^{n}\in \mathbb{R}^{m\times n}$
with dimensions
 $m=968\,352$
and
 $n=7000$
. The particular choice of the number of snapshots for the current analysis is motivated by studying the DMD residual introduced in (3.4). The normalised
 $\ell _{2}$
-norm of the residual vector is plotted over the number of snapshots in figure 17(a). The DMD residual appears sufficiently saturated after approximately
 $7000$
snapshots. It is thus plausible to assume that enough snapshots have been gathered to accurately predict the dynamics of the system. We show contours of the residual for both the pressure and streamwise velocity in figure 17(b) for the chosen snapshot set of
 $n=7000$
. The above settings lead to a frequency resolution expressed in Strouhal number of
 $2.86\times 10^{-4}<St_{\unicode[STIX]{x1D6FF}}<1$
(
 $4.43\times 10^{-3}<St_{L_{sep}}<15.5$
). The high sampling rate is motivated by the fact that, besides the low-frequency phenomenon, we want to accurately resolve the medium-frequency unsteadiness typically found around frequencies of
 $0.5U_{0}/L_{sep}$
(Dupont et al.
Reference Dupont, Haddad and Debiève2006). Moreover, as pointed out by Nichols et al. (Reference Nichols, Larsson, Bernardini and Pirozzoli2016), the signal-to-noise ratio is significantly increased as we partially resolve turbulence, having a favourable effect on convergence properties of the DMD algorithm.
In figure 18(a) we show the spectrum of eigenvalues resulting from the standard DMD algorithm. Since real-valued input data are processed the modes arise as complex conjugate pairs, which results in a symmetric spectrum. Nearly all eigenvalues reside on the unit circle
 $|\unicode[STIX]{x1D707}_{i}|=1$
. This is expected for statistically stationary systems and further indicates that the snapshot sequence
 $\boldsymbol{V}_{1}^{n}$
lies on or near an attracting set (Rowley et al.
Reference Rowley, Mezić, Bagheri, Schlatter and Henningson2009). The normalised magnitudes of the individual DMD modes
 $|\unicode[STIX]{x1D753}_{i}|$
for positive frequencies are shown in figure 18(b). To facilitate mode selection, we apply the SPDMD algorithm of Jovanović et al. (Reference Jovanović, Schmid and Nichols2014). The filled bullets indicate a subset of
 $N_{sub}=13$
modes that have been categorised as dynamically important. Note that the SPDMD method does not simply chose the DMD modes based on their magnitude, but identifies modes having the strongest influence on the complete snapshot sequence (Jovanović et al.
Reference Jovanović, Schmid and Nichols2014). The DMD spectrum shares some similarities with the local PSD at the mean separation location shown in figure 12(c), that is the low-frequency unsteadiness appears as a broadband bump involving multiple low frequencies. This implies that the unsteadiness is connected to a global flow phenomenon. In agreement with the spectral analysis of wall-pressure probes presented in § 3.3, one of the low-frequency modes obtained by the DMD algorithm is located at
 $St_{L_{sep}}=0.039$
and is part of the SPDMD subset. The modes selected by the SPDMD algorithm can be categorised into two different types as indicated by the frequency bins I and II in figure 18(b). Modes belonging to the first group (I) describe a flow modulation that involves the shock system and separation bubble as an entity, while modes belonging to the second group (II) correspond to shedding motions of the detached shear layer. We post-processed the SPDMD modes within each single bin and found that they share similar flow structures, which is why in the following we only select two representatives out of each region, see the labels
 $\unicode[STIX]{x1D753}_{1}$
,
 $\unicode[STIX]{x1D753}_{2}$
,
 $\unicode[STIX]{x1D753}_{3}$
and
 $\unicode[STIX]{x1D753}_{4}$
in figure 18(b). The associated frequencies are
 $f_{1}=0.039U_{0}/L_{sep}$
,
 $f_{2}=0.114U_{0}/L_{sep}$
,
 $f_{3}=0.52U_{0}/L_{sep}$
and
 $f_{4}=1.087U_{0}/L_{sep}$
.
(a) Normalised DMD residual according to (3.4). (b) Contours of DMD residual for pressure (top) and streamwise velocity (bottom) for
 $n=7000$
.

(a) Spectrum of eigenvalues resulting from the standard DMD algorithm. (b) Normalised magnitudes of the DMD modes. (● (grey)) indicate a SPDMD subset of
 $N_{sub}=13$
modes.

Animations of the mean-flow modulation through the individual modes are available as a supplement to the online version at https://doi.org/10.1017/jfm.2017.308 of this article and should be considered in conjunction with the following discussions. For a selected mode
 $\unicode[STIX]{x1D753}_{i}$
we reconstruct an individual real-valued flow variable
 $\boldsymbol{u}$
according to
 $\boldsymbol{u}(\boldsymbol{x},t)=\unicode[STIX]{x1D753}_{m}+a_{f}\cdot \text{Re}\{\unicode[STIX]{x1D6FC}_{i,opt}\unicode[STIX]{x1D753}_{i}\text{e}^{\text{i}\unicode[STIX]{x1D714}_{i}t}+\text{cc}\}$
, where
 $\unicode[STIX]{x1D753}_{m}$
denotes the mean mode,
 $\text{cc}$
indicates the contribution of the complex conjugate of
 $\unicode[STIX]{x1D753}_{i}$
and
 $a_{f}$
is an optional amplification factor. We only study the oscillatory component of each DMD mode and thus neglect the individual growth rate
 $\unicode[STIX]{x1D6FD}_{i}$
, since in the limit of infinitely many snapshots the growth rate tends towards zero for a nonlinear statistically stationary system (Pirozzoli et al.
Reference Pirozzoli, Larsson, Nichols, Morgan and Lele2010). In contrast to the results of Grilli et al. (Reference Grilli, Schmid, Hickel and Adams2012), where the low-frequency unsteadiness is restricted to a few discrete phase-locked modes, the DMD spectrum in figure 18(a) shows a large number of contributing modes. Indeed, increasing the number
 $N_{sub}$
for the SPDMD algorithm results in selecting nearly all modes within the low-frequency bin. Consequently, the contribution of a single mode to the mean-flow field is hardly seen, which is why we chose a suitable magnification factor
 $a_{f}$
for
 $\unicode[STIX]{x1D753}_{i}$
before adding it to the mean mode
 $\unicode[STIX]{x1D753}_{m}$
. The supplementary animations show contours of the pressure gradient magnitude in the range
 $|\unicode[STIX]{x1D735}p|\unicode[STIX]{x1D6FF}_{0}/p_{\infty }=[0,10]$
at
 $8$
equally spaced phase angles, that is
 $\unicode[STIX]{x1D714}_{i}t=j\unicode[STIX]{x03C0}/4,j=0\ldots 7$
. The mean shock system together with the instantaneous separation bubble are highlighted by black solid lines.
Real and imaginary part of DMD modes showing contours of modal pressure fluctuations
 $p^{\prime }/p_{\infty }$
. (a)
 $\text{Re}(\unicode[STIX]{x1D753}_{i})$
. (b)
 $-\text{Im}(\unicode[STIX]{x1D753}_{i})$
. Refer to figure 18 for the mode selection. For clarity, the mean shock system, the mean sonic line and the mean dividing streamline are superimposed by black solid lines.

Real and imaginary part of DMD modes showing contours of modal velocity fluctuations
 $u^{\prime }/U_{0}$
. (a)
 $\text{Re}(\unicode[STIX]{x1D753}_{i})$
. (b)
 $-\text{Im}(\unicode[STIX]{x1D753}_{i})$
. Refer to figure 18 for the mode selection. For clarity, the mean shock system, the mean sonic line and the mean dividing streamline are superimposed by black solid lines.

In figures 19 and 20 we show the real and (negative) imaginary part of the selected DMD modes with contours of pressure and velocity fluctuations, respectively. The temporal mode evolution between the two discrete phase angles
 $\unicode[STIX]{x1D714}_{i}t=0$
and
 $\unicode[STIX]{x1D714}_{i}t=\unicode[STIX]{x03C0}/2$
is equivalent to the real and negative imaginary part when neglecting the individual growth rate
 $\unicode[STIX]{x1D6FD}_{i}$
. Note that the contour range has been adjusted for best visibility and thus does not reflect the actual minimum and maximum values.
Considering the pressure modulation with respect to the low-frequency mode
 $\unicode[STIX]{x1D753}_{1}$
, a high level of
 $p^{\prime }$
is found along the separation and reattachment shock. These fluctuations are out of phase and describe an oscillation of the shock system as a whole, i.e. a periodic contraction and expansion of the interaction region. While the separation shock exhibits a nearly translational motion, a flapping motion is observed for the reattachment shock. No fluctuations are found along the incident shock above the shock-intersection location, which remains steady. Similarly to the results of Nichols et al. (Reference Nichols, Larsson, Bernardini and Pirozzoli2016), velocity fluctuations (see
 $\text{Im}(\unicode[STIX]{x1D753}_{1})$
in figure 20) are mainly concentrated along the separation shock and the detached shear layer, with minor contributions within the recirculation bubble. Increased levels of pressure and velocity fluctuations are not visible within the incoming TBL for
 $\unicode[STIX]{x1D753}_{1}$
. Mode
 $\unicode[STIX]{x1D753}_{2}$
is associated with a frequency of
 $f_{2}=0.114U_{0}/L_{sep}$
and shares some similarities with the former low-frequency mode: high levels of pressure fluctuations are found along the separation and transmitted incident shock. However, the strength is not uniform along the former, indicating a change of the shock angle with respect to the free stream (see also the animation available online). Pressure fluctuations are increased within the recirculation region close to the bubble apex and probably related to a flapping motion of the incident-shock tip (see
 $\text{Im}(\unicode[STIX]{x1D753}_{2})$
in figure 19), which strongly perturbs the mean separation bubble in this region.
The medium-frequency mode
 $\unicode[STIX]{x1D753}_{3}$
and its higher harmonic
 $\unicode[STIX]{x1D753}_{4}$
have a strong impact on the reattachment shock in terms of shock wrinkling. This shock wrinkling is clearly seen from an animation of the snapshot sequence and caused by shear-layer vortices interacting with the reattachment compression. The modal shapes provide a proof of this observation, see
 $\text{Re}(\unicode[STIX]{x1D753}_{3})$
and
 $\text{Re}(\unicode[STIX]{x1D753}_{4})$
in figure 19. Their activity is concentrated along the mean sonic line and associated with shear-layer vortices convected downstream while simultaneously inducing eddy Mach waves in the supersonic part of the flow. This finding is consistent with global linear-stability analysis of impinging SWBLI in the laminar regime by Guiho, Alizard & Robinet (Reference Guiho, Alizard and Robinet2016). Besides the corrugation of the reattachment shock, Mach wave radiation induces disturbances along the reflected shock above the shock-intersection location. Similar results have been found by Agostini et al. (Reference Agostini, Larchevêque, Dupont, Debiève and Dussauge2012) through cross-correlation maps between the pressure field and time series of the streamwise location of the reflected shock for their LES studies of incipient, mildly and fully separated SWBLI at
 $Ma=2.3$
and
 $Re_{\unicode[STIX]{x1D6FF}_{0}}\approx 60\times 10^{3}$
(see figure 8 in the respective publication). The supplementary online material further highlights that the modes
 $\unicode[STIX]{x1D753}_{3}$
and
 $\unicode[STIX]{x1D753}_{4}$
primarily influence the rear part of the separation bubble starting from the bubble apex. While the separation point remains quasi unaltered, the reattachment location is strongly perturbed by the shear-layer vortices reattaching nearby.
(a) Spectrum of eigenvalues resulting from the standard DMD algorithm. (b) Normalised magnitudes of the DMD modes. (● (grey)) indicate a SPDMD subset of
 $N_{sub}=17$
modes.

We now move on to the DMD analysis of the skin-friction coefficient
 $\{C_{f}\}$
. The sampling time interval and frequency resolution is the same as for the former analysis. The subdomain chosen for the modal decomposition coincides in streamwise direction with the DMD of spanwise-averaged snapshots, while in spanwise direction we take the full LES domain extent of
 $-2.25<z/\unicode[STIX]{x1D6FF}_{0}<2.25$
. As expected, nearly all eigenvalues lie on the unit circle, see figure 21(a). The normalised mode magnitudes
 $|\unicode[STIX]{x1D753}_{i}|$
are shown in figure 21(b). We again employ the SPDMD algorithm to ease the mode selection process and highlight a subset of
 $N_{sub}=17$
modes. The spectrum is similar to the one from the spanwise-averaged analysis shown in figure 18(b) with respect to the frequencies selected by the SPDMD within each single frequency bin. However, differences can be observed for the high-frequency part starting from
 $f>3U_{0}/L_{sep}$
. Since we partially resolve high-frequency related turbulent structures and do not filter them out through spanwise averaging as in the former analysis, the spectrum still shows significant energy content in this region. Note that two modes with the same low frequency of
 $f=6\times 10^{-3}U_{0}/L_{sep}$
and large modal norm are visible in the spectrum. We do not, however, pay much attention to these modes, as they are very close to the minimum resolvable frequency of the snapshot sequence given by
 $4.43\times 10^{-3}U_{0}/L_{sep}$
. Moreover, the SPDMD algorithm does not classify these modes as being dynamically important, even if we increase the subset size.
Real and imaginary part of DMD modes showing contours of modal skin-friction fluctuations
 $C_{f}^{\prime }$
. (a)
 $\text{Re}(\unicode[STIX]{x1D753}_{i})$
. (b)
 $-\text{Im}(\unicode[STIX]{x1D753}_{i})$
. Refer to figure 21 for the mode selection. For clarity, the mean separation and reattachment locations are superimposed by black solid lines.

Figure 22 shows the real and (negative) imaginary part of four dynamically important DMD modes with contours of skin-friction perturbation and isolines of mean separation and reattachment location. The frequencies of the selected modes,
 $f_{1}=0.035U_{0}/L_{sep}$
,
 $f_{2}=0.12U_{0}/L_{sep}$
,
 $f_{3}=0.52U_{0}/L_{sep}$
and
 $f_{4}=1.58U_{0}/L_{sep}$
(see also figure 21(b) for reference), are similar to the ones of the spanwise-averaged DMD analysis. An animation of each mode superimposed on the mean solution is again available as a supplement to the online version of this article and should be considered for the following discussion. There, the instantaneous separation and reattachment locations are highlighted by black solid lines, whereas the mean lines are shown in the print version. The low-frequency mode
 $\unicode[STIX]{x1D753}_{1}$
shows a nearly two-dimensional modulation of the separation-shock foot, see
 $\text{Im}(\unicode[STIX]{x1D753}_{1})$
in figure 22, with comparably low activity inside the recirculation zone. Remarkably, streamwise streaks (generated through Görtler-like vortices) starting slightly upstream of the mean reattachment location and extending up to the domain end are clearly visible. A spanwise wavelength of approximately
 $2\unicode[STIX]{x1D6FF}_{0}$
is found (similar to the spanwise width of each vortex pair shown in figure 9), from which we conclude to have identified footprints of Görtler-like vortices. Their impact on the skin friction results in a large-scale flapping of the reattachment line, superimposed on a breathing motion of the separation bubble as a whole (see also the animation available online). In the absence of Görtler-like vortices, the separation bubble would uniformly expand and shrink across the span. The shape of the second dynamically important mode
 $\unicode[STIX]{x1D753}_{2}$
is similar to the former. Streamwise streaks of same wavelength are dominant at this frequency and the separation line moves essentially back and forth. The animation reveals a spanwise motion of the streaks, which provokes a spanwise wrinkling of the reattachment line without significant influence on its streamwise position.
The medium-frequency mode
 $\unicode[STIX]{x1D753}_{3}$
(
 $f_{3}=0.52U_{0}/L_{sep}$
) is connected to large-scale vortices reattaching downstream of the mean reattachment line, which are subsequently convected towards the domain outlet. Similarly to the results from the spanwise-averaged DMD analysis, modes
 $\unicode[STIX]{x1D753}_{3}$
and
 $\unicode[STIX]{x1D753}_{4}$
do not considerably affect the separation line but leave a strong footprint on the reattachment dynamics (see also the animation available online).
4 Summary and discussion
The present work was motivated by the lack of an analysis of strong impinging shock-wave/turbulent boundary-layer interactions (SWBLI) with very large mean-flow separation at high Reynolds number based on well-resolved numerical simulation data. We have performed wall-resolved large-eddy simulations for the flow configuration of a recent experiment (Daub et al.
Reference Daub, Willems and Gülhan2015), consisting of a flat plate turbulent boundary layer at Mach number
 $Ma=3$
and Reynolds number
 $Re_{\unicode[STIX]{x1D6FF}_{0}}=203\times 10^{3}$
. The incoming TBL interacts with a wedge-induced shock wave that deflects the incoming flow by
 $\unicode[STIX]{x1D717}=19.6^{\circ }$
and leads to a strongly separated mean-flow region with a length of
 $L_{sep}=15.5\unicode[STIX]{x1D6FF}_{0}$
.
The mean wall-pressure evolution agrees with experimental measurements and exhibits a distinct pressure plateau representative of a strong SWBLI. Similarly to LES results of Loginov et al. (Reference Loginov, Adams and Zheltovodov2006) for their compression corner flow, Görtler-like vortices exist in our configuration. These counter-rotating streamwise vortices develop slightly downstream of the bubble apex and induce a strong spanwise flow modulation in this region. In our case, however, these vortices are not locked at a specific spanwise position, but rather undergo a meandering motion that is coupled to the separation-bubble dynamics.
Our well-resolved and long-time integrated LES data enable an accurate analysis of the low-frequency SWBLI dynamics. Spectral analyses of numerical and experimental wall-pressure signals near the separation point demonstrate a broadband low-frequency unsteadiness with a peak amplitude near
 $St_{L_{sep}}=0.04$
, consistent with experimental values found by Dussauge et al. (Reference Dussauge, Dupont and Debiève2006) for different flow geometries and upstream conditions. High Reynolds number effects lead to a distinct peak (global maximum) in the r.m.s. wall-pressure fluctuations centred around the mean separation location with
 $95\,\%$
fluctuation intensity associated with frequencies below
 $1U_{0}/L_{sep}$
. Furthermore, the wall-pressure signal is strongly intermittent at this location.
Sparsity-promoting dynamic mode decomposition (Jovanović et al.
Reference Jovanović, Schmid and Nichols2014) has proven effective in identifying robust and dynamically important modes of our SWBLI when applied to spanwise-averaged snapshots as well as snapshots of the two-dimensional skin-friction coefficient. Essentially, two types of modes have been found: low-frequency modes (
 $St_{L_{sep}}\approx 0.04$
) primarily involve the shock system, the separated shear layer and the separation bubble as an entity, leading to the classical breathing motion of the recirculating flow together with a forward/backward motion of the shock system. Medium-frequency modes (
 $St_{L_{sep}}\approx 0.5$
) involve shear-layer vortices convected downstream while simultaneously inducing eddy Mach waves in the supersonic part of the flow. Shock corrugation, both for the reattachment and reflected shock, is found to be connected to these frequencies. Low-frequency skin-friction modes include streamwise streaks downstream of the nominal impingement location, which we have identified as footprints of Görtler-like vortices. These vortices cause a large-scale flapping of the reattachment line superimposed on a breathing motion of the separation bubble.
In contrast to experimental observations by Ganapathisubramani et al. (Reference Ganapathisubramani, Clemens and Dolling2009) for a compression corner flow, our modal analysis does not identify any coherent structure of sufficient length (superstructure) upstream of the interaction that could possibly provoke the SWBLI unsteadiness. Our turbulent inflow conditions and domain size limit such structures to a minimum frequency one order of magnitude larger than the observed characteristic frequencies. The scaling analysis of Clemens & Narayanaswamy (Reference Clemens and Narayanaswamy2014) further shows that an upstream mechanism related to momentum fluctuations in the incoming TBL is unlikely responsible for the large-scale separation-shock motion in the present study. Collapse events of the separation bubble as observed by Priebe & Martín (Reference Priebe and Martín2012) for their weak compression corner flow have not been found for our strong SWBLI. Increasing the shock strength and keeping the upstream TBL conditions the same decreases the natural frequency of the SWBLI system and hence reduces its receptive frequency band. Upstream mechanisms cannot explain the observed frequencies for our particular interaction and the quasi-constant Strouhal number found both experimentally and numerically for a wide range of interaction parameters. Our analyses support a mechanism proposed by Touber & Sandham (Reference Touber and Sandham2011) and Grilli et al. (Reference Grilli, Schmid, Hickel and Adams2012), where the low-frequency unsteadiness is an intrinsic property of the interaction. It may not be self-sustaining and thus may require a coherent or incoherent forcing (Touber & Sandham Reference Touber and Sandham2011) originating from upstream or within the interaction zone (Sansica, Sandham & Hu Reference Sansica, Sandham and Hu2014). For our strong high Reynolds number SWBLI the separation-bubble dynamics is clearly coupled to unsteady Görtler-like vortices, which might act as a source for continuous (coherent) forcing of the separation-shock-system dynamics. Interestingly, since the discoveries were made independently of one another, this is the same conclusion as the one drawn by Priebe et al. (Reference Priebe, Tu, Rowley and Martín2016). These authors recently have analysed previous DNS results of Priebe & Martín (Reference Priebe and Martín2012) of a
 $Ma=2.9$
compression corner flow using DMD of spanwise-averaged as well as three-dimensional snapshots. Therein, low-frequency modes are characterised by streamwise-elongated regions of low and high momentum that the authors identified as being induced through Görtler-like vortices. Similar to our results, such vortices are unsteady and move in spanwise direction. While Priebe et al. (Reference Priebe, Tu, Rowley and Martín2016) remain in doubt whether the observed dynamics constitutes an unusual event due to a relatively short time duration captured in their DNS (
 $200\unicode[STIX]{x1D6FF}_{0}/U_{0}$
), our results with a much longer time period of
 $3805\unicode[STIX]{x1D6FF}_{0}/U_{0}$
confirm this assertion. Furthermore, our results show that unsteady large-scale streamwise structures are also present in strong impinging SWBLI.
Acknowledgements
The authors gratefully acknowledge support by the German Research Foundation (Deutsche Forschungsgemeinschaft) in the framework of the Collaborative Research Centre SFB/TRR 40 ‘Fundamental Technologies for the Development of Future Space-Transport-System Components under High Thermal and Mechanical Loads’. Computational resources have been provided by the Leibniz Supercomputing Centre of the Bavarian Academy of Sciences and Humanities (LRZ). We are especially grateful to D. Daub and A. Gülhan from the German Aerospace Centre (Cologne) for providing experimental data.
Supplementary movies
Supplementary movies are available at https://doi.org/10.1017/jfm.2017.308.



