INTRODUCTION
Modular organisms including colonial animals typically have not only opportunities for sexual reproduction but also natural cloning by separation of modules which share the same genome (Harper, Reference Harper, Jackson, Buss and Cook1985). In natural cloning, a ‘genet’ that is derived from a single zygote is split into ‘ramets’ that are the units of clonal growth (Harper, Reference Harper1977). Sessile marine organisms such as scleractinian, alcyonarian, and gorgonian corals, as well as sea anemones frequently produce ramets by fragmentation, fission, and propagation of asexual propagules (e.g. Highsmith, Reference Highsmith1982; Ayre, Reference Ayre1983; Stoddart, Reference Stoddart1983; Lasker, Reference Lasker1990; Mcfadden, Reference McFadden1997; Coffroth & Lasker, Reference Coffroth and Lasker1998; Ayre & Miller, Reference Ayre and Miller2004).
Natural cloning may provide some advantages to a genet by increasing the number of ramets, which could in turn increase long term survival and confer greater life-time reproductive success to that genotype. However, for example in scleractinian corals, there are some disadvantages of colony fragmentation, including an increase in mortality due to injury to the colony and reduced colony size which decreases fecundity (Kojis & Quinn, Reference Kojis and Quinn1985; Rogers et al., Reference Rogers, McLain and Zullo1988; Van Veghel & Bak, Reference van Veghel and Bak1994; Smith & Hughes, Reference Smith and Hughes1999; Zakai et al., Reference Zakai, Levy and Chadwick-Furman2000; Okubo et al., Reference Okubo, Motokawa and Omori2007; Kai & Sakai, Reference Kai and Sakai2008). High mortality was reported in injured colonies due to increasing susceptibility to disease (Bak & Criens, Reference Bak and Criens1981; Rogers et al., Reference Rogers, McLain and Zullo1988). On the other hand, sexual reproduction increases genotypic diversity through recombination and out-crossing.
While mixed modes of sexual and asexual reproduction are likely to be important for some coral species, the degree of genotypic diversity sometimes varies greatly among local populations (Lasker, Reference Lasker1990; Mcfadden, Reference McFadden1997; Coffroth & Lasker, Reference Coffroth and Lasker1998; Whitaker, Reference Whitaker2006). In fact, for some species that frequently produce ramets, local populations consist of a small number of genets even when density, i.e. the number of colonies per unit area, is high at some sites (Ayre & Willis, Reference Ayre and Willis1988; Mcfadden, Reference McFadden1997; Coffroth & Lasker, Reference Coffroth and Lasker1998; Ayre & Hughes, Reference Ayre and Hughes2000; Chen et al., Reference Chen, Wei and Dai2002; Liu et al., Reference Liu, Yu, Fan and Dai2005; Whitaker, Reference Whitaker2006). The factors that have critical influences on the degree of successful asexual reproduction were reported as physical disturbance and historical events (Ayre & Willis, Reference Ayre and Willis1988; Hunter, Reference Hunter1993; Mcfadden, Reference McFadden1997; Coffroth & Lasker, Reference Coffroth and Lasker1998; Ayre & Hughes, Reference Ayre and Hughes2000; Liu et al., Reference Liu, Yu, Fan and Dai2005). For instance, Coffroth & Lasker (Reference Coffroth and Lasker1998) studied the interplay between genetic population structure and disturbance in the gorgonian coral Plexaura kuna across several reef habitats. They found the highest number of fragments and lowest genotypic diversity at intermediate levels of disturbance. Hunter (Reference Hunter1993) studied genotypic diversity in the scleractinian coral Porites compressa in Hawaii along with habitat disturbance history, and suggested that genotypic diversity was related to time since disturbance and the intensity of the impact (highest diversity was found in populations that had been severely or recently disturbed).
The scleractinian coral Montipora capitata is a broadcast spawner, releasing egg/sperm bundles during the summer (Hunter, Reference Hunter1988; Kolinski, Reference Kolinski2004). Even though it accounts for more than 10% of coral cover in Kaneohe Bay (Hunter & Evans, Reference Hunter and Evans1995), recruitment of M. capitata via sexual reproduction is low (Polacheck, Reference Polacheck1978; Jokiel et al., Reference Jokiel, Hildemann and Bigger1983; Fitzhardinge, Reference Fitzhardinge1985). A recent study of settlement of sexually produced M. capitata planulae in Kaneohe Bay found high densities of settlers, but post-settlement survivorship was significantly lower in M. capitata than two other species (Porites compressa and Pocillopora damicornis) (Kolinski, Reference Kolinski2004). In contrast, fragments from M. capitata colonies are commonly observed in Kaneohe Bay, the result of storms or natural bioerosional processes (Jokiel et al., Reference Jokiel, Hildemann and Bigger1983; Cox, Reference Cox1992). Therefore, both sexual and asexual recruitment may contribute to maintenance of this population. However, the relative contribution of sexual and asexual reproduction to recruitment is still unknown largely because there has been little study of population genetic analysis for this species in Kaneohe Bay.
This study aims to describe the degree of fragmentation and the genetic diversity of the scleractinian coral Montipora capitata in Kaneohe Bay. We conducted both ecological and population genetic assessments of M. capitata in exposed and sheltered habitats in Kaneohe Bay. We quantified colony size, cover, density, and attachment state and used allozyme electrophoresis to estimate genetic diversity. We tested the hypothesis that the degree of fragmentation and genotypic diversity vary significantly across habitats even at small scales (a few km).
MATERIALS AND METHODS
Field observations, collection and statistics
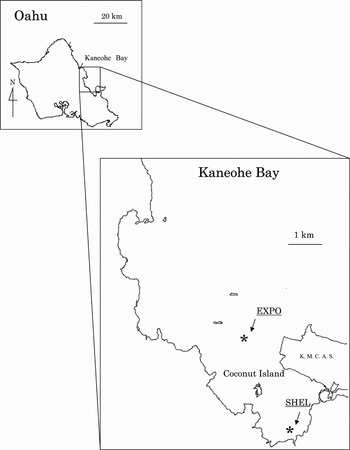
Two habitats were studied (Figure 1); one at the centre (exposed reef edge, hereafter EXPO), and the other at the southern end (sheltered lagoonal reef, SHEL) of Kaneohe Bay. SHEL is located approximately 2 km south-east of EXPO (approximately 2–3 m of depth). Five randomly positioned quadrats (1 × 1 m) were placed in each habitat. Attached and unattached Montipora capitata colonies inside the quadrats were mapped on waterproof paper. The quadrat frames had strings at 10 cm intervals forming a 10 by 10 grid, which helped ensure the accuracy of the maps. There were few problems differentiating between separate colonies in the field using visual characters, e.g. colour, texture, etc. Whole colonies were mapped even if only a part of the colony was inside a quadrat. If a colony did not move when gently touched, it was recorded as attached, and as unattached if it moved. While all unattached colonies arose from fragmentation events, attached colonies could either be from planula settlement, or secondarily reattached fragments. The projected area of each colony was determined by tracing the perimeter of the colony on the map with a digitizing tablet connected to a PC using computer software (SigmaScan Pro, SPSS Inc.). Colony size was expressed as mean diameter by calculating the diameter of a circle, which had the same area as the colony's projected area. Per cent cover of M. capitata within a quadrat was estimated by summing up the projected area of all colonies. If only a part of the colony was inside the quadrat, only the area of the portion which was inside was included. If more than half of the project area of the colony was outside the quadrat, the colony was not included in the density estimate. Statistical tests were conducted using the Mann–Whitney U-test for the number of samples and genotypes, diameter, and coverage between the EXPO and SHEL. In this paper these parameters (size, cover, density and attachment state) are referred to as ‘spatial structure’.
Study habitats in Kaneohe Bay, Hawaii. K. M. C. A. S. is the Kaneohe Marine Corps Air Station. ‘EXPO’ and ‘SHEL’ represent the exposed and sheltered stations, respectively.

Allozyme electrophoresis
A branch tip was collected (approximately 5–10 cm) from each attached and unattached colony found within quadrats (N = 176) for allozyme electrophoresis. The tips with an identification number were kept alive in small plastic bags filled with seawater and brought to the Hawaii Institute of Marine Biology (HIMB) at Coconut Island where the fragments were held in an outdoor holding tank supplied with running seawater. All of the collected samples were frozen and stored at –30ºC for at least 2 hours before allozyme electrophoresis.
Approximately two cm diameter pieces (including approximately 5–6 cm2 live tissue) of the frozen samples (N = 176) were ground in a solution of 0.1% mercaptoethanol, 10% sucrose, 0.1% bromphenol blue, and 0.25 mg ml−1 NADP, and the resulting homogenate was centrifuged at 3000 rpm for 3 minutes. The supernatants were absorbed onto Whatman No. 3 chromatography paper wicks (3 × 10 mm) and then loaded onto gels. Initial screening for genetic variation was conducted with eleven enzyme systems (GPI, G6PDH, HK, LGG, LT, MDH, ME, MPI, PGM, VL and 6PGDH), following the methods of Hillis et al. (Reference Hillis, Moritz and Barbara1996), using horizontal starch gels (10%: at 130–175 V and 22–60 mA for 6–8 hours). Three enzymes showed no detectable activity (G6PDH, MPI and 6PGDH), three were monomorphic (ME, LT and VL) and five were polymorphic (GPI, HK, LGG, MDH and PGM). Of the five polymorphic enzymes, three provided activity that could be consistently resolved: malate dehydrogenase (MDH; E.C. No. 1.1.1.37), phosphoglucomutase (PGM; E.C. No. 5.4.2.2), and leucyl-glycyl-glycine (LGG; E.C. No. 3.4.11). Tris EDTA citrate buffer (pH 7.5) was used for MDH and PGM, and Tris citrate buffer (pH 8.0) was used for LGG (Hillis et al., Reference Hillis, Moritz and Barbara1996).
Statistical analysis
Allele frequencies and departures from Hardy–Weinberg equilibrium (HWE) were analysed using TFPGA software tools for population genetic analysis (Miller, Reference Miller1997). The observed (HO) and expected heterozygosities (HE) were estimated for each locus. Although the HO and HE were estimated for both quadrat and habitat scales (pooled all samples from five quadrats) at SHEL sites, they were estimated for only habitat scale at EXPO because some quadrats had sample sizes that were too small for appropriate tests of departures from HWE. Statistical tests were conducted and sequential Bonferroni's adjustment (Rice, Reference Rice1989) was used for multiple tests of departures from HWE. In addition, two measures were used to assess the possible effects of asexually derived recruits on the genotypic diversity of the collections. First, each colony was assigned to a multi-locus (clonal) genotype. The number of multi-locus genotypes detected (N G), was an estimate of the minimum number of ramets present within a population. The ratio N G:N, where N is the number of colonies collected, provided a simple index of effect of asexual reproduction on genotypic diversity, i.e. if the ratio is high, most colonies have arisen from sexual recruitment. Second, the ratio of observed multi-locus genotypic diversity (G O) to that expected under conditions of sexual reproduction (G E) was calculated following Stoddart & Taylor (Reference Stoddart and Taylor1988). Departure of G O:G E from unity was used as an index of the combined effect of departures from single-locus HWE and multi-locus linkage disequilibrium. A genetically variable population with high levels of asexual recruitment would have a low ratio of observed to expected genotypic diversity. Significance of departures of G O:G E was determined using t-tests (Stoddart & Taylor, Reference Stoddart and Taylor1988). The N G:N was calculated in both quadrat and habitat scales at both EXPO and SHEL. The G O:G E was also calculated in both quadrat and habitat scales at SHEL but only habitat scale in EXPO. In this paper these characteristics of the genetic make-up of the populations are referred to as ‘clonal structure’.
RESULTS
Spatial structure
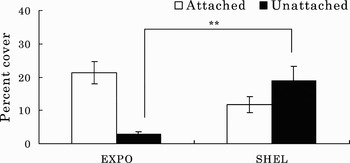
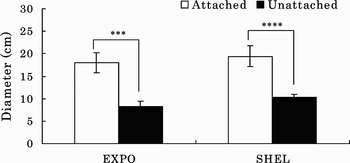
Mean per cent cover of Montipora capitata including attached and unattached colonies did not differ significantly between EXPO and SHEL (24.2±3.6 versus 30.5±4.7%, mean±SE, P > 0.05, Mann–Whitney U-test). While mean per cent cover of attached colonies was not significantly different between EXPO and SHEL (21.3±3.3 versus 11.7±2.4%, P > 0.05; Figure 2), cover of unattached colonies was over six times higher at SHEL (18.9±4.3 versus 2.9±0.8%, P<0.01). Mean colony diameter was significantly greater for attached colonies at both stations relative to unattached colonies (EXPO; 18.0±2.2 versus 8.2±1.2 cm, P < 0.001, SHEL; 19.4±2.3 versus 10.3±0.7, P < 0.0001; Figure 3).
Mean per cent cover of attached (white bar) and unattached (black bar) Montipora capitata colonies. **, P < 0.01.

Mean diameter of attached (white bar) and unattached (black bar) Montipora capitata colonies. ***, P < 0.001; ****, P < 0.0001.

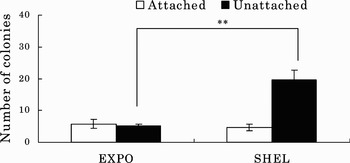
Mean density of all colonies—attached and unattached—was significantly higher at SHEL than at EXPO (24.2±3.1 versus 11.0±1.2 colonies m−2, mean±SE, Mann–Whitney U-test, P < 0.01). Density of attached colonies did not differ significantly between EXPO and SHEL (5.8±1.4 versus 4.6±1.1, colonies m−2, P > 0.05), while density of unattached colonies was significantly higher at SHEL than at EXPO (19.6±3.1 versus 5.2±0.6, P < 0.01; Figure 4).
Mean number of attached (white bar) and unattached (black bar) Montipora capitata colonies. **, P < 0.01.

Allozyme electrophoresis
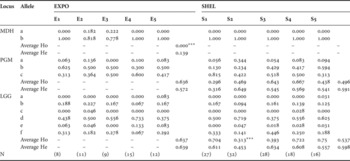
There were two, three and six alleles for MDH, PGM and LGG, respectively (Table 1). The MDH locus was monomorphic for all SHEL corals. Observed heterozygosities (HO) ranged from 0.000 to 0.673 and 0.296 to 0.750 at EXPO and SHEL, respectively. Expected heterozygosities (HE) ranged from 0.139 to 0.639 and 0.316 to 0.649 in EXPO and SHEL, respectively. A significantly different ratio of observed and expected heterozygosities was detected for the MDH locus at EXPO and the LGG locus at quadrat 2 of SHEL (sequential Bonferroni's corrections, P < 0.008).
Allele frequencies, observed and expected heterozygosities under Hardy–Weinberg equilibrium in each locus of ten quadrats (N, sample size of attached and unattached colonies; HO, observed heterozygosities; HE expected hetrozygosities; –, no test; and ***, P <0.001).

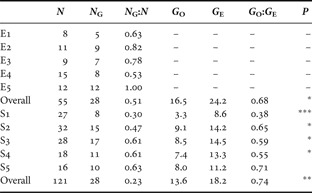
Thirty-seven genotypes from 176 samples were detected with these three loci. EXPO5 was the only quadrat where every coral was of a different genotype. At SHEL 1, only eight genotypes were detected in 27 colonies (Table 2).
Genotypic diversity in each quadrat (N, number of individuals; NG, number of multi-locus genotypes; G O, observed genotypic diversity; G E, expected genotypic diversity; E, exposed; S, sheltered station; –, no test) (t-test for G O:G E, *P < 0.05, **P < 0.01).

The ratio of the number of observed genotypes (N G) to the number of colonies (N) ranged from 0.53 to 1.00 at EXPO, and 0.30 to 0.63 at SHEL (Table 2). The ratio of the observed genetic diversity (G O) to the expected genetic diversity (G E) ranged from 0.38 to 0.71 at SHEL. Observed genotype diversities differed significantly from the expected genotype diversities at SHEL 1, 2, 3, and 4. When data from all quadrats in a habitat were combined there were significant differences between G O and G E at both habitats as well (Table 2).
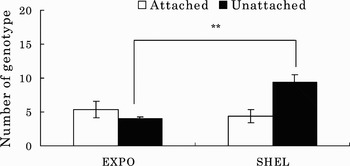
The mean number of genotypes did not differ significantly between EXPO and SHEL (8.2±1.2 versus 12.2±1.7, mean±SE, Mann–Whitney U-test, P > 0.05), but the mean number of genotypes in unattached colonies was significantly higher at SHEL than at EXPO (9.4±1.1 versus 4.0±0.3, mean±SE, Mann–Whitney U-test, P < 0.01; Figure 5).
Mean number of genotypes of attached (white bar) and unattached (black bar) Montipora capitata colonies. **, P < 0.01.

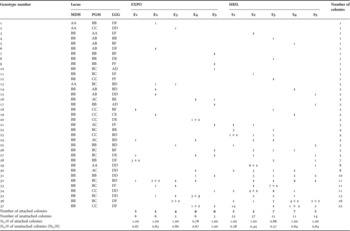
The ratio of the number of observed genotypes (N G) to the number of colonies (N) was not significantly different between attached and unattached colonies at EXPO (Mann–Whitney U-test, P > 0.05; Table 3), but was significantly higher for attached compared with unattached colonies at SHEL (P < 0.01). Additionally, the ratio of N G to N of unattached colonies was significantly higher at EXPO than at SHEL (P < 0.01).
Frequency of observed genotypes in each of the 10 quadrats. Bold numbers represent attached colonies. Genotypic diversity (N G:N, number of genotypes per number of colonies) is shown for attached and unattached colonies.

Although only three loci were used, our results showed that genotypes of unattached colonies often did not correspond to any attached colonies in the same quadrat showing that these unattached colonies came from outside of the quadrat (Table 3).
DISCUSSION
Unattached colonies produced by fragmentation are an important feature of the spatial structure of these Montipora capitata populations, especially at SHEL, in Kaneohe Bay. Our field investigations show that a few large attached and many small, unattached colonies occupied space at SHEL. At EXPO the situation was different in that cover was dominated by large attached colonies. Thus the spatial structure of M. capitata is different in the two habitats in Kaneohe Bay due to the number of unattached colonies produced by fragmentation. Additionally, survival rate of unattached colonies in this species in Kaneohe Bay is 40% per year (Cox, Reference Cox1992), suggesting that fragmentation contributes to maintain the populations in Kaneohe Bay.
Extreme clonal structure—a few genets and many ramets—was not found in these two habitats. This was in spite of the fact that we were able to use only two or three loci. The degree of genotypic diversity of coral species that often produce ramets is generally varied and depends on local populations (e.g. N G:N 0.10 to 0.49 and G O:G E 0.20 to 1.01 in Acropopora valida, Ayre & Hughes, Reference Ayre and Hughes2000; 0.41 to 1.00 and 0.07 to 0.77 in Pocillopora damicornis, Whitaker, Reference Whitaker2006). For instance, extreme clonal structure was reported in certain sites, with a low number of genets and low levels of genetic diversity in local populations. Ayre & Willis (Reference Ayre and Willis1988) found only two distinct genotypes in sixty colonies of the scleractinian coral Pavona cactus in the GBR (N G:N 0.03 and G O:G E 0.02), indicating that genotypic diversity of the population was extremely low. Similarly, highly local clonal structure was reported for the soft corals Alcyonium rudyi (N G:N 0.09, Mcfadden, Reference McFadden1997), Plexauna kuna (N G:N 0.09 and G O:G E 0.03, Coffroth & Lasker, Reference Coffroth and Lasker1998) and Junceella juncea (N G:N 0.05 and G O:G E 0.27, Liu et al., Reference Liu, Yu, Fan and Dai2005). Given that we were able to use only two or three enzymes, some colonies that shared the same 2 or 3-locus genotype may have actually been from different genets. However, even in our most clonal quadrat (S1 in Table 2), N G:N and G O:G E were 0.30 and 0.38, respectively. These results suggest that relatively high numbers of genets were maintained in M. capitata populations in Kaneohe Bay compared to the extremely clonal structures mentioned above, even based on our minimum estimation using three loci.
Sexually produced new genets from recruitment events attributed to relatively high genotypic diversity in M. capitata in Kaneohe Bay compared to the extremely clonal situations reported for some species. The southern sections of Kaneohe Bay showed very little sexual recruitment to new substrates in this species (Polacheck, Reference Polacheck1978; Jokiel et al., Reference Jokiel, Hildemann and Bigger1983). Additionally, post-settlement survivorship of M. capitata larvae was low (Kolinski, Reference Kolinski2004). Our results demonstrated relatively high genotypic diversity of M. capitata populations in Kaneohe Bay, which indicated that some sexual recruitment contributed to maintaining the local population in the Kaneohe Bay. Since sexual recruitment occurs in many years, even if survival of new recruits is low, this process could contribute to the genotypic diversity detected in this study.
It is unlikely that fragments reattach in the shifting sand and rubble covered areas in the two habitats we studied. Also most plate-like fragments are dead on the underside, so reattachment by the coral is not likely even on firmer substrata. Our results indicated that higher numbers of unattached colonies and low genotypic diversity found at SHEL than at EXPO where we expected higher water motion might enhance breakage. Factors such as fragment production rate and survivorship, reestablishment, and movement of fragments, are likely to have influenced our results of the number of fragments and genotypic diversity, but most critical factors are unknown. Our data found very few shared genotypes among attached colonies within quadrats even with the three loci we had available.
ACKNOWLEDGEMENTS
The authors are indebted to the staff of the Hawaii Institute of Marine Biology (HIMB), University of Hawaii. We thank E.F. Cox and two anonymous referees for valuable suggestions and comments on the earlier version of this manuscript. This study was partially supported by a grant from JSPS (Bilateral Joint Projects) to K.S. and by the 21st Century COE programme of the University of the Ryukyus.