





%20--%3e%3c!DOCTYPE%20svg%20PUBLIC%20'-//W3C//DTD%20SVG%201.0//EN'%20'http://www.w3.org/TR/2001/REC-SVG-20010904/DTD/svg10.dtd'%3e%3csvg%20version='1.0'%20id='Layer_1'%20xmlns='http://www.w3.org/2000/svg'%20xmlns:xlink='http://www.w3.org/1999/xlink'%20x='0px'%20y='0px'%20width='64px'%20height='64px'%20viewBox='5.5%20-3.5%2064%2064'%20enable-background='new%205.5%20-3.5%2064%2064'%20xml:space='preserve'%3e%3cg%3e%3ccircle%20fill='%23FFFFFF'%20fill-opacity='0'%20cx='37.785'%20cy='28.501'%20r='28.836'/%3e%3cpath%20fill='%23595959'%20d='M37.441-3.5c8.951,0,16.572,3.125,22.857,9.372c3.008,3.009,5.295,6.448,6.857,10.314%20c1.561,3.867,2.344,7.971,2.344,12.314c0,4.381-0.773,8.486-2.314,12.313c-1.543,3.828-3.82,7.21-6.828,10.143%20c-3.123,3.085-6.666,5.448-10.629,7.086c-3.961,1.638-8.057,2.457-12.285,2.457s-8.276-0.808-12.143-2.429%20c-3.866-1.618-7.333-3.961-10.4-7.027c-3.067-3.066-5.4-6.524-7-10.372S5.5,32.767,5.5,28.5c0-4.229,0.809-8.295,2.428-12.2%20c1.619-3.905,3.972-7.4,7.057-10.486C21.08-0.394,28.565-3.5,37.441-3.5z%20M37.557,2.272c-7.314,0-13.467,2.553-18.458,7.657%20c-2.515,2.553-4.448,5.419-5.8,8.6c-1.354,3.181-2.029,6.505-2.029,9.972c0,3.429,0.675,6.734,2.029,9.913%20c1.353,3.183,3.285,6.021,5.8,8.516c2.514,2.496,5.351,4.399,8.515,5.715c3.161,1.314,6.476,1.971,9.943,1.971%20c3.428,0,6.75-0.665,9.973-1.999c3.219-1.335,6.121-3.257,8.713-5.771c4.99-4.876,7.484-10.99,7.484-18.344%20c0-3.543-0.648-6.895-1.943-10.057c-1.293-3.162-3.18-5.98-5.654-8.458C50.984,4.844,44.795,2.272,37.557,2.272z%20M37.156,23.187%20l-4.287,2.229c-0.458-0.951-1.019-1.619-1.685-2c-0.667-0.38-1.286-0.571-1.858-0.571c-2.856,0-4.286,1.885-4.286,5.657%20c0,1.714,0.362,3.084,1.085,4.113c0.724,1.029,1.791,1.544,3.201,1.544c1.867,0,3.181-0.915,3.944-2.743l3.942,2%20c-0.838,1.563-2,2.791-3.486,3.686c-1.484,0.896-3.123,1.343-4.914,1.343c-2.857,0-5.163-0.875-6.915-2.629%20c-1.752-1.752-2.628-4.19-2.628-7.313c0-3.048,0.886-5.466,2.657-7.257c1.771-1.79,4.009-2.686,6.715-2.686%20C32.604,18.558,35.441,20.101,37.156,23.187z%20M55.613,23.187l-4.229,2.229c-0.457-0.951-1.02-1.619-1.686-2%20c-0.668-0.38-1.307-0.571-1.914-0.571c-2.857,0-4.287,1.885-4.287,5.657c0,1.714,0.363,3.084,1.086,4.113%20c0.723,1.029,1.789,1.544,3.201,1.544c1.865,0,3.18-0.915,3.941-2.743l4,2c-0.875,1.563-2.057,2.791-3.541,3.686%20c-1.486,0.896-3.105,1.343-4.857,1.343c-2.896,0-5.209-0.875-6.941-2.629c-1.736-1.752-2.602-4.19-2.602-7.313%20c0-3.048,0.885-5.466,2.658-7.257c1.77-1.79,4.008-2.686,6.713-2.686C51.117,18.558,53.938,20.101,55.613,23.187z'/%3e%3c/g%3e%3c/svg%3e)
%20--%3e%3c!DOCTYPE%20svg%20PUBLIC%20'-//W3C//DTD%20SVG%201.0//EN'%20'http://www.w3.org/TR/2001/REC-SVG-20010904/DTD/svg10.dtd'%3e%3csvg%20version='1.0'%20id='Layer_1'%20xmlns='http://www.w3.org/2000/svg'%20xmlns:xlink='http://www.w3.org/1999/xlink'%20x='0px'%20y='0px'%20width='64px'%20height='64px'%20viewBox='5.5%20-3.5%2064%2064'%20enable-background='new%205.5%20-3.5%2064%2064'%20xml:space='preserve'%3e%3cg%3e%3ccircle%20fill='%23FFFFFF'%20fill-opacity='0'%20cx='37.637'%20cy='28.806'%20r='28.276'/%3e%3cg%3e%3cpath%20fill='%23595959'%20d='M37.443-3.5c8.988,0,16.57,3.085,22.742,9.257C66.393,11.967,69.5,19.548,69.5,28.5c0,8.991-3.049,16.476-9.145,22.456%20C53.879,57.319,46.242,60.5,37.443,60.5c-8.649,0-16.153-3.144-22.514-9.43C8.644,44.784,5.5,37.262,5.5,28.5%20c0-8.761,3.144-16.342,9.429-22.742C21.101-0.415,28.604-3.5,37.443-3.5z%20M37.557,2.272c-7.276,0-13.428,2.553-18.457,7.657%20c-5.22,5.334-7.829,11.525-7.829,18.572c0,7.086,2.59,13.22,7.77,18.398c5.181,5.182,11.352,7.771,18.514,7.771%20c7.123,0,13.334-2.607,18.629-7.828c5.029-4.838,7.543-10.952,7.543-18.343c0-7.276-2.553-13.465-7.656-18.571%20C50.967,4.824,44.795,2.272,37.557,2.272z%20M46.129,20.557v13.085h-3.656v15.542h-9.944V33.643h-3.656V20.557%20c0-0.572,0.2-1.057,0.599-1.457c0.401-0.399,0.887-0.6,1.457-0.6h13.144c0.533,0,1.01,0.2,1.428,0.6%20C45.918,19.5,46.129,19.986,46.129,20.557z%20M33.042,12.329c0-3.008,1.485-4.514,4.458-4.514s4.457,1.504,4.457,4.514%20c0,2.971-1.486,4.457-4.457,4.457S33.042,15.3,33.042,12.329z'/%3e%3c/g%3e%3c/g%3e%3c/svg%3e)
1. Introduction
The classic description of the energy cascade in turbulence postulates that kinetic energy originates from forcing large-scale eddies, is transferred subsequently to smaller-scale eddies (forward cascade), and is dissipated eventually due to viscous effects (Richardson Reference Richardson1922; Kolmogorov Reference Kolmogorov1941). In a statistical sense, the sign and magnitude of third-order moments of velocity increments confirm this general direction of the energy cascade, as described by the  $4/5$ law governing the global average of the third-order longitudinal velocity increment (Kolmogorov Reference Kolmogorov1941; Frisch Reference Frisch1995),
 $\langle \delta u_L(\ell )^3 \rangle \equiv \langle ( [{\boldsymbol {u}}({\boldsymbol {x}}+\boldsymbol {\ell }) - {\boldsymbol {u}}({\boldsymbol {x}})]\boldsymbol {\cdot } {{\boldsymbol {\ell }}/ \ell } )^3 \rangle =- \frac {4}{5} \ell \langle \epsilon \rangle$, where
 $\langle \cdot \rangle$ denotes global averaging,
 $\delta u_L(\ell )$ is the longitudinal velocity increment, and
 $\epsilon$ is the viscous dissipation rate, while the displacement
 $\ell =|{\boldsymbol {\ell }}|$ is assumed to be well inside the inertial range of turbulence. In this sense, the quantity
 $-\frac {5}{4}\langle \delta u_L(\ell )^3 \rangle /\ell$ is often interpreted as a measure of the energy flux going from scales larger than
 $\ell$ to all smaller scales. Because turbulence is known to be highly intermittent in space and time (Kolmogorov Reference Kolmogorov1962; Meneveau & Sreenivasan Reference Meneveau and Sreenivasan1991; Frisch Reference Frisch1995), there has also been much interest in characterizing the local properties of the energy cascade, i.e. the fluctuations of the energy flux before averaging. However, without statistical averaging, the
 $4/5$ law is less meaningful, e.g. the quantity
 $-\frac {5}{4} \delta u_L^3 /\ell$ cannot simply be interpreted as an energy flux locally in space and time. To enable such interpretation, it is necessary to consider explicit angular averaging over all possible directions of the vector
 $\boldsymbol {\ell }$. Such formulations have been developed in prior works by Duchon & Robert (Reference Duchon and Robert2000), Eyink (Reference Eyink2002) and Hill (Reference Hill2001, Reference Hill2002). Duchon & Robert (Reference Duchon and Robert2000) and Eyink (Reference Eyink2002) use such equations to study the energy cascade and energy dissipation in the limit of zero viscosity. A review about extensions to the classic Kolmogorov equation is presented by Dubrulle (Reference Dubrulle2019), focusing specifically on the Duchon & Robert (Reference Duchon and Robert2000) local formulation.
Hill (Reference Hill2001, Reference Hill2002) developed a local version of the Kolmogorov equation in which the reference position  ${\boldsymbol {x}}$ is located symmetrically halfway between the two points
 ${\boldsymbol {x}}+{\boldsymbol {r}}/2$ and
 ${\boldsymbol {x}}-{\boldsymbol {r}}/2$ separated by
 ${\boldsymbol {r}}$ over which the velocity increment is computed. This equation, which we will denote as the Kolmogorov–Hill (KH) equation – sometimes also called the Kármán–Howarth–Monin–Hill (Danaila et al. Reference Danaila, Krawczynski, Thiesset and Renou2012; Yasuda & Vassilicos Reference Yasuda and Vassilicos2018) or generalized Kolmogorov (Marati, Casciola & Piva Reference Marati, Casciola and Piva2004) equation) – describes the evolution of the second-order (squared) velocity difference, a measure of energy content of all scales smaller than
 $|\boldsymbol {r}|$ at a specific physical position
 $\boldsymbol {x}$. As will be reviewed in § 2, scale-space integration over
 ${\boldsymbol {r}}$ of the KH equation up to some scale
 $\ell$ in the inertial range and without additional statistical averaging provides a localized description of the energy cascade process (Hill Reference Hill2002; Yasuda & Vassilicos Reference Yasuda and Vassilicos2018). The KH equation also includes effects of viscous dissipation, viscous diffusion, advection and pressure. A number of prior works have studied various versions of the KH equation. For isotropic turbulence, Yasuda & Vassilicos (Reference Yasuda and Vassilicos2018) quantified the variability of the energy flux that arises in this equation, while Carbone & Bragg (Reference Carbone and Bragg2020) considered a definition of mean energy flux approximated based on solenoidal filtered velocity increments, and examined its connections to average vortex and strain stretching rates. Besides applications to isotropic homogeneous flow, numerous studies have investigated the application of the statistically averaged KH equation to spatially non-homogeneous flows. For instance, in wall-bounded flows, researchers have explored the energy cascade using a Reynolds decomposition to isolate effects of mean shear and non-homogeneity (Antonia et al. Reference Antonia, Zhou, Danaila and Anselmet2000; Danaila et al. Reference Danaila, Anselmet, Zhou and Antonia2001, Reference Danaila, Krawczynski, Thiesset and Renou2012; Danaila, Anselmet & Zhou Reference Danaila, Anselmet and Zhou2004; Marati et al. Reference Marati, Casciola and Piva2004; Cimarelli, De Angelis & Casciola Reference Cimarelli, De Angelis and Casciola2013). Investigations have also studied the energy cascade rates in boundary layer bypass transition (Yao, Mollicone & Papadakis Reference Yao, Mollicone and Papadakis2022) and flow separation (Mollicone et al. Reference Mollicone, Battista, Gualtieri and Casciola2018). Furthermore, specific attention has been given to the study of inverse cascade in wake flows (Gomes-Fernandes, Ganapathisubramani & Vassilicos Reference Gomes-Fernandes, Ganapathisubramani and Vassilicos2015; Portela, Papadakis & Vassilicos Reference Portela, Papadakis and Vassilicos2017) and at turbulent/non-turbulent interfaces (Zhou & Vassilicos Reference Zhou and Vassilicos2020; Cimarelli et al. Reference Cimarelli, Mollicone, Van Reeuwijk and De Angelis2021; Yao & Papadakis Reference Yao and Papadakis2023).
The notion of transfer, or flux, of kinetic energy across length scales is of particular practical interest also in the context of large eddy simulations (LES). There, the rate of energy cascade is referred to commonly as the subgrid-scale (SGS) or subfilter-scale (SFS) rate of dissipation. It is defined as the contraction between the subgrid stress tensor and the filtered strain-rate tensor, and arises as a source term in the transport equation for SGS/SFS kinetic energy (Piomelli et al. Reference Piomelli, Cabot, Moin and Lee1991; Meneveau & Katz Reference Meneveau and Katz2000). This quantity characterizes the energy transfers between the resolved scale and the residual scale within the inertial range, which is also a local property (Eyink & Aluie Reference Eyink and Aluie2009). The SGS dissipation is highly intermittent (Cerutti & Meneveau Reference Cerutti and Meneveau1998), and can be both positive and negative locally, but on average, energy is known to be transferred from large scales to the residual scales (forward cascade). There is a considerable literature on the subject, starting from the seminal papers by Lilly (Reference Lilly1967), Leonard (Reference Leonard1975) and Piomelli et al. (Reference Piomelli, Cabot, Moin and Lee1991). Some reviews include Meneveau & Katz (Reference Meneveau and Katz2000), Meneveau (Reference Meneveau2010) and Moser, Haering & Yalla (Reference Moser, Haering and Yalla2021).
Without averaging, it has been a common observation that the SGS/SFS dissipation can be negative, which has often been interpreted as indicative of local inverse cascading of kinetic energy, i.e. energy transfer from small to large scales of motion (‘backscatter’; Piomelli et al. Reference Piomelli, Cabot, Moin and Lee1991). Borue & Orszag (Reference Borue and Orszag1998) noted that the forward cascade occurs predominantly in regions characterized by strong straining, where the magnitude of negative skewness of the strain tensor and vortex stretching are large. Conversely, backscatter was observed in regions with strong rotation. The relationship between SGS dissipation and stress topology and stress–strain alignment geometry was discussed and measured based on three-dimensional (3-D) particle image velocimetry measurements by Tao, Katz & Meneveau (Reference Tao, Katz and Meneveau2002). In a more recent study, Ballouz & Ouellette (Reference Ballouz and Ouellette2018) investigated the SGS tensor by considering the relative alignment of the filtered shear stress and strain tensors. They found that the energy cascade efficiency is quite low, a trend that they attributed to energy being transferred largely between positions in physical space. Quantitatively, in expressing the subgrid stress tensor as a superposition of all smaller-scale Gaussian-filtered velocity gradients, Johnson (Reference Johnson2020, Reference Johnson2021) was able to isolate the relative contributions of small-scale strain self-stretching and vortex stretching, finding both to be important.
It has been questioned whether it is the local quantity  $-\tau _{ij}\tilde {S}_{ij}$ (where
 $\tau _{ij}$ and
 $\tilde {S}_{ij}$ are the SGS stress and resolved strain-rate tensors, respectively) or the work done by the SGS/SFS force,
 $\tilde {u}_i\,\partial _j\tau _{ij}$ (where
 $\tilde {u}_i$ is the resolved velocity) that should be the genuine definition of local energy cascade rate. For instance, Kerr, Domaradzki & Barbier (Reference Kerr, Domaradzki and Barbier1996) used the latter in their study of correlations of cascade rate and vorticity, and more recently Vela-Martín & Jiménez (Reference Vela-Martín and Jiménez2021) used both quantities in their analysis. Moreover, the SGS force plays a central role for optimal LES modelling (Langford & Moser Reference Langford and Moser1999). The SGS force is invariant to divergence-free tensor fields, which therefore do not affect the large-scale dynamics, but certainly addition of such a tensor field to
 $\tau _{ij}$ can affect the usual definition of SGS dissipation
 $-\tau _{ij}\tilde {S}_{ij}$. By re-expressing the SGS stress and dissipation terms using an optimization procedure, Vela-Martín (Reference Vela-Martín2022) provided arguments that the often observed backscatter does not actually contribute to the energy cascade between scales but rather to the energy flux in the physical space, also suggesting that backscatter does not need to be modelled explicitly in LES.
As can be seen from this partial summary of the literature on backscatter and inverse cascade in the LES filtering approach, no consensus has been reached regarding the possible importance and physical interpretation of local backscatter using the definition based on the inner product of the subgrid stress and filtered strain-rate tensors. Also, the question of inverse cascade has not received much attention from the point of view of the local versions of the Kolmogorov equation in the structure-function approach. Therefore, in this paper we first revisit the generalized local structure-function formulation (§ 2.1). We argue that in this formulation, the term responsible for the energy cascade can be interpreted unambiguously as a flux of kinetic energy between scales since it appears inside a divergence in scale space. In this sense, it differs from the filtering formulation used in LES (reviewed in § 2.2) in which typically a fixed filter scale is used and no change in scales is considered, thus making the concept of a ‘flux in scale space’ less clearly defined and open to various interpretations.
With the definition of local cascade rate or energy flux clarified for the structure-function approach, we perform a comparative study of both the structure-function and filtering approaches’ energy flux terms in a relatively high Reynolds number direct numerical simulation (DNS) database of forced isotropic turbulence at a Taylor-scale Reynolds number 1250. The data analysis is greatly facilitated by the availability of these data in a new version of the Johns Hopkins Turbulence Database (JHTDB) system, in which Python notebooks access the data directly (see Appendix A). The comparisons involve various statistical properties of the energy flux. First, in § 3 we provide comparisons of both quantities by means of simple statistical measures such as their mean values, joint probability density distributions and correlation coefficients, comparing both the two definitions of kinetic energy and kinetic energy cascade rate or flux. We then examine comparatively conditional averages based on the local molecular dissipation rate averaged over a ball of size  $\ell$, specifically re-examining the Kolmogorov refined similarity hypothesis (KRSH) in § 4. Then in § 5 we present comparative conditional averages of kinetic energy flux based on properties of the large-scale velocity gradient field such as the strain- and rotation-rate magnitudes, and the
 $Q$ and
 $R$ invariants. Particular attention is paid to events of local negative energy flux and whether or not such events can be considered to be of statistical significance. Overall conclusions are presented in § 6.
2. Local energy flux in the structure-function and filtering approaches
In this section, both the structure-function-based (KH equation) and filtering (LES) energy equations are reviewed. We focus on the term representing energy cascade (energy flux) in each equation, and describe some of the prior efforts in the literature relating the structure-function and filtering approaches.
2.1. Energy cascade rate/flux in the scale-integrated local KH equation
The KH equation is a generalized Kármán–Howarth equation that is derived directly from the incompressible Navier–Stokes equations without any modelling. Before averaging, the instantaneous KH equation with no mean flow and neglecting the forcing term reads (Hill Reference Hill2001, Reference Hill2002)
 \begin{equation} \frac{\partial \delta u _i^2}{\partial t} + u^*_{j}\,\frac{\partial \delta u _i^2}{\partial x_j} =-\frac{\partial \delta u _j\,\delta u _i^2}{\partial r_j}-\frac{8}{\rho}\,\frac{\partial p^*\,\delta u _i}{\partial r_i} +\nu\,\frac{1}{2}\,\frac{\partial^2 \delta u _i^2}{\partial x_j\,\partial x_j }+ 2\nu\,\frac{\partial^2 \delta u _i^2}{\partial r_j\,\partial r_j} - 4\epsilon^*, \end{equation}
where  $\delta u_i = \delta u_i({\boldsymbol {x}},{\boldsymbol {r}}) = u_i^+ - u_i^-$ is the velocity increment vector in the
 $i{\textrm {th}}$ Cartesian direction over displacement vector
 ${\boldsymbol {r}}$. The superscripts
 $+$ and
 $-$ represent two points,
 ${\boldsymbol {x}}+{\boldsymbol {r}}/2$ and
 ${\boldsymbol {x}}-{\boldsymbol {r}}/2$, in the physical domain that have a separation vector
 $r_i = x^+_i - x^-_i$ and middle point
 $x_i = (x^+_i + x^-_i)/2$ (see figure 1a). The superscript
 $*$ denotes the average value between two points, e.g. the two-point average dissipation is defined as
 $\epsilon ^*({\boldsymbol {x}},{\boldsymbol {r}}) = (\epsilon ^+ +\epsilon ^-)/2$, and
 $\epsilon ^\pm$ here is the ‘pseudo-dissipation’ defined at every point as
 $\epsilon =\nu ({\partial u_i}/{\partial x_j})^2$. (In Hill (Reference Hill2002), an alternate expression involving the real dissipation was introduced – his (2.13) – at the cost of including an additional pressure term.) Note that throughout this paper, when referring to ‘dissipation’ we will mean the pseudo-dissipation. Also, we will use
 ${\boldsymbol {r}}_s = {\boldsymbol {r}}/2$ to denote the radial coordinate vector from the local ‘origin’
 ${\boldsymbol {x}}$.
(a) Sketch showing local domain of integration over a ball of diameter  $\ell$ used in the symmetric Hill (Reference Hill2002) structure-function approach in which pairs of points separated by distances
 $r=2r_s$ up to
 $\ell$ are used. (b) Integration up to a ball of radius
 $\ell$ in which pairs of points separated by distances
 $r$ up to
 $\ell$ are used as in the approach of Duchon & Robert (Reference Duchon and Robert2000). For volume averaging, in (a) 3-D integration over the vector
 ${\boldsymbol {r}}_s$ is performed at fixed
 ${\boldsymbol {x}}$, while in (b) 3-D integration over the vector
 ${\boldsymbol {r}}$ is performed at fixed
 ${\boldsymbol {x}}$. For surface integrations, in (a) integration is done over the spherical surface of radius
 $\ell /2$, while in (b) it is done over a spherical surface of radius
 $\ell$.

As remarked by Hill (Reference Hill2001, Reference Hill2002), it is then instructive to apply integration over a sphere in  ${\boldsymbol {r}}_s$-space up to a radius
 $\ell /2$, i.e. over a sphere of diameter
 $\ell$. The resulting equation is divided by the sphere volume
 $V_\ell =\frac {4}{3}{\rm \pi} ( {\ell }/{2})^3$ and a factor 4, and Gauss’ theorem is used for the
 ${\boldsymbol {r}}$-divergence terms (recalling that
 $\partial {\boldsymbol {r}}=2\,\partial {\boldsymbol {r}}_s$), yielding
 \begin{align} &\frac{1}{2 V_\ell}\mathop{\iiint}\limits_{V_{\ell}} \left(\frac{\partial \delta u_i^2/2}{\partial t} + u^*_{j}\, \frac{\partial \delta u _i^2/2}{\partial x_j} \right) {\rm d}^3{\boldsymbol{r}}_s\nonumber\\ &\quad =-\frac{3}{4\ell}\,\frac{1}{S_\ell}\oint_{S_{\ell}} \delta u _i^2\,\delta u _j\,\hat{n}_j \,{\rm d}S - \frac{6}{\rho \ell}\,\frac{1}{S_\ell}\oint_{S_{\ell}}p^*\,\delta u _j\,\hat{n}_j \,{\rm d}S \nonumber\\ &\qquad + \frac{\nu}{4}\,\frac{1}{V_\ell}\iiint\limits_{V_{\ell}}\left(\frac{1}{2}\,\frac{\partial^2 \delta u_i^2}{\partial x_j\,\partial x_j } + 2\,\frac{\partial^2 \delta u_i^2}{\partial r_j\,\partial r_j} \right) {\rm d}^3{\boldsymbol{r}}_s - \frac{1}{V_\ell}\iiint\limits_{V_{\ell}} \epsilon^* \,{\rm d}^3{\boldsymbol{r}}_s, \end{align}
where  $S_\ell$ represents the bounding sphere's surface of area
 $S_\ell = 4{\rm \pi} (\ell /2)^2$, and
 $\hat {n}_j$ is the radial unit vector normal to the sphere surface. Equation (2.2) suggests defining a structure-function-based kinetic energy at scale
 $\ell$ according to
 \begin{equation} k_{{sf},\ell}({\boldsymbol{x}},t) = \frac{1}{2 V_\ell}\iiint\limits_{V_{\ell}} \frac{1}{2}\,\delta u _i^2({\boldsymbol{x}},{\boldsymbol{r}}) \, {\rm d}^3{\boldsymbol{r}}_s, \end{equation}
so that the first term in (2.2) corresponds to  $\partial k_{{sf},\ell }/\partial t$. The
 $1/2$ factor in front of the integral is justified since the volume integration over the entire sphere will double count the energy contained in
 $\delta u _i^2 = (u_i^+ - u_i^-)^2$. Equation (2.2) thus describes the transport of two-point, structure-function energy
 $k_{{sf},\ell }$, which represents energy within eddies with length scales up to
 $\ell$ (Davidson Reference Davidson2015) in both the length scale
 $\ell$ and physical position
 $\boldsymbol {x}$ spaces. The last term in (2.2) represents the
 $r$-averaged rate of dissipation, with the radius vector
 ${\boldsymbol {r}}_s = {\boldsymbol {r}}/2$ being integrated up to magnitude
 $\ell /2$:
 \begin{equation} \epsilon_\ell({\boldsymbol{x}},t) \equiv \frac{1}{V_\ell}\iiint\limits_{V_{\ell}} \epsilon^*({\boldsymbol{x}},{\boldsymbol{r}}) \, {\rm d}^3{\boldsymbol{r}}_s. \end{equation}
As remarked by Hill (Reference Hill2001, Reference Hill2002), this quantity corresponds directly to the spherical average of local dissipation at scale  $\ell$, and plays a central role in the celebrated KRSH (Kolmogorov Reference Kolmogorov1962).
The local energy cascade rate in the inertial range at position  ${\boldsymbol {x}}$ and time
 $t$ is defined as
 \begin{equation} \varPhi_\ell({\boldsymbol{x}},t) \equiv-\frac{3}{4\ell}\,\frac{1}{S_\ell}\oint_{S_{\ell}} \delta u _i^2\,\delta u _j\,\hat{n}_j \, {\rm d}S =-\frac{3}{4\ell}\,[\delta u_i^2\,\delta u_j\,\hat{n}_j ]_{S_\ell}, \end{equation}
where  $[\cdot ]_{S_\ell }$ indicates area averaging over the sphere of diameter
 $\ell$. We note that in this definition,
 $\varPhi _\ell ({\boldsymbol {x}},t)$ represents the surface average of a flux that is defined positive if energy is flowing into the sphere in the
 ${\boldsymbol {r}}$-scale space. The position is fixed at
 ${\boldsymbol {x}}$, thus the quantity
 $\varPhi _\ell ({\boldsymbol {x}},t)$ does not contain possible confounding spatial transport effects.
In terms of the overall average of (2.2), under the assumptions of homogeneous isotropic flow and statistical steady-state conditions, and for  $\ell$ in the inertial range of turbulence, the unsteady transport and viscous terms vanish. The pressure term is also zero due to isotropy and incompressibility. Therefore, (2.2) can be simplified and yields, as expected,
 \begin{equation} \langle \varPhi_\ell \rangle = \langle \epsilon_\ell \rangle=\langle \epsilon \rangle, \end{equation}
or equivalently,  $[\delta u_i^2\,\delta u_j\,\hat {n}_j ]_{S_\ell }=-(4/3)\ell \langle \epsilon \rangle$, the
 $4/3$ law (Frisch Reference Frisch1995).
In this paper, the focus will be mainly on the flux term  $\varPhi _\ell$, with some attention also on the dissipation term
 $\epsilon _\ell$. Analysis of the time derivative, spatial advection terms and pressure terms is left for other ongoing studies. The viscous flux terms (in both spatial and scale spaces) are also not considered, since our present interest concerns the inertial range.
2.2. Energy cascade rate/flux in the filtering approach
In this subsection, we review the transport equation of the SGS kinetic energy (Germano Reference Germano1992) for  $k_{{sgs},\ell } \equiv \frac {1}{2} \tau _{ii}$, where
 $\tau _{ij}=\widetilde {u_i u_j} - \tilde {u}_i \tilde {u}_j$ is the SGS stress tensor, with the tilde symbol
 $(\sim )$ denoting spatial filtering of variables. The transport equation for
 $k_{{sgs},\ell }$ reads (Germano Reference Germano1992)
 \begin{align} \frac{\partial k_{{sgs},\ell}}{\partial t} + \tilde{u}_j\,\frac{\partial k_{{sgs},\ell} }{\partial x_j}&=-\frac{1}{2}\,\frac{\partial}{\partial x_j}\left(\widetilde{u_i u_i u_j}- 2\tilde{u}_i\,\widetilde{u_i u_j}-\tilde{u}_j\,\widetilde{u_i u_i}-\tilde{u}_i \tilde{u}_i \tilde{u}_j\right) -\frac{\partial}{\partial x_j}\left( \widetilde{p u_j} - \tilde{p}\tilde{u}_j \right)\nonumber\\ &\quad +\frac{\partial}{\partial x_j}\left( \nu\,\frac{\partial k_{{sgs},\ell} }{\partial x_j} \right) + \nu\,\frac{\partial \tilde{u}_i}{\partial x_j}\,\frac{\partial \tilde{u}_i}{\partial x_j} -\nu\,\widetilde{\frac{\partial u_i}{\partial x_j}\,\frac{\partial u_i}{\partial x_j}} -\tau_{ij}\tilde{S}_{ij} . \end{align}
The last term is called the SGS rate of dissipation at position  $({\boldsymbol {x}})$, and is often denoted as
 \begin{equation} \varPi_\ell({\boldsymbol{x}},t) \equiv-\tau_{ij}\tilde{S}_{ij}. \end{equation}
For filtering, in the present work, we consider a spherical-shaped sharp top-hat filter in physical space with diameter  $\ell$. Therefore, for any field variable
 $A({\boldsymbol {x}})$, we define the filtered variable as
 $\tilde {A}({\boldsymbol {x}}) = {V_\ell }^{-1}\iiint _{V_{\ell }} A({\boldsymbol {x}}+{\boldsymbol {r}}_s) \, {\rm d}^3{\boldsymbol {r}}_s$. Note that each term in (2.2) and (2.7) is thus evaluated at the same length scale. Terms in (2.7) can be compared directly to terms in (2.2); in particular, the local dissipation terms are exactly the same, i.e.
 \begin{equation} -\!\nu\,\widetilde{\frac{\partial u_i}{\partial x_j}\,\frac{\partial u_i}{\partial x_j}} =-\frac{1}{V_\ell}\iiint\limits_{V_{\ell}} \nu\,\frac{\partial u_i}{\partial x_j}\,\frac{\partial u_i}{\partial x_j} \,{\rm d}^3{\boldsymbol{r}}_s = \epsilon_\ell({\boldsymbol{x}},t). \end{equation}
Again, for homogeneous steady-state turbulence in the inertial range (neglecting viscous diffusion and resolved dissipation terms), upon averaging, (2.7) simplifies to
 \begin{equation} \langle \varPi_\ell \rangle = \langle \epsilon_\ell \rangle =\langle \epsilon \rangle, \end{equation}
which is similar to (2.6); thus on average, certainly the two definitions of energy cascade rate/flux agree with each other, i.e.  $\langle \varPi _\ell \rangle = \langle \varPhi _\ell \rangle$.
It is also of interest to compare the average value of the two definitions of kinetic energy used in both definitions of energy cascade rate/flux. In the inertial range of high Reynolds number turbulence, both  $\langle k_{{sf},\ell }\rangle$ and
 $\langle k_{{sgs},\ell }\rangle$ can be evaluated based on the Kolmogorov
 $r^{2/3}$ law and
 $k^{-5/3}$ spectrum, respectively. The result is (see Appendix B for details)
 $\langle k_{{sf},\ell } \rangle \approx 1.6 \, \langle \epsilon \rangle ^{2/3} \ell ^{2/3}$ and
 $\langle k_{{sgs},\ell }\rangle \approx 1.2 \, \langle \epsilon \rangle ^{2/3} \ell ^{2/3}$. In other words, they are of similar order of magnitude but the SGS kinetic energy is slightly smaller.
2.3. Other relationships between the structure-function and filtering approaches
In the present paper, we will perform the data analysis and comparisons using the two approaches mentioned above (scale-integrated local KH and filtering formulations). However, it is useful at this stage to include some remarks regarding other structure-function and energy definitions used in earlier works by Vreman, Geurts & Kuerten (Reference Vreman, Geurts and Kuerten1994), Constantin, Weinan E & Titi (Reference Constantin, Weinan and Titi1994), Duchon & Robert (Reference Duchon and Robert2000), Eyink (Reference Eyink2002) and Dubrulle (Reference Dubrulle2019). Those approaches focus typically on the structure function written at one of the endpoints instead of the midpoint. Duchon & Robert (Reference Duchon and Robert2000) and Dubrulle (Reference Dubrulle2019) focus on the two-point correlation quantity  $C({\boldsymbol {x}},{\boldsymbol {r}}) = u_i({\boldsymbol {x}})\,u_i({\boldsymbol {x}} + {\boldsymbol {r}})$ (see figure 1b). Local averaging over all values of
 ${\boldsymbol {r}}$ from
 ${\boldsymbol {r}}=0$ up to scale
 $|{\boldsymbol {r}}|=\ell$ at any given
 ${\boldsymbol {x}}$ then corresponds to the ‘mixed’ energy quantity
 $u_i \tilde {u}_i/2$ (denoted as
 $E^{\ell }$ in Dubrulle Reference Dubrulle2019), where the filtering is over a sphere of diameter
 $2\ell$ so as to combine two points with separation distances up to
 $\ell$. The quantity
 $C({\boldsymbol {x}},{\boldsymbol {r}})$ combines filtered and unfiltered velocities, hence it is more difficult to interpret for comparisons of structure-function and LES filtering approaches. In their transport equation, Duchon & Robert (Reference Duchon and Robert2000) show that a term similar to the third-order structure-function term of (2.5) arises. However, in order for the structure function to correspond to scale
 $\ell$, one has to choose to integrate over a sphere of diameter
 $2 \ell$ (the locally integrated dissipation rate would then be
 $\epsilon _{2\ell }$). In a spherical integration over
 ${\boldsymbol {r}}$ of powers of the velocity difference
 $[u_i({\boldsymbol {x}}+{\boldsymbol {r}})-u_i({\boldsymbol {x}})]$, only the first term is affected by filtering or averaging over the spherical shell, while the centre velocity
 $u_i({\boldsymbol {x}})$ remains fully local. Note that in the scale-integrated local KH equation, the averaging affects both endpoint velocities in the same way, and both become averaged at scale
 $\ell$ in a formally symmetric way.
An early connection between structure-function and filtering approaches was developed by Vreman et al. (Reference Vreman, Geurts and Kuerten1994). In the Vreman analysis, the structure function is defined based on the difference of velocity  $u_i({\boldsymbol {x}}+{\boldsymbol {r}})$ and the locally filtered velocity
 $\tilde {u}_i$ centred at
 ${\boldsymbol {x}}$. Spherical integration of
 $(u_i({\boldsymbol {x}}+{\boldsymbol {r}}) - \tilde {u}_i)^2$ over a sphere of radius
 $\ell /2$ then yields equivalence with the SGS kinetic energy at scale
 $\ell$. But
 $(u_i({\boldsymbol {x}}+{\boldsymbol {r}}) - \tilde {u}_i)^2$ does not equal the usual structure-function definition, now due to a mixture of filtered and unfiltered quantities at two points even before local filtering.
Another interesting approach was presented in Constantin et al. (Reference Constantin, Weinan and Titi1994) and connected to the LES filtering approach by Eyink (Reference Eyink1995, Reference Eyink2006) (equations (2.12)–(2.14) in the latter). In fact, as recounted in the review by Eyink & Sreenivasan (Reference Eyink and Sreenivasan2006), early unpublished work by Onsager anticipated such expressions half a century prior. Written in terms of the sharp spherical filter that we use here, the expression for the trace of the SGS stress reads
 \begin{align}
\tau_{ii}({\boldsymbol{x}}) = \frac{1}{V_\ell}
\iiint\limits_{V_\ell}
[u_i({\boldsymbol{x}}+{\boldsymbol{r}})-u_i({\boldsymbol{x}})]^2
\, {\rm d}^3{\boldsymbol{r}}
-\Biggl(\frac{1}{V_\ell}\iiint\limits_{V_\ell}
[u_i({\boldsymbol{x}}+{\boldsymbol{r}})-u_i({\boldsymbol{x}})]
\, {\rm d}^3{\boldsymbol{r}} \Biggr)^2.
\end{align}
This equation represents an exact relationship between two-point structure functions and the SGS kinetic energy. But for the right-hand side to correspond to structure functions up to scale  $\ell$, the integration must be done over a sphere of radius
 $\ell$ and thus a filtering scale of
 $2\ell$ for the stress tensor in the filtering formulation. The suggested relationship then appears to be between SGS stress kinetic energy at scale
 $2\ell$ and structure functions up to two-point separations
 $\ell$ but averaged over a local domain of size
 $2\ell$, similarly to the Duchon & Robert (Reference Duchon and Robert2000) approach. Note that while each of the terms in (2.11) is also a mixture of filtered and unfiltered velocities, the subtraction cancels the local term and restores the fully filtered property inherent in the definition of
 $\tau _{ii}$.
While not expecting qualitatively different results (except perhaps using the diameter instead of the radius as a name for ‘scale’), we here continue our focus on the more ‘symmetric’ formulation by Hill, with fixed position  ${\boldsymbol {x}}$ specified at the midpoint between two points separated by vector
 ${\boldsymbol {r}}$ whose magnitude then spans up to scale
 $\ell$ (or integration radius
 ${\boldsymbol {r}}_s$ up to radius
 $\ell /2$).
3. Comparisons between kinetic energies and cascade rates/fluxes
In this section, we provide comparisons of local kinetic energies in the structure-function formalism,  $k_{{sf},\ell }$, with that in the filtering formalism,
 $k_{{sgs},\ell }$. We also compare the local energy cascade rates
 $\varPhi _\ell$ and
 $\varPi _\ell$. We consider data from DNS of forced isotropic turbulence at
 $R_\lambda = 1{}250$ (the Taylor-scale Reynolds number) that used 8192
 $^3$ grid points (Yeung, Donzis & Sreenivasan Reference Yeung, Donzis and Sreenivasan2012) in a computational domain of size
 $(2{\rm \pi} )^3$. The integral scale of the flow is
 $L=1.24$, the velocity root mean square is
 $u^\prime =1.58$, and the mean dissipation is
 $\langle \epsilon \rangle = 1.36$. More details about the data and simulation parameters are available as supplementary material at https://doi.org/10.1017/jfm.2023.1066. The analysis is performed at four length scales in the inertial range
 $\ell =\{30, 45, 60, 75\}\eta$, where
 $\eta =(\nu ^3/ \langle \epsilon \rangle )^{1/4}$ is the Kolmogorov length scale, the value of which is
 $4.98\times 10^{-4}$. Comparing to the transverse Taylor microscale (Pope Reference Pope2000)
 $\lambda _g= u^\prime (15\nu /2\langle \epsilon \rangle )^{1/2} \approx 0.024$, the four length scales are
 $\ell = \{0.62, 0.93, 1.24, 1.55\}\lambda _g$, respectively.
To compute volume spherically filtered quantities such as  $k_{{sgs},\ell }$ and
 $\tau _{ij}$ (and filtered velocity gradient tensor, to be discussed in § 5), we fix the middle point coordinate
 ${\boldsymbol {x}}$ in the physical domain. Subsequently, we download data in a cubic domain using the JHTDB cutout service in a cube of size
 $\ell ^3$. The data are then multiplied by a spherical mask (filter) to evaluate local filtered quantities. Other quantities are obtained by utilizing pre-computed Getfunctions from the JHTDB, including spatial interpolation and differentiation, as explained in more detail in Appendix A. For surface averages such as
 $\varPhi _\ell$, we discretize the outer surface of diameter
 $\ell$ into 500 points (for the largest
 $\ell /\eta =75$ case, 2000 points are used) that are distributed approximately uniformly on the sphere. The accuracy of this method of integration has been tested for the
 $\ell / \eta =45$ case by comparing the results from using 500 points to those using 2000 points, for a smaller testing subsample of 500 randomly chosen spheres. We verified that the difference between the mean values of
 $\varPhi_{\ell}$, as well as the average of the absolute value of differences, was less than
 $1\,\%$. For volume averages such as
 $\epsilon _\ell$ and
 $k_{{sf},\ell }$, we use 5 shells for
 $\ell /\eta =30, 45, 60$. The outermost shell comprises 500 uniformly distributed points, with a reduction in number of points towards the inner shells, approximately maintaining the density. We tested 500 randomly chosen spheres to calculate
 $\epsilon _\ell$ at
 $\ell /\eta =45$ using 5 shells and 10 shells. The difference between the mean values of
 $\epsilon _\ell$, as well as the average of the absolute value of differences, was less than
 $2\,\%$. For the larger length scale
 $\ell /\eta =75$, the number of shells was increased to 6; the accuracy is tested using the same method as employed for
 $\ell /\eta =45$. For all the calculations, data on the specified points are obtained from the database using eighth-order Lagrange spatial interpolation. We tested different spatial interpolation methods even without interpolation (using the closest grid point values), verifying that essentially, the averaged values of interest were unchanged.
Overall mean values are obtained at the four scales and are plotted in figure 2(a). The results for kinetic energy for the structure-function approach are consistent with the analytical evaluation (see Appendix B). For the SGS kinetic energy, the numerical results fall below the theoretical inertial range prediction, due to the transfer function of top-hat filtering having a very different spectral signature compared to the structure function, and when integrating, it emphasizes the viscous range more than the structure-function operation, reducing the amount of SGS kinetic energy even at scales much larger than the Kolmogorov scale (see discussion in Appendix B).
(a) Normalized mean kinetic energies and mean cascade rates as functions of four filter scales for the  $R_\lambda = 1250$ DNS isotropic turbulence dataset. Specifically, closed squares show
 $\langle k_{{sf},\ell } \rangle / (\langle \epsilon \rangle \ell )^{2/3}$ while closed circles show
 $\langle k_{{sgs},\ell } \rangle / (\langle \epsilon \rangle \ell )^{2/3}$. Open squares show
 $\langle \varPhi _\ell \rangle / \langle \epsilon \rangle$, while open circles show
 $\langle \varPi _\ell \rangle / \langle \epsilon \rangle$. The horizontal lines show the expected asymptotic values in the inertial range for mean kinetic energies in the structure-function formulation (
 $1.6$) and in the filtering formulation (
 $1.2$), while the expected energy cascade rates equal unity. (b) The correlation coefficients between kinetic energies (
 $\rho _{kk}$, downward triangles) and cascade rates (
 $\rho _{\varPhi \varPi }$, upward triangles).

Figure 3(a) shows the joint probability density function (p.d.f.) of  $k_{{sf},\ell }$ and
 $k_{{sgs},\ell }$ at scale
 $\ell = 45 \eta$. The correlation coefficient between the quantities is
 $\rho _{kk} = 0.97$ (figure 2b). The correlation coefficient is defined as
 $\rho _{xy} = \langle (x-\langle x\rangle )(y-\langle y\rangle )\rangle / (\sigma _x \sigma _y)$, where
 $\sigma$ represents the variable's root mean square value. Similarly, figure 3(b) shows the joint p.d.f. of
 $\varPi _{\ell }$ and
 $\varPhi _{\ell }$, also at scale
 $\ell = 45 \eta$ for the same dataset. The correlation coefficient between the quantities is measured to be
 $\rho _{\varPhi \varPi }=0.58$ (figure 2b), significantly lower than for the energies but still appreciable. It can be seen that negative values occur for both
 $\varPi _{\ell }$ and
 $\varPhi _{\ell }$, although it appears that
 $\varPhi _{\ell }$ has more variability and larger negative excursions than
 $\varPi _{\ell }$. As summarized in § 1, the relevance of locally negative values of
 $\varPi _{\ell }$ to the flow physics remains unclear, especially given the fact that upon averaging, the quantity becomes positive. Conversely, the quantity
 $\varPhi _{\ell }$ has a clearer local interpretation, in the sense that clearly, locally negative values can be interpreted as kinetic energy (local
 $\delta u_i^2/2)$) showing a net flux out of a sphere of diameter
 $\ell$ in scale space, i.e. becoming associated with energy at larger
 $\ell$, while its overall average is positive. An interesting question is whether negative values of
 $\varPi _{\ell }$ or
 $\varPhi _{\ell }$ survive under some type of statistical averaging. In the following sections, we use conditional averaging to quantify the importance of negative values (inverse local cascade, or backscatter).
Joint p.d.f.s of (a)  $k_{{sgs},\ell }$ and
 $k_{{sf},\ell }$ with contour line values
 $0.01, 0.03, 0.1, 0.3, 1, 3$, and (b)
 $\varPi _\ell$ and
 $\varPhi _\ell$ with contour line values
 $0.001, 0.003,0.01, 0.3, 0.1, 0.3$, at scale
 $\ell = 45 \eta$ measured in DNS of isotropic turbulence at
 $R_\lambda =1250$. The red dashed line represents a
 $45$-degree slope line. The data and the editable notebook can be found at https://multimediafluids.uam.elogim.com/S0022112023010662/JFM-Notebooks/files/figure3.

4. Conditional averaging based on local dissipation
Motivated by the KRSH and the fact that local viscous dissipation (small-scale) appears in both the scale-integrated local KH equation and the SGS kinetic energy equation (i.e. (2.4) is identical to (2.9)), in this section, we compare conditionally averaged cascade rates/fluxes for both the structure-function and filtering formulations, conditioned on  $\epsilon _\ell$, i.e.
 $\langle \varPhi _\ell | \epsilon _\ell \rangle$ and
 $\langle \varPi _\ell | \epsilon _\ell \rangle$. According to the KRSH (Kolmogorov Reference Kolmogorov1962), the statistical properties of velocity increments depend on the local average dissipation within a sphere of scale
 $\ell$, rather than being determined by the globally averaged dissipation. Written in terms of the quantities of present interest, the KRSH would read
 $\langle \varPhi _\ell | \epsilon _\ell \rangle = \epsilon _\ell$ since
 $\varPhi _\ell$ is determined fully by the velocity increments envisioned in the KRSH. Loosely extending the KRSH arguments to the filtering formalism would suggest
 $\langle \varPi _\ell | \epsilon _\ell \rangle = \epsilon _\ell$.
In order to assess this hypothesis, we evaluate the conditional averages based on the same dataset as described before. Results for  $\langle \varPhi _\ell |\epsilon _\ell \rangle$ and
 $\langle \varPi _\ell |\epsilon _\ell \rangle$ are shown in figure 4(a). Results for the four scales considered are included. As can be seen, the plot shows close agreement for both
 $\langle \varPhi _\ell |\epsilon _\ell \rangle$ and
 $\langle \varPi _\ell |\epsilon _\ell \rangle$ with
 $\epsilon _\ell$. It is important to note that
 $\varPhi _\ell$ and
 $\varPi _\ell$ are conditioned on exactly the same values of
 $\epsilon _\ell$. The similarities and differences observed in figure 4 indicate that
 $\varPhi _\ell$ and
 $\varPi _\ell$ share many properties (same conditional averages) but they are not identical. For instance, it is clear from figure 3(b) that the variance of
 $\varPhi _\ell$ exceeds that of
 $\varPi _\ell$, even though their mean values are the same.
(a) Conditional averages of  $Z = \varPhi _\ell$ (black symbols and lines) and
 $Z = \varPi _\ell$ (open symbols and lines) based on local dissipation
 $\epsilon _\ell$. The red dashed line indicates the value of
 $\epsilon _\ell$. Different symbols denote different scales:
 $\ell /\eta = 30$ (squares),
 $45$ (triangles),
 $60$ (circles) and
 $75$ (diamonds). All values are normalized with the globally averaged rate of dissipation
 $\langle \epsilon \rangle$. (b) Log-log plot of conditional averages of
 $Z =k_{sf,\ell }$ (black triangles) and
 $Z = k_{sgs,\ell }$ (open triangles) based on local dissipation
 $\epsilon _\ell$ for the case
 $\ell =45 \eta$. Black stars show the conditional average of the longitudinal velocity increments
 $Z = \delta u_L^2$, where
 $\delta u_L = \delta u_j\,\hat {n}_j$. The magenta dashed line has slope
 $2/3$ according to Kolmogorov theory.

In general, the behaviours of both  $\langle \varPhi _\ell | \epsilon _\ell \rangle$ and
 $\langle \varPi _\ell | \epsilon _\ell \rangle$ confirm the validity of the KRSH in the present context. More detailed analysis of the KRSH for
 $\varPhi _\ell$ and connections to (2.2) are reported in Yao et al. (Reference Yao, Yeung, Zaki and Meneveau2023). We also tested the KRSH using the full viscous dissipation
 $\nu (\partial u_i/\partial x_j)(\partial u_i/\partial x_j+\partial u_j/\partial x_i)$ instead of the pseudo-dissipation
 $\nu (\partial u_i/\partial x_j)^2$ when computing
 $\epsilon _\ell$. The largest difference for
 $\langle \varPhi _\ell | \epsilon _\ell \rangle$ is less than
 $1\,\%$. Additionally, the correlation coefficient between the two types of dissipation is
 $0.996$.
Similarly, we evaluate the kinetic energies  $k_{sf}$ and
 $k_{sgs}$ conditionally averaged on
 $\epsilon _\ell$. Results for
 $k_{sf}$ and
 $k_{sgs}$ are essentially indistinguishable, except for a constant offset consistent with the ratio of their mean values. In terms of their dependence on dissipation, we observe power-law scaling
 ${\sim }\epsilon _\ell ^\beta$ with
 $\beta \sim 0.79$, slightly larger than the value
 $2/3$ implied by standard Kolmogorov scaling. To verify the present data and analysis methods, we also evaluate the traditional longitudinal second-order structure function conditioned on
 $\epsilon _\ell$,
 $\langle \delta u_L^2 |\epsilon _\ell \rangle$ (where
 $\delta u_L = \delta u_j\,\hat {n}_j$), for which the Kolmogorov scaling
 ${\sim } \epsilon _\ell ^{2/3}$ according to the KRSH is well established (Stolovitzky, Kailasnath & Sreenivasan Reference Stolovitzky, Kailasnath and Sreenivasan1992). The result (shown as stars in figure 4b) indeed confirms the
 $2/3$ scaling for this quantity. A more in-depth analysis and possible reasons for non-Kolmogorov scaling of
 $k_{sf}$ with
 $\epsilon _\ell$ are left for future studies. At this stage, we simply note the similarity in scaling and overall behaviour of
 $k_{sf}$ and
 $k_{sgs}$.
5. Conditional averaging based on large-scale velocity gradients
In this section, motivated by large-scale properties of the flow that would be available in LES, we explore correlations between properties of the velocity gradient tensor filtered at scale  $\ell$ and the two definitions of energy cascade rate/flux. It is useful to cast the present comparative study of
 $\varPhi$ and
 $\varPi$ using analyses of the type that have been performed before in the context of LES. The velocity gradient tensor encapsulates information about fluid deformation and rotation, and connections to the energy cascade have been studied extensively. Already, Bardina, Ferziger & Rogallo (Reference Bardina, Ferziger and Rogallo1985) examined the impact of rotation on homogeneous isotropic turbulence and observed that rotation decreases the dissipation (cascade) rate while increasing the length scales, suggestive of inverse energy cascade effects. Goto (Reference Goto2008) investigated physical mechanisms underlying forward energy cascade and argued that forward cascade can be triggered in regions characterized by strong strain between two large-scale tubular vortices. The role of the filtered gradient tensor for energy cascade was first explored numerically in Borue & Orszag (Reference Borue and Orszag1998) and experimentally in van der Bos et al. (Reference van der Bos, Tao, Meneveau and Katz2002), building on the ‘Clark model’ that approximates features of the SGS tensor using Taylor-series expansion. Recent studies by Johnson (Reference Johnson2020, Reference Johnson2021) and Carbone & Bragg (Reference Carbone and Bragg2020) have expanded significantly on such analyses, and examined the roles of strain-rate self amplification and vortex stretching driving the forward energy cascade process. For inverse cascade, a vortex thinning mechanism may be at play (Johnson Reference Johnson2021).
A first level of characterization of the properties of the velocity gradient tensor is its invariants. To characterize rates of deformation and rotation, we evaluate the strain and rotation invariants from data, defined according to
 \begin{equation} S_\ell^2({\boldsymbol{x}},t) = \tilde{S}_{ij}\tilde{S}_{ij}, \quad \varOmega_\ell^2({\boldsymbol{x}},t) = \tilde{\varOmega}_{ij}\tilde{\varOmega}_{ij}, \end{equation}
where  $S_{ij}$ and
 $\varOmega _{ij}$ are the symmetric and antisymmetric parts of the velocity gradient tensor
 $A_{ij}=\partial u_i/\partial x_j$, and the tilde denotes, as before, spherical top-hat filtering over a ball of diameter
 $\ell$. For consistency with prior literature, these values will be normalized by the overall average
 $\langle Q_w\rangle = \frac {1}{2}\langle \varOmega _\ell ^2\rangle$ (equal to
 $\frac {1}{2}\langle S_\ell ^2\rangle$ in homogeneous turbulence).
A more detailed characterization of the statistics of velocity gradients involves the invariants  $Q$ and
 $R$ (Vieillefosse Reference Vieillefosse1982). It is well known that the joint p.d.f. of
 $Q$ and
 $R$ exhibits a characteristic teardrop shape (Chong, Perry & Cantwell Reference Chong, Perry and Cantwell1990; Meneveau Reference Meneveau2011), from which flow topology information such as vortex stretching and compression can be inferred (Chong et al. Reference Chong, Perry and Cantwell1990; Borue & Orszag Reference Borue and Orszag1998; Lüthi, Holzner & Tsinober Reference Lüthi, Holzner and Tsinober2009; Danish & Meneveau Reference Danish and Meneveau2018). These two invariants (at scale
 $\ell$) are defined as usual according to
 \begin{equation} Q_\ell({\boldsymbol{x}},t) =-\tfrac{1}{2} \tilde{A}_{ij}\tilde{A}_{ji}, \quad R_\ell({\boldsymbol{x}},t) =-\tfrac{1}{3} \tilde{A}_{ij}\tilde{A}_{jk}\tilde{A}_{ki}. \end{equation}
Under the assumption of restricted Euler dynamics (Meneveau Reference Meneveau2011), the transport equation for the velocity gradient tensor leads to  ${{\rm d}Q_\ell }/{{\rm d}t} = -3R_\ell$ and
 ${{\rm d}R_\ell }/{{\rm d}t} = -\frac {2}{3}Q_\ell ^2$ (Cantwell Reference Cantwell1992). The quantity
 $R_\ell$ can thus be considered as the (negative) rate of change of
 $Q_\ell$, and contains both vortex stretching and strain self-stretching mechanisms (Johnson Reference Johnson2021). In our comparative investigation of energy cascade rates, conditional averaging based on the four invariant quantities
 $S^2_\ell$,
 $\varOmega ^2_\ell$,
 $Q_\ell$ and
 $R_\ell$ will be undertaken.
We begin with qualitative visualizations of the fields in small subsets of the domains analysed. Figures 5(a,b) depict sample instantaneous fields of  $\varPhi _\ell$ and
 $\varPi _\ell$, respectively, highlighting regions of strong local forward cascade (indicated by solid black circles) and strong inverse cascade (indicated by dashed red circles). The correlation between these two variables is evident; the computed correlation coefficient between the snapshots is 0.64. In both figures 5(a,b), the fluxes are normalized by the global averaged dissipation
 $\langle \epsilon \rangle$. As already noted based on the joint p.d.f.s, there are differences between
 $\varPhi _\ell$ and
 $\varPi _\ell$. The maximum magnitude of the positive cascade rate in
 $\varPhi _\ell$ is approximately twice that of
 $\varPi _\ell$, while the magnitude of the negative cascade rate in
 $\varPhi _\ell$ is approximately 3–4 times larger. Since
 $\langle \varPhi _\ell \rangle \sim \langle \varPi _\ell \rangle \sim \langle \epsilon _\ell \rangle \sim \langle \epsilon \rangle$, the significant different maximum values indicate that
 $\varPhi _\ell$ is more variable and intermittent than
 $\varPi _\ell$. Also,
 $\varPhi _\ell$ exhibits somewhat finer-scale spatial features.
(a–d) Instantaneous  $\varPhi _\ell$,
 $\varPi _\ell$,
 $S_\ell ^2$ and
 $\varOmega _\ell ^2$ fields, respectively, with
 $\ell =45\eta$ in a
 $750\eta \times 750 \eta$ domain (
 $500\times 500$ points of the DNS grid). The black solid circles in (a,b) are located in the strong local forward cascade region, which is correlated to the strong local strain rates marked in the black circles in (c). The red dashed circles in (a,b) are located in local inverse cascade regions (negative energy fluxes), which appear correlated qualitatively to relatively strong local rotation rates marked in the red dashed circles in (d).

5.1. Conditional statistics based on strain rate ( $S^2_\ell$) and rotation rate ($\varOmega ^2_\ell$)


Figures 5(a,b) show distinct regions including both local forward (red area) and inverse (blue area) cascade rates. It is apparent visually that the presence of a strong local forward energy cascade is associated with increased local strain rate, as indicated by the solid black circles in both figures 5(a,b) and the corresponding black solid circles in figure 5(c). Similarly, a strong local inverse energy cascade is observed alongside a significant local rotation rate, depicted by the dashed red circles in figures 5(a,b) and the corresponding red dashed circles in figure 5(d). The strong correlation between forward cascade and local straining is consistent with multiple earlier observations and prior works in the literature (e.g. Borue & Orszag Reference Borue and Orszag1998, and recently Johnson Reference Johnson2021; Carbone & Bragg Reference Carbone and Bragg2020). We focus attention on the regions with negative energy cascade rates. Conditional averaging can elucidate the statistical significance of these regions. Specifically, we inquire whether there are large-scale flow local features as characterized by the filtered velocity gradient invariants that are systematically accompanied by inverse cascade, i.e. negative  $\varPhi _\ell$. Thus we perform conditional averaging of
 $\varPhi _\ell$ based on the invariants
 $S_\ell ^2$ and
 $\varOmega _\ell ^2$, and repeat the analysis for the SGS energy flux quantity
 $\varPi _\ell$.
Figure 6 shows the joint conditionally averaged  $\varPhi _\ell$ and
 $\varPi _\ell$ based on
 $S^2_\ell$ and
 $\varOmega ^2_\ell$, denoted as
 $\langle \varPhi _\ell | S^2_\ell, \varOmega ^2_\ell \rangle$ and
 $\langle \varPi _\ell | S^2_\ell, \varOmega ^2_\ell \rangle$, respectively. The analysis is performed by computing averages over two million randomly distributed points
 ${\boldsymbol {x}}$. In the presented results,
 $\varPhi _\ell$ is normalized by
 $\langle \epsilon \rangle$, while
 $S^2_\ell$ and
 $\varOmega ^2_\ell$ are normalized by
 $\langle Q_w \rangle = \frac {1}{2}\langle \varOmega ^2_\ell \rangle$. Figures 6(a–d) present the joint conditionally averaged
 $\langle \varPhi _\ell | S^2_\ell, \varOmega ^2_\ell \rangle$ at four different length scales, namely
 $\ell = \{30, 45, 60 , 75\} \eta$, highlighting the dominance of the forward cascade by the extensive red region. This magnitude is many times larger than the maximum magnitude observed in the blue region, representing the inverse cascade. The red region covers a wide range of
 $S^2_\ell$ and
 $\varOmega ^2_\ell$ values, consistent with the expectation that the global average would favour a forward cascade (
 $\langle \varPhi _\ell >0 \rangle$). The highest positive values of
 $\langle \varPhi _\ell | S^2_\ell, \varOmega ^2_\ell \rangle$ correspond to high strain rates and low rotation rates, and they decrease as the strain rate decreases. Interestingly, the inverse cascade appears explicitly in the lower-right corners of the plots, where the rotation rate is strong but the strain rate is weak. It is worth noting that the conditionally averaged values shown in figure 6 reflect the combined outcome of the forward and inverse cascades. Consequently, in specific regions characterized by distinct strain and rotation rates, events with forward and inverse cascades can cancel each other out. Only in the lower right corner is there an indication of net inverse cascade when the cascade rate is defined using the structure-function approach.
Plots of (a–d)  $\langle \varPhi _\ell | S^2_\ell, \varOmega ^2_\ell \rangle$ and (e–h)
 $\langle \varPi _\ell | S^2_\ell, \varOmega ^2_\ell \rangle$ at
 $\ell = \{30, 45, 60, 75\}\eta$. The black dashed lines in (d) represent isolines of
 $Q_\ell \equiv -\frac {1}{2}(S_\ell ^2 - \varOmega _\ell ^2)$;
 $\varPhi _\ell$ and
 $\varPi_\ell$ is normalized by
 $\langle \epsilon \rangle$; and
 $S^2_\ell$ and
 $\varOmega ^2_\ell$ is normalized by
 $\langle Q_w \rangle = \frac {1}{2}\langle \varOmega _\ell ^2 \rangle$.

In figure 6(d), we superimpose dashed lines representing the isolines of  $Q_\ell$, with the
 $Q_\ell = 0$ line indicating the condition of equal strain and rotation rates. The parallel dashed lines correspond to
 $Q_\ell =-10$,
 $-5$,
 $0$,
 $5$,
 $10$ and
 $15$, respectively. The
 $Q_\ell =15$ line appears near the boundary separating the red and blue regions. However, the boundary of the blue region does not appear to align well with the
 $Q_\ell$ isoline. This observation suggests that
 $Q_\ell$ might be not enough to provide an adequate threshold for distinguishing the net forward and inverse cascade regions.
Figures 6(d–g) present results for the joint conditionally averaged  $\varPi _\ell$ based on
 $S^2_\ell$ and
 $\varOmega ^2_\ell$, corresponding to the same filter scales as in figures 6(a–d). It is evident that trends for the positive cascade rate (red region) for
 $\varPi _\ell$ resemble closely those of
 $\varPhi _\ell$, with the peak of the forward cascade occurring at a high strain rate and low rotation rate. The magnitude of the maximum forward cascade rate for
 $\varPi _\ell$ is slightly weaker compared to that of
 $\varPhi _\ell$. The most significant difference is that only a few instances of blue squares are observed in regions characterized by strong rotation and weak strain, indicating that the overall predominance of the forward cascade persists regardless of the local values of
 $S^2_\ell$ and
 $\varOmega ^2_\ell$. These results highlight some important statistical differences between
 $\varPhi _\ell$ and
 $\varPi _\ell$. We further evaluate the conditional averages of the energy fluxes
 $\varPhi _\ell$ and
 $\varPi _\ell$, conditioned on either
 $S^2_\ell$ and
 $\varOmega ^2_\ell$ individually. This analysis is motivated by the work of Buaria & Pumir (Reference Buaria and Pumir2022), which highlighted different scalings of conditional averages with respect to strain rate compared to rotation rates even though one would expect similar results based on dimensional arguments. In figure 7(a), we demonstrate that both
 $\varPhi _\ell$ and
 $\varPi _\ell$ exhibit a power-law relationship when conditioned on
 $S^2_\ell$, with slope
 $3/2$. This scaling aligns with dimensional analysis and Kolmogorov scaling,
 $\langle \varPhi _\ell | S_\ell ^2 \rangle \sim [S_\ell ^2]^{3/2}$ and
 $\langle \varPi _\ell | S_\ell ^2 \rangle \sim [S_\ell ^2]^{3/2}$. In contrast, when conditioning
 $\varPhi _\ell$ and
 $\varPi _\ell$ on
 $\varOmega ^2_\ell$ (figure 7b), a different trend emerges, with much weaker dependence on rotation rate.
(a) Plots of  $\langle \varPhi _\ell | S^2_\ell \rangle$ (black triangles and lines) and
 $\langle \varPi _\ell | S^2_\ell \rangle$ (blue open triangles and lines). (b) Plots of
 $\langle \varPhi _\ell | \varOmega ^2_\ell \rangle$ (black triangles and lines) and
 $\langle \varPi _\ell | \varOmega ^2_\ell \rangle$ (blue open triangles and lines). The red dashed lines represent lines with slope
 $3/2$ in the log-log plot.

To develop a more detailed understanding of the inverse cascade region within  $\langle \varPhi _\ell | S^2_\ell, \varOmega ^2_\ell \rangle$, we perform a further analysis by dividing the samples based on
 $\varPhi _\ell > 0$ and
 $\varPhi _\ell < 0$ for
 $\ell = 45 \eta$. We then calculate the conditional average of these separated samples considering
 $S^2_\ell$ and
 $\varOmega ^2_\ell$, denoted as
 $\langle \varPhi _\ell | S^2_\ell, \varOmega ^2_\ell, \varPhi _\ell > 0 \rangle$ and
 $\langle \varPhi _\ell | S^2_\ell, \varOmega ^2_\ell, \varPhi _\ell < 0 \rangle$. The results are presented in figure 8. From figure 8(a), it can be observed that the forward cascade clearly increases with
 $S^2_\ell$, with the highest values of
 $\varPhi _\ell$ concentrated in the upper left corner. It increases also with
 $\varOmega ^2_\ell$, but less rapidly. Combined, the trend seems to be an increase approximately proportional to
 ${\sim }S^2_\ell + 0.75 \, \varOmega ^2_\ell$. Differently, figure 8(b) illustrates that the inverse cascade is approximately proportional to
 ${\sim }S^2_\ell + 0.5 \, \varOmega ^2_\ell$, i.e. shallower isolines extending more in the horizontal direction than in the vertical compared to the forward cascade case shown in figure 8(a). This observation elucidates why the strongest red region in figure 6(b) emerges at the largest
 $S^2_\ell$, while below this threshold, the forward cascade events weaken progressively and are gradually cancelled out by the inverse cascade. Finally, in regions characterized by a weak strain rate and strong rotation rate, the inverse cascade becomes the dominant contribution.
(a,b) The conditional averages of cascade rates obtained by sampling positive and negative signs, i.e.  $\langle \varPhi _\ell | S^2_\ell, \varOmega ^2_\ell, \varPhi _\ell > 0 \rangle$ and
 $\langle \varPhi _\ell | S^2_\ell, \varOmega ^2_\ell, \varPhi _\ell < 0 \rangle$, respectively. (c,d) The logarithm base 10 of the number of samples on the
 $S^2_\ell, \varOmega ^2_\ell$ map (out of a total of
 $2\times 10^6$ samples). The isolines in (c,d) are the values corresponding to the contour.

Figures 8(c,d) display the distribution of the number of samples corresponding to positive and negative cascade rates in logarithmic scale (out of the 2 million samples (balls) considered). Our focus is directed specifically towards the bottom right corners of the plots, which correspond to the region where the inverse cascade is observed in figure 6(b). Interestingly, we observe that at  $\varOmega ^2_\ell /\langle Q_w \rangle \approx 40$ and
 $S^2_\ell /\langle Q_w \rangle < 10$, the numbers of samples representing both inverse and forward cascade rates are approximately equivalent, falling within the range
 $10^{1}$–
 $10^{1.5}$. This implies that within this region, the magnitude of the inverse cascade must be significant to achieve net negative values for the conditional average. Still, for the conditions with net inverse cascade, the number of occurrences for both forward and inverse cascade rates is quite small, of the order of only
 $1/10^5$ of the total samples, indicating a very low frequency. We point out that in the extreme bins, the conditionally averaged fluxes are unlikely to be fully converged. Therefore, our observations are meant to be mostly qualitative in these regions. In particular, the inverse cascade regions depicted in figure 6 are attributed primarily to rare but intense events. In the next subsection, we will show that inverse cascade can be better characterized by conditioning on
 $Q_\ell$ and
 $R_\ell$ invariants.
5.2. Conditional statistics based on $Q_\ell$ and $R_\ell$ invariants


In the context of the  $\varOmega ^2_\ell$ and
 $S^2_\ell$ map shown in figure 6, we observe the presence of a distinct inverse energy cascade in the region characterized by strong rotation but weak strain (corresponding to large
 $Q_{\ell}$ values) for
 $\varPhi _\ell$. However, such observations did not hold for
 $\varPi _\ell$. But these results do not preclude the possibility that net forward and inverse cascade may be associated with other invariants of the filtered velocity gradient tensor
 $\tilde {A}_{ij}$.
Figure 9 shows the joint conditionally averaged  $\langle \varPhi _\ell | Q_\ell, R_\ell \rangle$ and
 $\langle \varPi _\ell | Q_\ell, R_\ell \rangle$ at four different scales, namely,
 $\ell = \{30, 45, 60, 75\} \eta$. Across all plots, we can observe the distinctive teardrop-shape pattern on the
 $Q$–
 $R$ map, as reported in previous studies (Chong et al. Reference Chong, Perry and Cantwell1990; Meneveau Reference Meneveau2011). The black solid lines are the boundaries, separating the four quadrants based on the signs of
 $Q_{\ell}$ and
 $R_{\ell}$. Notably, it becomes evident that both
 $\varPhi_{\ell}$ and
 $\varPi_{\ell}$ exhibit a strong and dominant inverse cascade in the quadrant characterized by
 $Q_{\ell} > 0$ and
 $R_{\ell} > 0$. It is useful to recall that the variable
 $R_\ell$ is associated with the rate of change of
 $Q_\ell$ (in fact, assuming restricted Euler dynamics, they are related by
 ${\rm d}Q_\ell /{\rm d}t = -3R_\ell$; Cantwell Reference Cantwell1992; Meneveau Reference Meneveau2011). Therefore
 $R_\ell >0$ corresponds to a decreasing trend of
 $Q_\ell$, i.e. vortex compression. We find that such events are associated with inverse energy cascade. This observation is particularly interesting considering the absence of an observable inverse cascade for
 $\varPi _\ell$ in the
 $S^2_\ell$ and
 $\varOmega ^2_\ell$ map. Hence these results indicate that the variables
 $Q_{\ell}$ and
 $R_{\ell}$ provide a more effective characterization to identify inverse cascade using conditional averaging.
Plots of (a–d)  $\langle \varPhi _\ell | Q_\ell, R_\ell \rangle$ and (e–h)
 $\langle \varPi _\ell | Q_\ell, R_\ell \rangle$ at
 $\ell = \{30, 45, 60, 75\}\eta$. The black solid lines separate the four quadrants, and the two lines
 $Q=-(\frac {27}{4} R^2)^{1/3}$ (Vieillefosse lines) are also shown. Here,
 $\varPhi _\ell$ and
 $\varPi _\ell$ are normalized by
 $\langle \epsilon \rangle$;
 $Q_\ell$ is normalized by
 $\langle Q_w \rangle$; and
 $R_\ell$ is normalized by
 $\langle Q_w \rangle ^{3/2}$. The data and editable analysis code that generated these joint p.d.f.s (for the case at
 $\ell =45\eta$) can be found at https://multimediafluids.uam.elogim.com/S0022112023010662/JFM-Notebooks/files/figure9.

The region characterized by  $Q_{\ell}<0$ and
 $R_{\ell}>0$, which corresponds to the strain-dominated region, exhibits the most pronounced forward cascade. This observation aligns with the findings of many prior analyses in the literature (Borue & Orszag Reference Borue and Orszag1998; van der Bos et al. Reference van der Bos, Tao, Meneveau and Katz2002; Carbone & Bragg Reference Carbone and Bragg2020; Johnson Reference Johnson2021) as well as those depicted in figure 9, further emphasizing that the strong local strain rate plays a crucial role in driving the forward energy cascade. We note that Borue & Orszag (Reference Borue and Orszag1998) and van der Bos et al. (Reference van der Bos, Tao, Meneveau and Katz2002) display conditional averages weighted by the joint p.d.f. of
 $R_{\ell}$ and
 $Q_{\ell}$. In their results, there was hardly any indication of backscatter/inverse cascade in the
 $Q_{\ell}>0$ and
 $R_{\ell}>0$ ‘vortex compression’ region, because the overall probability density of that region is smaller than for the other regions. However, the unweighted conditional averaging represents the relevant values if the large-scale flow is in that particular state (
 $Q_{\ell}>0$ and
 $R_{\ell}>0$), and is therefore relevant to our analysis. We also notice a small blue region in the
 $Q_\ell < 0$,
 $R_\ell < 0$ quadrant of
 $\langle \varPhi _\ell | Q_\ell, R_\ell \rangle$ (but not seen for
 $\langle \varPi _\ell | Q_\ell, R_\ell \rangle$). The occurrence of inverse cascade in strain-dominated, strain self-stretching regions appears intriguing. However, the small number of samples (
 ${\sim }O(10)$) in the bin showing inverse cascade precludes us from ascribing much significance to this observation for now.
In a manner similar to that in figure 8, we perform further conditional averaging, also distinguishing positive and negative cascade rates. Figures 10(a,b) present  $\langle \varPhi _\ell | Q_\ell, R_\ell, \varPhi _\ell > 0 \rangle$ and
 $\langle \varPhi _\ell | Q_\ell, R_\ell, \varPhi _\ell < 0 \rangle$ at
 $\ell = 45 \eta$. In the case of the inverse cascade, it is observed to occur in all four quadrants (figure 10b), with a more evenly distributed and symmetric presence in the upper two quadrants associated with
 $Q_{\ell}>0$, i.e. the rotation-dominated regions. The characteristic teardrop shape is less prominent and exhibits a shorter tail compared to the forward cascade (figure 10a). Regarding the forward cascade, it is evident that it is most dominant in the
 $Q_{\ell}<0$,
 $R_{\ell}>0$ quadrant, consistent with figure 9. However, in the
 $Q_{\ell} > 0$,
 $R_{\ell} >0$ quadrant, the forward cascade is weaker and is overall cancelled out by the stronger inverse cascade in that particular region.
(a,b) Plots of  $\langle \varPhi _\ell | Q_\ell, R_\ell, \varPhi _\ell > 0 \rangle$ and
 $\langle \varPhi _\ell | Q_\ell, R_\ell, \varPhi _\ell < 0 \rangle$. (c,d) Plots of the logarithm base 10 of the number of samples on the
 $Q_{\ell}, R_{\ell}$ map. The isolines in (c,d) are the values corresponding to the contours.

Figures 10(c,d) display the distributions of number of samples of forward and inverse cascade rates, respectively. The shapes of the distributions align with figures 10(a,b), but a majority of the samples are concentrated at the centre, corresponding to small values of  $Q_{\ell}$ and
 $R_{\ell}$. This observation confirms that the strong instances of inverse cascade and forward cascade observed in figure 9 are determined primarily by infrequent but extreme events (intermittency). Note that the joint p.d.f. in figure 10(d) is more left–right symmetric than that in figure 10(c), suggesting a less non-Gaussian behaviour of the flow in regions of inverse cascade than in the forward cascade regions.
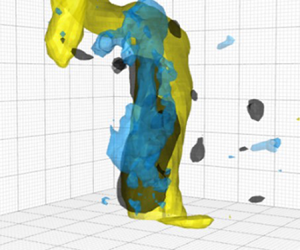
Finally, to provide a visual impression of the spatial distribution of regions of negative  $\varPhi _\ell$ in the flow, in figure 11 we provide a 3-D visualization of two instances in specific small subdomains of size
 $150^3$ grid points (i.e.
 $(225\eta )^3$ out of the overall
 $8192^3$ DNS domain. The selection of these subdomains was based on the condition that
 $Q_\ell /\langle Q_w \rangle > 15$ and
 $R_\ell /\langle Q_w \rangle ^{3/2} > 15$ at the centre of each subdomain, such that the centre is at a strong vortex compression region. We then calculate the values of
 $\varPhi _\ell$,
 $\varPi _\ell$,
 $Q_\ell$ and
 $R_\ell$ at every second grid point. In figures 11(a,b), the light blue regions correspond to the isosurface of a large negative value of
 $\varPhi _\ell /\langle \epsilon \rangle = - 60$, indicating the presence of an inverse cascade with significant magnitude. Clearly, we can see that the occurrence of a strong inverse cascade is associated closely with the presence of the vortices. Figure 11(a) depicts that large negative
 $\varPhi _\ell$ appears near the centre and not at the core of the yellow tube, although one should recall that
 $\varPhi _\ell ({\boldsymbol {x}},t)$ is defined locally as centred at
 ${\boldsymbol {x}}$ but represents the energy cascade into balls of diameter
 $45\eta$, i.e. comparable to the diameter of the vortex (yellow region) shown. The blue region is also largely connected with the black isosurface (
 $R_\ell =20 \langle Q_w\rangle ^{3/2}$), indicating a strong ‘vortex compression’ region within the yellow tube. Interactive 3-D versions of the figure that can be accessed following the links in the figure caption help to elucidate the spatial structure. Figure 11(b) is an entirely different instance of similar conditions, showing a more broken up vortex, and showing that
 $\varPhi _\ell$ can also peak near the sides, and appear more scattered within the vortex. Coupled with the results shown in figure 9, the visualizations suggest that the strong inverse cascade occurs along the large-scale vortices, in regions of these vortices in which
 $R_{\ell}>0$, i.e. the vortex compression regions. We can also observe some yellow tubes, within which inverse cascade and compression are both absent. This is consistent with the statistics such that when conditionally averaging in terms of
 $Q_\ell$ but irrespective of
 $R_{\ell}$, the inverse cascade becomes very weak and almost non-existent. However, once one considers only
 $R_{\ell}>0$ regions, inverse cascade can be observed clearly in high vortical regions.
(a,b) Isosurfaces of local  $\varPhi _\ell /\langle \epsilon \rangle = -60$ (light blue),
 $Q_\ell /\langle Q_w \rangle = 20$ (yellow) and
 $R_\ell /\langle Q_w \rangle ^{3/2} = 30$ (black) in two different 3-D subdomains. (c,d) Isosurfaces of local
 $\varPi _\ell /\langle \epsilon \rangle = -20$ (green-blue) in the same subdomains and isosurface of
 $Q_\ell /\langle Q_w \rangle$ and
 $R_\ell / \langle Q_w \rangle ^{3/2}$ as in (a,b). Interactive visualizations are available for each panel at Panel (a), Panel (b), Panel (c), Panel (d). The link to the directory containing the visualization code and the 3-D fields for these data can be found at https://multimediafluids.uam.elogim.com/S0022112023010662/JFM-Notebooks/files/figure11.

We also show  $\varPi _\ell /\langle \epsilon \rangle = -20$ (green-blue isosurface) in the corresponding 3-D subdomains shown as figures 11(c,d). Clearly, we can see that the green-blue and black regions largely overlap within the yellow region in figure 11(c). In figure 11(d), the overlapping between green-blue, yellow and black regions occurs at the centre and top right region of the subdomain, indicating that strong negative
 $\varPi _\ell$ is also associated with strong vortex compression within a high vortical region, consistent with figure 9. However, the patterns of the green SGS flux regions are smoother, consistent with the two-dimensional visualisation in figure 5.
Caution must be expressed that visualizations provide only qualitative impressions, and more quantitative analysis requires structure-based conditional averaging, such as undertaken recently in Park & Lozano-Duran (Reference Park and Lozano-Duran2023). While such analysis is beyond the scope of the present paper, the conditional statistics presented in figure 9 already by themselves provide the strong statistically robust connection between cascade rate measures and features of the large-scale velocity gradient tensor.
6. Conclusions
In this paper, we explore, based on a DNS dataset of isotropic forced turbulence at a relatively high Reynolds number ( $R_\lambda = 1250$), local features of the energy cascade. We compare two common definitions of the spatially local rate of kinetic energy cascade at some scale
 $\ell$. The first is based on the cubic velocity difference term appearing in the scale-integrated local KH equation, in the structure-function approach. The second is the subfilter-scale (SFS) energy flux term in the transport equation for subgrid-scale kinetic energy, i.e. as used in the filtering approach often invoked in LES. Particular attention is placed on interpretation and statistical robustness of observations of local negative structure-function energy flux and SFS energy flux. The notion and relevance of local inverse cascade or ‘backscatter’ has been open to debates in the literature. We argue that the interpretation of
 $\varPhi _\ell ({\boldsymbol {x}},t)$ as a spatially local energy flux appears unambiguous because it arises naturally from a divergence term in scale space. And the symmetric formulation of Hill (Reference Hill2001, Reference Hill2002) leads to the spherically averaged third-order structure function based definition of a local cascade rate involving velocities at two points that are treated equally via angular averaging over the sphere.
The data confirm the presence of local instances where  $\varPhi _\ell ({\boldsymbol {x}},t)$ is negative, i.e. indicative of local inverse cascade events in 3-D turbulence. Flow visualizations show that spatially, the inverse cascade events are often located near the core of large-scale vortex structures. Comparable observations for the LES-based energy flux
 $\varPi _\ell ({\boldsymbol {x}},t)$ (which also displays negative values at many locations in the flow, as is well-known in the LES literature on ‘backscatter’) show that
 $\varPi _\ell ({\boldsymbol {x}},t)$ displays smoother and more blob-like features. Regarding the statistical significance of such observations, local observations from single realizations are extended using conditional averaging. Attention is placed first on relationships between the local cascade rate and the local filtered viscous dissipation rate
 $\epsilon _\ell ({\boldsymbol {x}},t)$ that plays a central role in the classic KRSH (Kolmogorov Reference Kolmogorov1962). Results show that conditional averaging of both
 $\varPhi _\ell ({\boldsymbol {x}},t)$ and
 $\varPi _\ell ({\boldsymbol {x}},t)$ eliminates negative values, and that the conditional averages in fact equate
 $\epsilon _\ell ({\boldsymbol {x}},t)$ to very good approximation, entirely consistent with KRSH predictions.
The analysis then focuses on conditional averages of  $\varPhi _\ell$ and
 $\varPi _\ell$ conditioned on properties of the filtered velocity gradient tensor properties, in particular four of its most important invariants (strain and rotation rate square magnitude, and the two
 $Q$–
 $R$ invariants). We find statistically robust evidence of inverse cascade as measured with
 $\varPhi _\ell$ when both the large-scale rotation rate is strong and the large-scale strain rate is weak. When defined using
 $\varPi _\ell$, the conditional averaging based on large-scale strain and rotation rates does not lead to any significant average backscatter. When conditioning based on the
 $R_{\ell}$ and
 $Q_{\ell}$ invariants, significant net inverse cascading is observed for
 $\varPhi _\ell$ in the ‘vortex compression’
 $R_{\ell}>0$,
 $Q_{\ell}>0$ quadrant. Qualitatively similar, but quantitatively much weaker trends are observed for the conditionally averaged SFS energy flux
 $\varPi _\ell$. We recall that a multiscale decomposition of
 $\varPi _\ell$ in terms of velocity gradients at multiple scales (Johnson Reference Johnson2020, Reference Johnson2021) shows that
 $\varPi _\ell <0$ appears associated with a vortex-thinning mechanism occurring at smaller scales interacting with large-scale strains.
In summary, present results show that locally negative values of kinetic energy fluxes at scale  $\ell$ are observed for both the structure-function and filtering approaches, and at least for the structure-function approach, the interpretation as a flux in scale space appears unambiguous. Regarding statistical robustness and the potential net impact of such local observations, conditional averaging reveals that both negative
 $\varPhi _\ell$ and negative
 $\varPi _\ell$ (representing inverse cascade) become statistically dominant mechanisms in regions where turbulent motions at scales larger than
 $\ell$ exhibit a ‘vortex compression’ behaviour (
 $R_\ell >0$ and
 $Q_\ell >0$). However, the magnitude of inverse cascade in filtering approaches is weaker and negligible on the
 $(S^2_\ell, \varOmega ^2_\ell )$ map.
For future work, it would be of interest to explore the sensitivity of results to Reynolds number, especially as it is expected that at higher Reynolds numbers, the intermittency of the variables would increase. It would be also interesting to extend conditional averaging to more accurately reflect local energy distribution, entire flow structures and their possible connections to local inverse cascade mechanisms. Other pointwise quantities such as helicity can also be explored. It would also be instructive to connect present results with the multiscale decomposition of Johnson (Reference Johnson2020, Reference Johnson2021), and thus be able to identify the small-scale mechanisms associated with local backscatter/inverse cascade events. And further theoretically obtained exact relations between structure-function and filtering approaches may yet be found.
Supplementary material
Supplementary material and computational notebook files are available at https://doi.org/10.1017/jfm.2023.1066. Computational notebooks can also be found online at https://multimediafluids.uam.elogim.com/S0022112023010662/JFM-Notebooks.
Acknowledgements
We thank Professor G. Eyink for fruitful discussions and comments on this manuscript, Dr M. Encinar for valuable suggestions, and the JHTDB/IDIES staff for their assistance with the database and its maintenance.
Funding
This work is supported by the National Science Foundation (grant no. CSSI-2103874).
Declaration of interests
The authors report no conflict of interest.
Appendix A. Turbulence database access tools
The high-resolution isotropic DNS data are accessible via new Python-based tools built upon the data housed in the JHTDB (Li et al. Reference Li, Perlman, Wan, Yang, Meneveau, Burns, Chen, Szalay and Eyink2008). The JHTDB has been operating for over a decade and has led to hundreds of peer-reviewed articles on turbulence. A new set of data access tools based on Jupyter Notebooks has been developed that enables direct access to subsets of the data continuing the ‘virtual sensors’ concept (Li et al. Reference Li, Perlman, Wan, Yang, Meneveau, Burns, Chen, Szalay and Eyink2008). The new notebooks provide fast and stable operation on the existing turbulence datasets while enabling user-programmable, server-side computations. To date, the new data access tools have been implemented and tested on the high Reynolds number, forced isotropic turbulence dataset on  $8192^3$ grid points (the isotropic8192 datasets) of which five snapshots are at a Taylor microscope Reynolds number
 $Re_{\lambda } = 1250$ (Yeung et al. Reference Yeung, Donzis and Sreenivasan2012), and one with very high spatial resolution at
 $Re_{\lambda } = 610$.
The isotropic8192 dataset has been partitioned into 4096 Zarr database files, each of which is a  $512^3$ volume cubelet of the
 $8192^3$ data. Each Zarr file stores the velocity and pressure variables in distinct Zarr groups, and the data in each group are broken down further into chunks. The chunks are ijk-ordered such that cutouts and interpolation buckets, the size of which are dependent on the interpolation or differentiation method selected by the user, can be cut out directly from the intersecting chunk(s).
The new Python-based data access tools, pyturb, are accessed via the SciServer (sciserver.org) platform. Pyturb interfaces directly with the data files in Zarr format, stored on volumes mounted to each user's SciServer container. The entirety of the isotropic8192 dataset ( $8192^3$ volume, six snapshots) in Zarr format is available publicly through Python Notebook on SciServer. Users can apply for a SciServer account freely, and download the demo Notebook. In the Notebook, users can get access to pre-coded ‘Get’ functions for arbitrary sets of points: GetPressure to retrieve and interpolate pressures, GetPressureGradient to retrieve and interpolate pressure gradient, and similarly GetPressureHessian, GetVelocity, GetVelocityGradient, GetVelocityHessian, GetVelocityLaplacian and GetCutout to read raw data for a user-specified box.
Demo codes for accessing data at user-specified arrays of points (in various sample geometrical configurations) are listed in the Notebook. The isotropic8192 datasets can be also accessed via the web-portal cutout service where the pyturb GetCutout function has replaced the legacy function for user queries (see https://turbulence.pha.jhu.edu/newcutout.aspx). The JHTDB still provides and maintains other datasets (https://turbulence.pha.jhu.edu/datasets.aspx) through legacy SQL systems with C, Fortran, Matlab, Python and .Net interfaces. However, the aim is to transfer the existing datasets and any newcoming datasets to the pyturb system in the future for faster and more stable services.
Appendix B. Evaluating and comparing $\langle k_{{sf},\ell } \rangle$ and $\langle k_{{sgs},\ell } \rangle$


The average values  $\langle k_{{sf},\ell } \rangle$ and
 $\langle k_{{sgs},\ell } \rangle$ can be obtained from classical turbulence theory and the Kolmogorov spectrum. To evaluate
 $\langle k_{{sf},\ell } \rangle$, we use the general expression for the structure-function tensor in isotropic turbulence in the inertial range
 \begin{equation} \langle \delta u _i({\boldsymbol{r}})\,\delta u _j({\boldsymbol{r}}) \rangle = C_2 \langle \epsilon \rangle^{2/3} r^{2/3}\left( \frac{4}{3}\,\delta_{ij} - \frac{1}{3}\,\frac{r_i r_j}{r^2} \right)\!, \end{equation}
and write
 \begin{equation} \langle k_{{sf},\ell} \rangle = \frac{1}{2 V_\ell}\iiint\limits_{V_{\ell}} \frac{1}{2}\,\langle \delta u _i^2({\boldsymbol{r}}) \rangle \,{\rm d}^3{\boldsymbol{r}}_s = \frac{1}{4}\,\frac{1}{V_\ell}\iiint\limits_{V_{\ell}} C_2 \langle \epsilon \rangle^{2/3} r^{2/3} \left( \frac{4}{3}\,\delta_{ii} - \frac{1}{3}\,\frac{r_ir_i}{r^2} \right) {\rm d}^3{\boldsymbol{r}}_s, \end{equation}
where  ${\boldsymbol {r}}_s = {\boldsymbol {r}}/2$. The integration yields
 \begin{equation} \langle k_{{sf},\ell} \rangle =\frac{C_2 \langle \epsilon \rangle^{2/3} \ell^{2/3}}{4\times 3{\rm \pi}(\ell/2)^3/4} \int\limits_{0}^{\ell/2} 4 {\rm \pi}r_s^2 (2r_s)^{2/3} \, {\rm d}r_s = \frac{3}{4} \, C_2 \langle \epsilon \rangle^{2/3} \ell^{2/3} \approx 1.6 \langle \epsilon \rangle^{2/3} \ell^{2/3}\end{equation}
when using the usual empirical Kolmogorov structure-function constant  $C_2 \approx 2.1$.
In order to evaluate  $\langle k_{{sgs},\ell } \rangle$, we use (Pope Reference Pope2000; Li & Meneveau Reference Li and Meneveau2004)
 \begin{equation} \langle \tau_{ij} \rangle = \iiint \left( 1- \hat{G}^2_\ell({\boldsymbol{k}})\right) \varPhi_{ij}({\boldsymbol{k}})\, {\rm d}^3{\boldsymbol{k}} \,\stackrel{{\tiny (i=j)}}= \, C_K \langle \epsilon \rangle^{2/3} \int_0^\infty \left( 1- \hat{G}^2_\ell({ k})\right) 2 k^{-5/3} \,{\rm d} k , \end{equation}
where  $\hat {G}_\ell ({\boldsymbol {k}})=\hat {G}_\ell ({k})$ is the Fourier transform of the filter function at scale
 $\ell$, and
 $\varPhi _{ij}({\boldsymbol {k}}) = E(k)/(4{\rm \pi} k^2)(\delta _{ij} - k_ik_j/k^2)$ is the spectral tensor for isotropic turbulence, while
 $E(k) = C_K \langle \epsilon \rangle ^{2/3} k^{-5/3}$ is the radial 3-D energy spectrum of turbulence.
For the spherical top-hat filter, its Fourier transform can be shown to be
 \begin{equation} \hat{G}_\ell({k}) = \frac{3}{(k \ell/2)^3} \left(\sin \frac{k\ell}{2} - \frac{k\ell}{2} \cos \frac{k\ell}{2} \right)\!, \end{equation}
where  $k=|{\boldsymbol {k}}|$. The definite integral needed to evaluate the right-hand side of (B4) exists (using WolframAlpha online) and is given by
 \begin{equation} \int_0^\infty \left( 1-\left[\frac{3}{(\kappa /2)^3} \left(\sin \frac{\kappa}{2} - \frac{\kappa}{2} \cos \frac{\kappa}{2} \right) \right]^2 \right) \kappa^{-5/3} \, {\rm d}\kappa =- 544\,\varGamma(-20/3), \end{equation}
with  $\kappa = k \ell$ and where
 $\varGamma (\cdot )$ is the gamma function. Evaluating and using
 $C_K \approx 1.6$, the result is
 \begin{equation} \langle k_{{sgs},\ell} \rangle = \tfrac{1}{2} \langle \tau_{ii} \rangle = 0.76 \, C_K \langle \epsilon \rangle^{2/3} \ell^{2/3} \approx 1.2\,\langle \epsilon \rangle^{2/3} \ell^{2/3}.\end{equation}
As can be seen, the 3-D integration needed to evaluate  $\langle k_{sf}\rangle$ involves the radius to the
 $8/3$ power, while that for
 $\langle k_{sgs}\rangle$ involves the wavenumber to the
 $-5/3$ power. The former is thus much more strongly dominated by the large-scale limit of integration (
 $\ell /2$) than the latter. As a result, the latter is more strongly affected by the spectral behaviour of turbulence at smaller scales, including the viscous range. This explains why the values of
 $\langle k_{sgs}\rangle$ measured from DNS are significantly smaller than the prediction in (B7), while the measurements of
 $\langle k_{sf}\rangle$ agree well with the prediction in (B3).


 Open access

